JHEP03(2020)103
Published for SISSA by SpringerReceived: November 22, 2019 Accepted: February 25, 2020 Published: March 18, 2020
Search for lepton flavour violating decays of a neutral
heavy Higgs boson to µτ and eτ in proton-proton
collisions at
√
s = 13 TeV
The CMS collaboration
E-mail: [email protected]
Abstract: A search for lepton flavour violating decays of a neutral non-standard-model Higgs boson in the µτ and eτ decay modes is presented. The search is based on proton-proton collisions at a center of mass energy √s = 13 TeV collected with the CMS detector in 2016, corresponding to an integrated luminosity of 35.9 fb−1. The τ leptons are recon-structed in the leptonic and hadronic decay modes. No signal is observed in the mass range 200–900 GeV. At 95% confidence level, the observed (expected) upper limits on the production cross section multiplied by the branching fraction vary from 51.9 (57.4) fb to 1.6 (2.1) fb for the µτ and from 94.1 (91.6) fb to 2.3 (2.3) fb for the eτ decay modes.
Keywords: Hadron-Hadron scattering (experiments), Higgs physics ArXiv ePrint: 1911.10267
JHEP03(2020)103
Contents
1 Introduction 1
2 The CMS detector 2
3 Collision data and event simulation 3
4 Event reconstruction 3
5 Event selection 6
6 Background estimation 7
6.1 Misidentified lepton background estimation from control samples in data 9
6.2 W +jets and QCD background estimation in µτe and eτµ channels 11
7 Systematic uncertainties 11 8 Results 14 8.1 H → µτ results 14 8.2 H → eτ results 17 9 Summary 17 The CMS collaboration 30 1 Introduction
The discovery of the 125 GeV Higgs boson, H(125), at the CERN LHC in 2012 [1–3] was a major breakthrough in particle physics. A combined study of data from collisions at √s = 7 and 8 TeV collected by the ATLAS and CMS Collaborations shows the particle to have properties consistent with the standard model (SM) Higgs boson [4–9] including the spin, couplings, and charge-parity assignment [10, 11]. Lepton flavour violating (LFV) decays of the H(125) are forbidden in the SM. However, the presence of new physics in the Higgs sector is not excluded [12] and there exist many possible extensions of the SM that allow LFV decays of the H(125). These include the two Higgs doublet model [13], supersymmetric models [14–20], composite Higgs models [21, 22], models with flavour symmetries [23], Randall-Sundrum models [24–26], and others [27–35]. A common feature of many of these models is the presence of additional neutral Higgs bosons (H and A) that would also have LFV decays [36,37].
The most recent search for LFV decays of the H(125) was performed by the CMS Collaboration in the µτand eτ channels, using proton-proton (pp) collision data recorded
JHEP03(2020)103
at a centre-of-mass energy of√s = 13 TeV, and corresponding to an integrated luminosity of 35.9 fb−1 [38]. The observed (expected) upper limits set on the branching fractions were B(H(125) → µτ) < 0.25 (0.25)% and B(H(125) → eτ) < 0.61 (0.37)% at 95% confidence level (CL). These constraints were a significant improvement over the previously set limits by the CMS and ATLAS Collaborations using the 8 TeV pp collision data set, corresponding to an integrated luminosity of 20 fb−1[39–42]. Results from the previous CMS H(125) →µτ search, performed using 8 TeV pp collision data, were used to set limits on high mass LFV H decays in a phenomenological study [12]. Limits on the product of the production cross section with branching fraction for the H → µτ channel were obtained for H mass, mH, less than 300 GeV.
This paper describes the first direct search for LFV H → µτ and H → eτ decays for an H mass in the range 200 < mH< 900 GeV. The search is performed in four decay channels, H →µτh, H →µτe, H → eτh, and H → eτµ whereτh,τe, andτµ correspond to the hadronic, electronic and muonic decay channels of τ leptons, respectively. The final-state signatures are very similar to those of the H →ττ decays, studied by CMS [43–46] and ATLAS [47]. However, there are some significant kinematic differences. The primary difference is that the muon (electron) in the LFV H → µ(e)τ decay is produced promptly, and tends to have a higher momentum than in the H →τµ(e)τ decay. Only the gluon fusion production process is considered in this search and the signal is modelled assuming a narrow width of the Higgs boson. The strategy is similar to the previous LFV H(125) searches performed by the CMS Collaboration, but optimised for higher mass Higgs boson decays.
This paper is organized as follows. After a brief overview of the CMS detector in section 2 and the description of the collision data and simulated samples used in the analysis in section3, the event reconstruction is described in section 4. The event selection is outlined in section 5 and the background processes are described in section 6. This is followed by a description of the systematic uncertainties in section 7. Finally, the results are presented in section8, and the paper is summarized in section 9.
2 The CMS detector
A detailed description of the CMS detector, together with a definition of the coordinate sys-tem used and the relevant kinematic variables, can be found in ref. [48]. The central feature of the CMS apparatus is a superconducting solenoid of 6 m internal diameter, providing a magnetic field of 3.8 T. Within the solenoid volume are a silicon pixel and strip tracker, a lead tungstate crystal electromagnetic calorimeter (ECAL), and a brass and scintillator hadron calorimeter (HCAL), each composed of a barrel and two endcap sections. Forward calorimeters extend the pseudorapidity (η) coverage provided by the barrel and endcap de-tectors. Muons are detected in gas-ionization chambers embedded in the steel flux-return yoke outside the solenoid. Events of interest are selected using a two-tiered trigger sys-tem [49]. The first level, composed of custom hardware processors, uses information from the calorimeters and muon detectors to select events at a rate of around 100 kHz within a time interval of less than 4 µs. The second level, known as the high-level trigger, consists of
JHEP03(2020)103
a farm of processors running a version of the full event reconstruction software optimised for fast processing, and reduces the event rate to around 1 kHz before data storage.
3 Collision data and event simulation
The data used in this analysis have been collected in pp collisions at the LHC, at a centre-of-mass energy of 13 TeV, with the CMS detector in 2016, and correspond to an integrated luminosity of 35.9 fb−1[50]. A trigger requiring at least one muon is used to collect the data sample in the H →µτh and H →µτe channels. Triggers requiring at least one electron, or a combination of an electron and a muon are used for the H → eτh and H → eτµ chan-nels respectively. Simulated samples of signal and background events are produced with different event generators. The H → µτ and H → eτ decay samples are generated with powheg 2.0 [51–56] at next-to-leading-order (NLO) in perturbative quantum chromody-namics. Only the gluon fusion (ggH) [57] production mode has been considered in this analysis. These scalar boson samples are generated assuming the narrow width approxi-mation for a range of masses from 200 to 900 GeV. The Z+jets and W +jets processes are simulated using the MadGraph5 amc@nlo 2.2.2 [58] generator at leading order with the MLM jet matching and merging [59]. The MadGraph5 amc@nlo generator is also used for diboson production which is simulated at NLO with the FxFx jet matching and merg-ing scheme [60]. The powheg 2.0 and 1.0 at NLO are used for top quark-antiquark (tt) and single top quark production, respectively. The powheg and MadGraph5 amc@nlo generators are interfaced with pythia 8.212 [61] for parton showering and fragmentation. The pythia parameters for the underlying event description are set to the CUETP8M1 tune [62]. The set of parton distribution functions (PDFs) used is NNPDF30nloas0118 [63]. The CMS detector response is modelled using Geant4 [64].
Because of the high instantaneous luminosities attained during data taking, events have multiple pp interactions per bunch crossing (pileup). This effect is taken into account in simulated samples, by generating concurrent minimum bias events, and overlapping them with simulated hard events. All simulated samples are weighted to match the pileup distribution observed in data, which has an average of approximately 23 interactions per bunch crossing.
4 Event reconstruction
The event reconstruction is performed using a particle-flow (PF) algorithm, which aims to reconstruct and identify each individual particle in an event (PF candidate), with an optimised combination of information from the various elements of the CMS detector [65]. In this process, the identification of the particle type for each PF candidate (photon, electron, muon, charged or neutral hadron) plays an important role in the determination of the particle direction and energy. The primary pp vertex of the event is identified as the reconstructed vertex with the largest value of summed physics-object p2T, where pT is the transverse momentum. The physics objects are the jets, clustered using the jet finding
JHEP03(2020)103
algorithm [66, 67] with the tracks assigned to the vertex as inputs, and the associated missing transverse momentum, taken as the negative vector sum of the pT of those jets.
A muon is identified as a track in the silicon detectors, consistent with the primary pp vertex and with either a track or several hits in the muon system, associated with an energy deposit in the calorimeters compatible with the expectations for a muon [65,68]. Identification is based on the number of spatial points measured in the tracker and in the muon system, the track quality, and its consistency with the event vertex location. The identification working point chosen for this analysis reconstructs muons with an efficiency above 98% and a hadron misidentification rate of 0.1% for pions and 0.3% for kaons. The energy is obtained from the corresponding track momentum. An important aspect of muon reconstruction is the lepton isolation that is described later in this section.
An electron is identified as a charged-particle track from the primary pp vertex in combination with one or more ECAL energy clusters. These clusters are matched with the track extrapolation to the ECAL and with possible bremsstrahlung photons emitted when interacting with the material of the tracker [69]. Electron candidates are accepted in the pseudorapidity range |η| < 2.5, with the exception of the region 1.44 < |η| < 1.57 where service infrastructure for the detector is located. They are identified using a multivariate-analysis (MVA) discriminator that combines observables sensitive to the amount of bremsstrahlung along the electron trajectory, the geometric and momentum matching between the electron trajectory and associated clusters, as well as various shower shape observables in the calorimeters. Electrons from photon conversions are removed. The chosen working point for selecting the electrons assures an average identification efficiency of 80% with a misidentification probability of 5%. The energy of electrons is determined from a combination of the track momentum at the primary vertex, the corresponding ECAL cluster energy, and the energy sum of all bremsstrahlung photons associated with the track. Charged hadrons are identified as charged-particle tracks neither identified as electrons, nor as muons. Finally, neutral hadrons are identified as HCAL energy clusters not linked to any charged hadron trajectory, or as a combined ECAL and HCAL energy excess with respect to the expected charged hadron energy deposit. All the PF candidates are clustered into hadronic jets using the infrared- and collinear-safe anti-kTalgorithm [66], implemented
in the FastJet package [70], with a distance parameter of 0.4. Jet momentum is deter-mined as the vectorial sum of all particle momenta in the jet, and is found from simulation to be, on average, within 5 to 10% of the true momentum over the whole pT spectrum and
de-tector acceptance. Additional proton-proton interactions within the same or nearby bunch crossings can contribute additional tracks and calorimetric energy depositions, increasing the apparent jet momentum. To mitigate this effect, tracks identified to be originating from pileup vertices are discarded and an offset correction is applied to correct for remaining con-tributions. Jet energy corrections are derived from simulation studies so that the average measured response of jets becomes identical to that of particle level jets. In situ measure-ments of the momentum balance in dijet, photon+jet, Z+jets, and multijet events are used to determine any residual differences between the jet energy scale in data and in simulation, and appropriate corrections are made [71]. Additional selection criteria are applied to each jet to remove jets potentially dominated by instrumental effects or reconstruction failures.
JHEP03(2020)103
Hadronically decayingτleptons (τh) are reconstructed and identified using the hadrons-plus-strips algorithm [72, 73]. The reconstruction starts from a jet and searches for the products of the main τ lepton decay modes: one charged hadron and up to two neutral pions, or three charged hadrons. To improve the reconstruction efficiency in the case of conversion of the photons from a neutral-pion decay, the algorithm considers the PF photons and electrons from a strip along φ. The sign of the τh candidate is determined through its decay products.
An MVA discriminator, based on variables such as lifetime information, decay mode, multiplicity of neutral, charged and pileup particles in a cone around the reconstructedτh, is used to reduce the rate for quark- and gluon-initiated jets identified as τh candidates. The working point used in the analysis is a “tight” one, with an efficiency of about 50% for a genuine τh, and approximately a 0.2% misidentification rate for quark and gluon jets [73]. Additionally, muons and electrons misidentified as τh are rejected by considering the consistency between the measurements in the tracker, calorimeters, and muon detectors. The specific identification criteria depend on the final state studied and on the background composition. The τ leptons that decay to muons and electrons are reconstructed in the same manner as prompt muons and electrons, respectively, as described above.
The variable ∆R = p(∆η)2+ (∆φ)2 is used to measure the separation between re-constructed objects in the detector, where η and φ are the pseudorapidity and azimuthal directions, respectively.
Jets misidentified as muons or electrons are suppressed by imposing isolation require-ments. The muon (electron) isolation is measured relative to its p`T (` =µ, e) by summing over the pT of PF particles in a cone with ∆R = 0.4 (0.3) around the lepton, excluding the lepton itself:
Irel` =
P pchargedT + maxh0,P pneutralT +P pγT− pPUT (`)i p`T
,
where pchargedT , pneutralT , and pγT indicate the pT of a charged and of a neutral particle, and a photon within the cone, respectively. The neutral particle contribution to isolation from pileup, pPUT (`), is estimated from the pT sum of charged hadrons not originating from
the primary vertex scaled by a factor of 0.5 [68] for the muons. For the electrons, this contribution is estimated from the area of the jet and the average energy density of the event [74, 75]. The charged-particle contribution to isolation from pileup is rejected by requiring the tracks to originate from the primary vertex. Jet arising from a b quark are identified by the combined secondary vertex b tagging algorithm [76] using the working point characterised by a b jet identification efficiency around 65% and a misidentification probability around 1% for light quark and gluon jets.
All the reconstructed particles in the event are used to estimate the missing transverse momentum, ~pTmiss, which is defined as the projection onto the plane perpendicular to the beam axis of the negative vector sum of the momenta of all reconstructed PF candidates in an event [77]. The effect of the jet energy corrections described earlier in this section is then propagated to this ~pTmiss. The magnitude of the final vector is referred to as pmissT .
JHEP03(2020)103
The transverse mass mT(`) is a variable formed from the lepton transverse momentum and the missing transverse momentum vectors: mT(`) =p2|~p`T||~pTmiss|(1 − cos ∆φ
`−pmissT ),
where ∆φ`−pmiss
T is the angle between the lepton transverse momentum and the missing
transverse momentum. The collinear mass, Mcol, provides an estimate of mH using the ob-served decay products of the Higgs boson candidate. It is reconstructed using the collinear approximation based on the observation that, since mH mτ, theτ lepton decay products
are highly boosted in the direction of the τ candidate [78]. The neutrino momenta can be approximated to have the same direction as the other visible decay products of the τ lepton (~τvis) and the component of the ~pTmiss in the direction of the visible τ lepton decay products is used to estimate the transverse component of the neutrino momentum (pν, estT ). The collinear mass is then Mcol = Mvis/pxvisτ , where x
vis
τ is the fraction of momentum
carried by the visible decay products of the τ lepton, xvisτ = p ~τvis T /(p ~τvis T + p ν, est T ), and Mvis
is the visible mass of theτ− e or τ−µ system.
Dedicated performance studies on data validate the reconstruction and identification techniques described in this section. When necessary, corrections have been applied to the simulated samples to ensure they correctly describe the behaviour of the data [68,69,71,
73,76,77].
5 Event selection
The event selection is performed in two steps. An initial selection is followed by another, final, set of requirements on kinematic variables that exploit the distinct event topology of the signal. The event sample defined by the initial selection is used in the background estimation described in section 6. The event selection begins by requiring two isolated leptons of opposite charge, different flavour, and separated by ∆R > 0.3. The isolation of theτhcandidates is included in the MVA discriminator described in section 4. Events with additional µ, e, or τh candidates respectively with pT > 10, 5, or 20 GeV are discarded. The kinematic requirements applied are dictated by the triggers or detector acceptance and are summarized in table1.
The events are then divided into two categories according to the number of jets in the event. The jets are required to have pT > 30 GeV and |η| < 4.7. Events with no jets form the 0-jet category while events with exactly one jet form the 1-jet category. The 1-jet category includes ggH production with initial state radiation. Events with more than one jet are discarded.
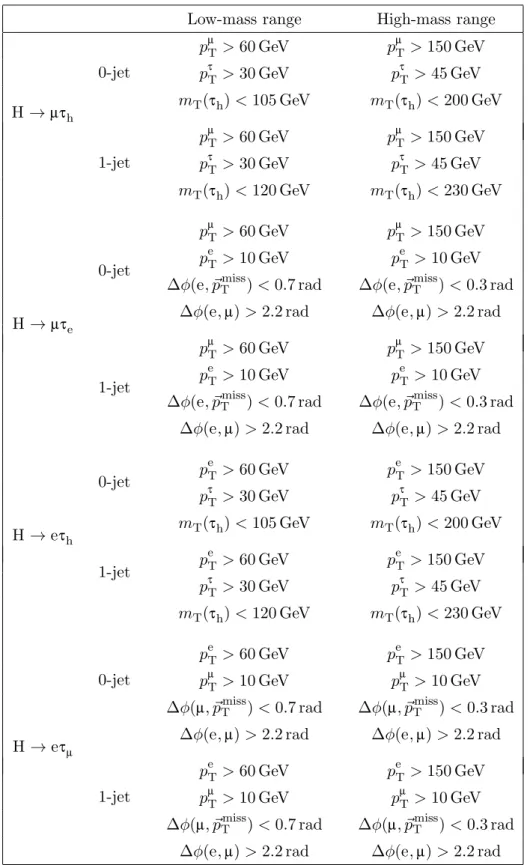
The final selection is given in table2. It begins by tightening the pT requirement of the
prompt lepton from the Higgs boson decay, as it provides a powerful discriminant against the background. Theτ lepton in the H decay is highly boosted, leading to a collimation of the decay products. This can be exploited by either limiting the azimuthal separation of the decay products including the ~pTmiss, or imposing a requirement on the transverse mass mT(τ), which is strongly correlated with the azimuthal separation. These selection criteria are optimised for each decay mode in two mHranges to obtain the most stringent expected upper limits. The low- and high-mass regions are defined to be 200 < mH< 450 GeV and
JHEP03(2020)103
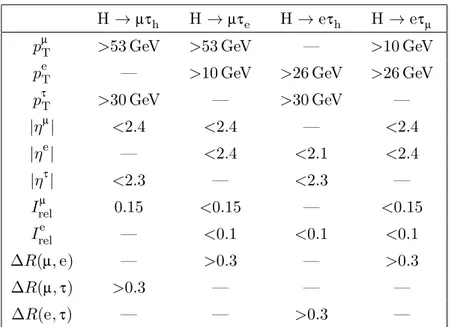
H →µτh H →µτe H → eτh H → eτµ pµT >53 GeV >53 GeV — >10 GeV peT — >10 GeV >26 GeV >26 GeV pτ T >30 GeV — >30 GeV — |ηµ| <2.4 <2.4 — <2.4 |ηe| — <2.4 <2.1 <2.4 |ητ| <2.3 — <2.3 — Irelµ 0.15 <0.15 — <0.15 Irele — <0.1 <0.1 <0.1 ∆R(µ, e) — >0.3 — >0.3 ∆R(µ,τ) >0.3 — — — ∆R(e,τ) — — >0.3 —
Table 1. Initial selection criteria applied to the kinematic variables for the H → µτ and H → eτ analyses. The selected sample is used in the background estimation from control samples in data.
450 < mH< 900 GeV, respectively. A binned likelihood fit to the Mcoldistributions is then
used to extract signal and background contributions. The Mcol approximates the Higgs mass better than the widely used Mvis, and therefore improves the separation of the signal
from the background. This improvement is larger in the high mass regime, with up to a factor of three gain in sensitivity when compared to the use of Mvis.
6 Background estimation
The most significant background in the µτh and eτh channels comes from the W + jets process and from events comprised uniquely of jets produced through the strong interac-tion, referred to as quantum chromodynamics (QCD) multijet events. In these processes, jets are misidentified as electrons, muons or τ leptons. This background is estimated with the collected data. The main background in the µτe and eτµ channels is tt production. It is estimated using simulations. Other smaller backgrounds include electroweak diboson (WW, WZ, and ZZ), Drell-Yan (DY)→ `` (` = e,µ) + jets, DY→ ττ+ jets, SM Higgs boson (H →ττ, WW), Wγ(∗)+jets, and single top quark production processes. These are estimated using simulations. Gluon fusion, vector boson fusion, and associated production mechanisms are considered for the SM Higgs boson background. The background estima-tion techniques are described in detail below, and are validated with control regions that are enhanced with the dominant backgrounds.
The DY→ ``,ττ background is estimated from simulation. A reweighting is applied to the generator-level Z boson pT and invariant mass, m``,ττ, distributions to correct for a shape discrepancy between data and simulation. The reweighting factors, extracted from a control region enriched in Z →µµevents, are applied in bins of Z boson pT and m``,ττ as
JHEP03(2020)103
Low-mass range High-mass range
H →µτh 0-jet pµT> 60 GeV pµT > 150 GeV pτT> 30 GeV pτT > 45 GeV mT(τh) < 105 GeV mT(τh) < 200 GeV 1-jet pµ T> 60 GeV p µ T > 150 GeV pτT> 30 GeV pτT > 45 GeV mT(τh) < 120 GeV mT(τh) < 230 GeV H →µτe 0-jet pµT> 60 GeV pµT > 150 GeV peT> 10 GeV peT > 10 GeV ∆φ(e, ~pTmiss) < 0.7 rad ∆φ(e, ~pTmiss) < 0.3 rad
∆φ(e,µ) > 2.2 rad ∆φ(e,µ) > 2.2 rad
1-jet
pµT> 60 GeV pµT > 150 GeV peT> 10 GeV peT > 10 GeV ∆φ(e, ~pTmiss) < 0.7 rad ∆φ(e, ~pTmiss) < 0.3 rad
∆φ(e,µ) > 2.2 rad ∆φ(e,µ) > 2.2 rad
H → eτh 0-jet p e T> 60 GeV p e T > 150 GeV pτ T> 30 GeV p τ T > 45 GeV mT(τh) < 105 GeV mT(τh) < 200 GeV 1-jet p e T> 60 GeV p e T > 150 GeV pτ T> 30 GeV p τ T > 45 GeV mT(τh) < 120 GeV mT(τh) < 230 GeV H → eτµ 0-jet peT> 60 GeV peT > 150 GeV pµT> 10 GeV pµT > 10 GeV ∆φ(µ, ~pTmiss) < 0.7 rad ∆φ(µ, ~pTmiss) < 0.3 rad
∆φ(e,µ) > 2.2 rad ∆φ(e,µ) > 2.2 rad
1-jet peT> 60 GeV peT > 150 GeV pµ T> 10 GeV p µ T > 10 GeV
∆φ(µ, ~pTmiss) < 0.7 rad ∆φ(µ, ~pTmiss) < 0.3 rad
∆φ(e,µ) > 2.2 rad ∆φ(e,µ) > 2.2 rad
Table 2. Final event selection criteria for the low-mass range, 200 < mH < 450 GeV, and the
JHEP03(2020)103
applied to the simulated DY sample when the reconstructed τh candidate is matched to an electron for the H → eτh channel or a muon for the H →µτh channel, respectively, at the generator level. These corrections depend on the lepton η and are measured in Z → `` data events.
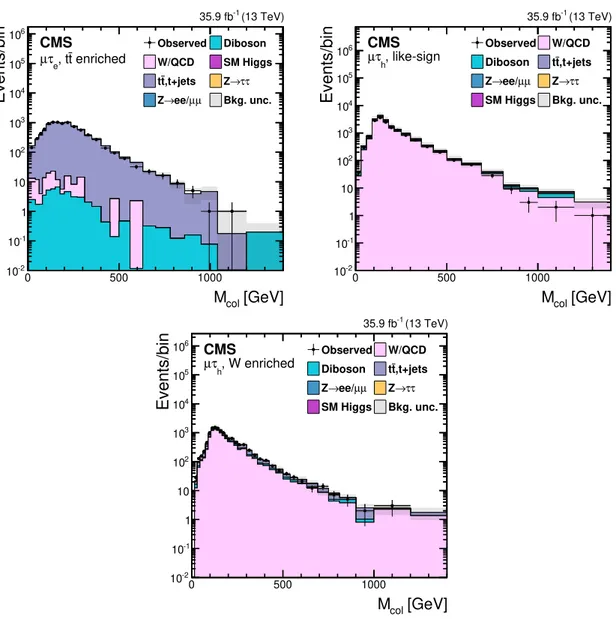
The tt background is also estimated using simulation. The overall normalisation of this estimate in the signal region is corrected with a rescaling factor derived from a control region enriched in tt events, defined by requiring the initial selection with the additional requirement that at least one of the jets is b tagged. Figure 1 (upper left) shows the data compared to the background estimate in the tt -enriched region in the H →µτe channel.
Jets from W+jets and QCD multijet events that are misidentified as electrons, muons and, mainly, τ leptons, are leading source of background in the µτh and eτh channels. In W + jets events, one lepton candidate is expected to be a genuine lepton from the W decay and the other a jet misidentified as a lepton. In QCD multijet events, both lepton candidates are misidentified jets. A technique fully based on control samples in data is used to estimate the misidentified lepton background in theµτh and eτh channels, for which it is the dominant contribution. In theµτeand eτµ channels, this background is estimated using a combination of simulated samples and control regions in data. These methods have been used in refs. [38] and [45], and a detailed description can be found in those publications. However, we are briefly describing the techniques in the following subsections.
6.1 Misidentified lepton background estimation from control samples in data The misidentified-lepton background is estimated from data. The misidentification prob-abilities, fi, where i = µ, e, or τh, are evaluated with independent Z +jets data sets and then applied to a control sample. The control sample is obtained by relaxing the signal selection requirements, the µ, e, or τh isolation, and excluding events passing the signal selection. The fiare estimated using events with a Z boson candidate and one jet that can
be misidentified as µ, e, orτ. The Z boson candidate is formed requiring two muons with pT > 26 GeV, |η| < 2.4, and I
µ
rel < 0.15. The muons are required to have opposite charges
and the dimuon invariant mass, mµµ, must satisfy 76 < mµµ < 106 GeV. The contribution
from diboson events, where the third lepton candidate corresponds to a genuine µ, e, or τ, is subtracted using simulation. Two Z + jets samples are defined: a signal-like one, in which the jet satisfies the same µ, e, or τ selection criteria used in the H →µτ or H → eτ selections, and a background-enriched Z + jets sample with relaxed identification on the jet misidentified asµ, e, orτ, but excluding events selected in the signal-like sample. The requirements on the third candidate, i.e. the misidentified jet, depend on the lepton flavour. The two samples are used to estimate fi as
fi= Ni(Z +jets signal-like)
Ni(Z +jets background-enriched) + Ni(Z +jets signal-like),
where Ni(Z +jets signal-like) is the number of events with a third candidate (µ, e, orτ) that passes the signal-like sample selection, and Ni(Z +jets background-enriched) is the number
of events in the background-enriched sample. The background-enriched selection used to estimate the misidentified µ and e contribution requires an isolation of 0.15 < Irelµ < 0.25
JHEP03(2020)103
[GeV] col M 0 500 1000 Events/bin -2 10 -1 10 1 10 2 10 3 10 4 10 5 10 6 10 Observed Diboson W/QCD SM Higgs ,t+jets t t Z→ττ µ µ ee/ → Z Bkg. unc. (13 TeV) -1 35.9 fb CMS enriched t , t e τ µ [GeV] col M 0 500 1000 Events/bin -2 10 -1 10 1 10 2 10 3 10 4 10 5 10 6 10 Observed W/QCD Diboson tt,t+jets µ µ ee/ → Z Z→ττ SM Higgs Bkg. unc. (13 TeV) -1 35.9 fb CMS , like-sign h τ µ [GeV] col M 0 500 1000 Events/bin -2 10 -1 10 1 10 2 10 3 10 4 10 5 10 6 10 Observed W/QCD Diboson tt,t+jets µ µ ee/ → Z Z→ττ SM Higgs Bkg. unc. (13 TeV) -1 35.9 fb CMS , W enriched h τ µFigure 1. The Mcoldistribution in the tt enriched (upper left), like-sign lepton (upper right), and
W +jets enriched (lower) control samples defined in the text. The uncertainty bands include both statistical and systematic uncertainties from section 7. No fit is performed for these distributions. The different background processes shown are normalised to the luminosity of the data either using the theoretical prediction of the corresponding production cross section or directly from the data driven technique described in the text.
and 0.1 < Irele < 0.5, respectively. In both cases the misidentification rate is computed and applied as a function of the lepton pT. The lepton selection for theτhbackground-enriched sample requires that the τh lepton candidates are identified using a loose τh identification and isolation working point but are not identified by the tight working point used for the signal selection. The loose and tight working points have an efficiencies of 70 and 50% for genuine τh candidates, respectively.
The τh misidentification rates have a pT dependence that varies with the number of charged pions in the decay. They are estimated and applied as a function of pT and for
JHEP03(2020)103
either one or three charged pions in the decay. The misidentified background in the signal sample is obtained from control samples for each lepton flavour. The selection requirements for these samples are the same as for the signal sample except that theµ, e, orτshould pass the identification and isolation criteria used for the Z+jets background-enriched sample, but not those defining the Z+jets signal-like sample. To estimate the misidentified background in the signal sample, each event in this background enriched sample is weighted by a factor fi/(1 − fi). The background from misidentified muons and electrons is estimated to be less
than 5% of the misidentifiedτh lepton background and is neglected.
The background estimate is validated in a like-sign sample by applying the misidenti-fication rate fi to events selected by requiring the µ, e, or τ in the pairs having the same charge in both the background-enriched and the signal-like samples. This validation is per-formed after the initial selection described in section 5. Figure 1 (upper right) shows the data compared to the background estimate in the like-sign control region for the H →µτh channel. The like-sign selection enhances the misidentified-lepton background, and this sample is expected to be composed of a similar fraction of W + jets and QCD multijet events. The background estimate is also validated in a W boson enriched control sample. This data sample is obtained by applying the signal sample requirements and mT cuts, 50 < mT(`) < 110 GeV (` =µ or e) and mT(τ ) > 50 GeV. The misidentified background in the signal region and W boson enriched control sample are both dominated by W +jets events, with QCD multijet events forming a small fraction of the samples. Figure1(lower) shows the data compared to the background estimate in the W+jets enriched sample for the H →µτh channel. The background expectation for the H → eτh channel is also validated with the same samples and gives similar agreement.
6.2 W +jets and QCD background estimation in µτe and eτµ channels
The W + jets background contribution to the misidentified background is estimated with simulations. The QCD multijet contribution is estimated with like-sign data events that pass all the other signal requirements. The remaining non-QCD background is estimated using simulation. The resulting sample is then rescaled to account for the differences between the background composition in the like and opposite sign samples. The scaling factors are extracted from QCD multijet enriched control samples, composed of events where the lepton candidates satisfy inverted isolation requirements, as explained in ref. [45]. This background contribution accounts for a negligible fraction of the total yield after selection in both µτe and eτµ channels.
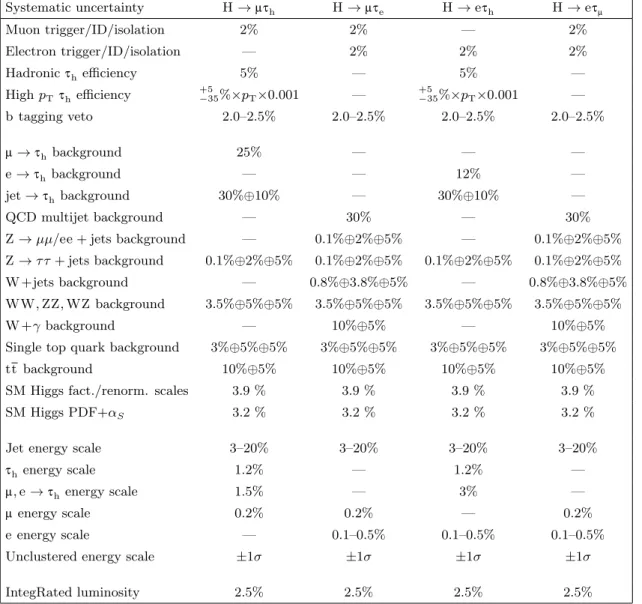
7 Systematic uncertainties
Systematic uncertainties arise from both experimental and theoretical sources and can affect the normalisation and the shape of the collinear mass distribution. They are sum-marized in table 3.
The uncertainties in the muon, electron and τ lepton selection including the trigger, identification (ID), and isolation efficiencies are estimated from collision data sets of Z bosons decaying to ee,µµ,τµτh [68,69,73]. They result in changes of normalisation, with
JHEP03(2020)103
Systematic uncertainty H →µτh H →µτe H → eτh H → eτµ Muon trigger/ID/isolation 2% 2% — 2% Electron trigger/ID/isolation — 2% 2% 2% Hadronicτhefficiency 5% — 5% — High pTτhefficiency +5 −35%×pT×0.001 — +5 −35%×pT×0.001 — b tagging veto 2.0–2.5% 2.0–2.5% 2.0–2.5% 2.0–2.5% µ→τh background 25% — — — e →τhbackground — — 12% — jet →τh background 30%⊕10% — 30%⊕10% — QCD multijet background — 30% — 30%Z → µµ/ee + jets background — 0.1%⊕2%⊕5% — 0.1%⊕2%⊕5%
Z → τ τ + jets background 0.1%⊕2%⊕5% 0.1%⊕2%⊕5% 0.1%⊕2%⊕5% 0.1%⊕2%⊕5%
W +jets background — 0.8%⊕3.8%⊕5% — 0.8%⊕3.8%⊕5%
WW, ZZ, WZ background 3.5%⊕5%⊕5% 3.5%⊕5%⊕5% 3.5%⊕5%⊕5% 3.5%⊕5%⊕5%
W +γ background — 10%⊕5% — 10%⊕5%
Single top quark background 3%⊕5%⊕5% 3%⊕5%⊕5% 3%⊕5%⊕5% 3%⊕5%⊕5%
tt background 10%⊕5% 10%⊕5% 10%⊕5% 10%⊕5%
SM Higgs fact./renorm. scales 3.9 % 3.9 % 3.9 % 3.9 %
SM Higgs PDF+αS 3.2 % 3.2 % 3.2 % 3.2 %
Jet energy scale 3–20% 3–20% 3–20% 3–20%
τh energy scale 1.2% — 1.2% —
µ, e →τh energy scale 1.5% — 3% —
µ energy scale 0.2% 0.2% — 0.2%
e energy scale — 0.1–0.5% 0.1–0.5% 0.1–0.5%
Unclustered energy scale ±1σ ±1σ ±1σ ±1σ
IntegRated luminosity 2.5% 2.5% 2.5% 2.5%
Table 3. The systematic uncertainties for the four channels. All uncertainties are treated as correlated between the categories, except those with more values separated by the ⊕ symbol. In the case of two values, the first value is the correlated uncertainty and the second value is the uncorrelated uncertainty for each individual category. In the case of three values, the first and second values correspond to the uncertainties arising from factorisation and renormalisation scales and PDF variations and are correlated between categories, while the third value is the uncorrelated uncertainty for each individual category. Two values separated by the “–” sign represent the range of the uncertainties from the different sources and/or in the different jet categories.
JHEP03(2020)103
mH (GeV) Cross section (pb) Theory, Gaussian (%) PDF+αS (%)
200 16.94 ±1.8 ±3.0 300 6.59 ±1.8 ±3.0 450 2.30 ±2.0 ±3.1 600 1 ±2.1 ±3.5 750 0.50 ±2.1 ±4.0 900 0.27 ±2.2 ±4.6
Table 4. Theoretical uncertainties from [79] are applied to the Higgs boson production cross sections for the different masses. In the reference, the PDF and αS uncertainties are computed
fol-lowing the recommendation of the PDF4LHC working group. The remaining Gaussian uncertainty accounts for additional intrinsic sources of theory uncertainty described in detail in the reference.
the exception of the uncertainty on high pT τ lepton efficiency that changes both yield and Mcol distribution shape. The b tagging efficiency is measured in collision data, and the simulation is adjusted accordingly to match with it. The uncertainty in this measurement is taken as the systematic error affecting the normalisation of the simulation [76].
The uncertainties in the estimate of the misidentified-lepton backgrounds (µ →τh, e → τh, jet →τh,µ, e) are extracted from the validation tests in control samples, as described in section 6; they affect both the normalisation and the shape of the Mcol distribution.
The uncertainty in the QCD multijet background yield is 30%, and corresponds to the uncertainty in the extrapolation factor from the same-sign to the opposite-sign region, as determined in ref. [45]. The uncertainties in the background contributions from Z, WW, ZZ, Wγ, tt and single-top quark arise predominantly from those in the measured cross sections of these processes and are applied as uncertainties in sample normalisation. The uncertainties in the Higgs boson production cross sections due to the factorisation and the renormalisation scales, as well as the PDFs and the strong coupling constant (αS),
result in changes in normalisation. They are taken from ref. [79] and summarized in table3
for the SM Higgs boson and table4 for heavy Higgs bosons. Only effects on the total rate are considered. Effects on the acceptance have been neglected.
Shape and normalization uncertainties arising from the uncertainty in the jet energy scale are computed by propagating the effect of altering each source of jet energy scale uncertainty by ±1 standard deviation to the fit templates of each process. There are 27 independent sources of jet energy scale uncertainty, fully correlated between categories and τ lepton decay channels.
The uncertainty in the τh energy scale is treated equally for the two independent channels: H →µτhand H → eτh. It is propagated to the collinear mass distributions. Also, the uncertainty in the energy scale of electrons and muons misidentified asτhis propagated to the Mcoldistributions and produces changes in the distribution shape and normalization. Systematic uncertainties in the electron energy scale and resolution include the effects of electron selection efficiency, pseudorapidity dependence and categorisation, summed in quadrature. They impact both the normalization and shape of the Mcoldistribution. The
JHEP03(2020)103
systematic uncertainties in the energy resolution have negligible effect. The uncertainty in muon energy scale and resolution is also treated in the same manner. Scale uncertainties on the energy from jets with pT below 15 GeV and PF candidates not clustered inside jets (unclustered energy scale uncertainty) are also considered [77]. They are estimated independently for four particle categories: charged particles, photons, neutral hadrons, and very forward particles which are not contained in jets. The effect of shifting the energy of each particle by its uncertainty is propagated to pmissT and leads to both changes in shape of
the distribution and in overall predicted yields. The different systematic uncertainties from the four particle categories, for the unclustered energy scale, are considered uncorrelated.
The bin-by-bin uncertainties [80] account for the statistical uncertainties in every bin of the template distributions of every process. They are uncorrelated between bins, processes, and categories.
Shape uncertainties related to the pileup have been considered by varying the weights applied to simulation. This weight variation is obtained changing by 5% the total inelastic cross section used in the estimate of the pileup events in data [81]. The new values are then applied, event by event, to produce alternative collinear mass distributions used as shape uncertainties in the fit. Other minimum bias event modelling and simulation uncertainties are estimated to be much smaller and are therefore neglected. The uncertainty on the in-tegrated luminosity affects all processes with normalization taken directly from simulation.
8 Results
After all selection criteria have been applied, a binned maximum likelihood fit is performed on the Mcol distributions in the range 0–1400 GeV, looking for a signal-like excess on top of the estimated background. No fit on the control region is performed. The systematic uncertainties are represented by nuisance parameters, assuming a log normal prior for nor-malisation parameters, and Gaussian priors for Mcolshape uncertainties. The uncertainties that affect the shape of the Mcol distribution, mainly those corresponding to the energy scales, are represented by nuisance parameters whose variation results in a modification of the distribution [82, 83]. A profile likelihood ratio is used as test statistic. The 95% CL upper limits on the H production cross section times branching fraction to LFV lep-ton channels, σ(gg → H)B(H → µτ) and σ(gg → H)B(H → eτ), are set using the CLs
criterion [84,85] and the asymptotic approximation of the distributions of the LHC test-statistic [86], in a combined fit to the Mcol distributions. The limits are also computed per channel and category. The upper limits are derived in the analysed mass range in steps of 50 GeV. Where simulated samples are not available, shapes and yields are interpolated from the neighbouring samples with a moment morphing algorithm that derive the Mcol
distribution from the two closest simulated mass points. 8.1 H → µτ results
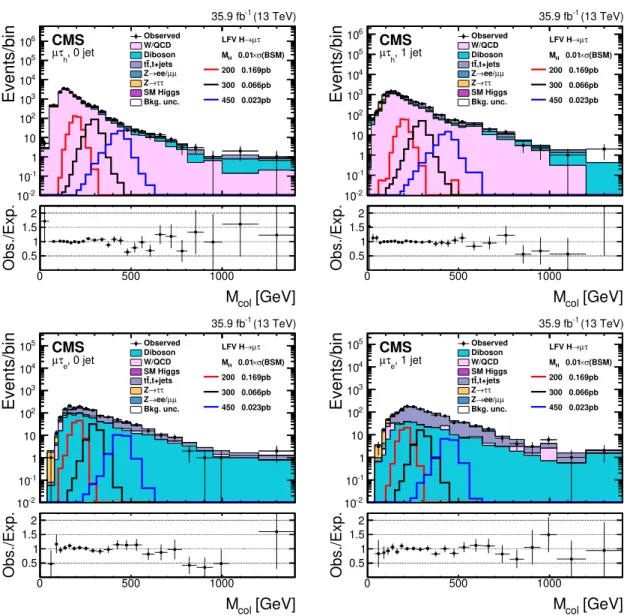
The distributions of the collinear mass Mcol compared to the signal and background
con-tributions in the H → µτh and H → µτe channels, in each jet category, are shown in figures2 and3. No excess over the background expectation is observed. The observed and
JHEP03(2020)103
[GeV] col M 0 500 1000 Obs./Exp. 0.5 1 1.5 2 Events/bin -2 10 -1 10 1 10 2 10 3 10 4 10 5 10 6 10 ObservedW/QCD Diboson ,t+jets t t µ µ ee/ → Z τ τ → Z SM Higgs Bkg. unc. τ µ → LFV H (BSM) σ × 0.01 H M 200 0.169pb 300 0.066pb 450 0.023pb (13 TeV) -1 35.9 fb CMS , 0 jet h τ µ [GeV] col M 0 500 1000 Obs./Exp. 0.5 1 1.5 2 Events/bin -2 10 -1 10 1 10 2 10 3 10 4 10 5 10 6 10 Observed W/QCD Diboson ,t+jets t t µ µ ee/ → Z τ τ → Z SM Higgs Bkg. unc. τ µ → LFV H (BSM) σ × 0.01 H M 200 0.169pb 300 0.066pb 450 0.023pb (13 TeV) -1 35.9 fb CMS , 1 jet h τ µ [GeV] col M 0 500 1000 Obs./Exp. 0.5 1 1.5 2 Events/bin -2 10 -1 10 1 10 2 10 3 10 4 10 5 10 ObservedDiboson W/QCD SM Higgs ,t+jets t t τ τ → Z µ µ ee/ → Z Bkg. unc. τ µ → LFV H (BSM) σ × 0.01 H M 200 0.169pb 300 0.066pb 450 0.023pb (13 TeV) -1 35.9 fb CMS , 0 jet e τ µ [GeV] col M 0 500 1000 Obs./Exp. 0.5 1 1.5 2 Events/bin -2 10 -1 10 1 10 2 10 3 10 4 10 5 10 Observed Diboson W/QCD SM Higgs ,t+jets t t τ τ → Z µ µ ee/ → Z Bkg. unc. τ µ → LFV H (BSM) σ × 0.01 H M 200 0.169pb 300 0.066pb 450 0.023pb (13 TeV) -1 35.9 fb CMS , 1 jet e τ µFigure 2. The Mcoldistribution in the signal region, for theµτh(upper) andµτe (lower) channels
for the Higgs boson mass in the range 200–450 GeV for 0-jet (left) and 1-jet (right) categories. The uncertainty bands include both statistical and systematic uncertainties. The plotted values are number of events per bin using a variable bin size. The background is normalised to the best fit values from a binned likelihood fit, discussed in the text, to the background only hypothesis. For depicting the signals a branching fraction of 1% and BSM cross sections from ref. [79] are assumed.
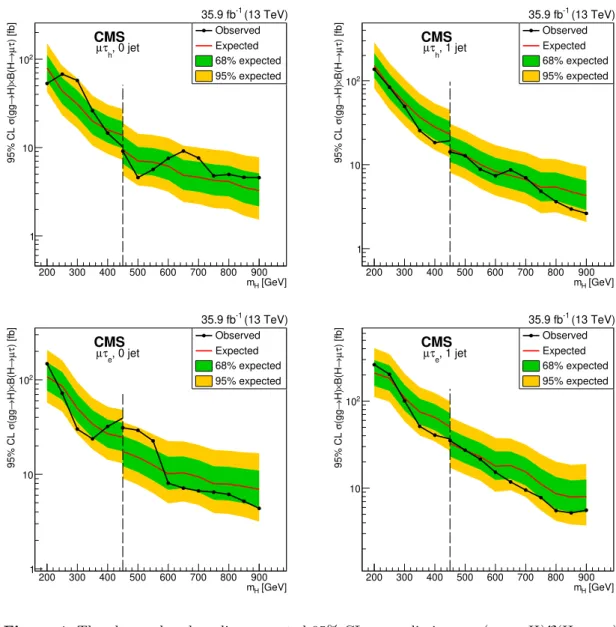
median expected 95% CL upper limits on σ(gg → H)B(H →µτ) range from 51.9 (57.4) fb to 1.6 (2.1) fb, and are given for each category in table 5.The limits are also summarized graphically in figure 4 for the individual categories, and in figure5 for the combination of the twoτ decay channels.
JHEP03(2020)103
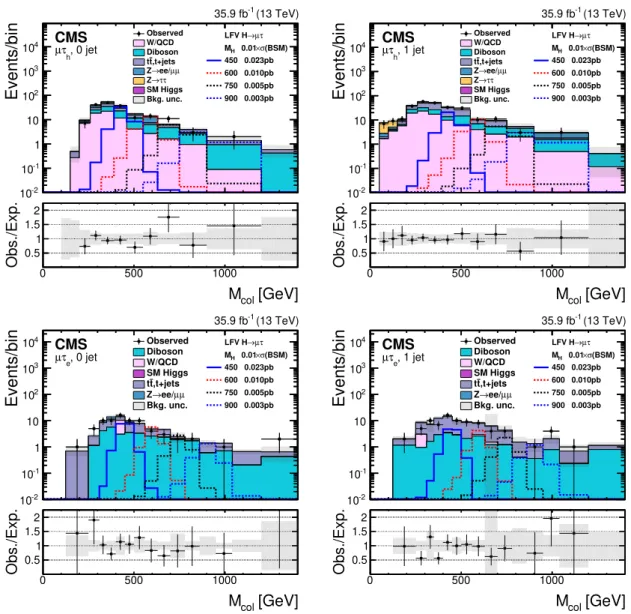
[GeV] col M 0 500 1000 Obs./Exp. 0.5 1 1.5 2 Events/bin -2 10 -1 10 1 10 2 10 3 10 4 10 Observed W/QCD Diboson ,t+jets t t µ µ ee/ → Z τ τ → Z SM Higgs Bkg. unc. τ µ → LFV H (BSM) σ × 0.01 H M 450 0.023pb 600 0.010pb 750 0.005pb 900 0.003pb (13 TeV) -1 35.9 fb CMS , 0 jet h τ µ [GeV] col M 0 500 1000 Obs./Exp. 0.5 1 1.5 2 Events/bin -2 10 -1 10 1 10 2 10 3 10 4 10 Observed W/QCD Diboson ,t+jets t t µ µ ee/ → Z τ τ → Z SM Higgs Bkg. unc. τ µ → LFV H (BSM) σ × 0.01 H M 450 0.023pb 600 0.010pb 750 0.005pb 900 0.003pb (13 TeV) -1 35.9 fb CMS , 1 jet h τ µ [GeV] col M 0 500 1000 Obs./Exp. 0.5 1 1.5 2 Events/bin -2 10 -1 10 1 10 2 10 3 10 4 10 Observed Diboson W/QCD SM Higgs ,t+jets t t µ µ ee/ → Z Bkg. unc. τ µ → LFV H (BSM) σ × 0.01 H M 450 0.023pb 600 0.010pb 750 0.005pb 900 0.003pb (13 TeV) -1 35.9 fb CMS , 0 jet e τ µ [GeV] col M 0 500 1000 Obs./Exp. 0.5 1 1.5 2 Events/bin -2 10 -1 10 1 10 2 10 3 10 4 10 Observed Diboson W/QCD SM Higgs ,t+jets t t µ µ ee/ → Z Bkg. unc. τ µ → LFV H (BSM) σ × 0.01 H M 450 0.023pb 600 0.010pb 750 0.005pb 900 0.003pb (13 TeV) -1 35.9 fb CMS , 1 jet e τ µFigure 3. The Mcoldistribution in the signal region, for theµτh(upper) andµτe (lower) channels
for the Higgs boson mass in the range 450–900 GeV for 0-jet (left) and 1-jet (right) categories. The uncertainty bands include both statistical and systematic uncertainties. The plotted values are number of events per bin using a variable bin size. The background is normalised to the best fit values from a binned likelihood fit, discussed in the text, to the background only hypothesis. For depicting the signals a branching fraction of 1% and BSM cross sections from ref. [79] are assumed.
JHEP03(2020)103
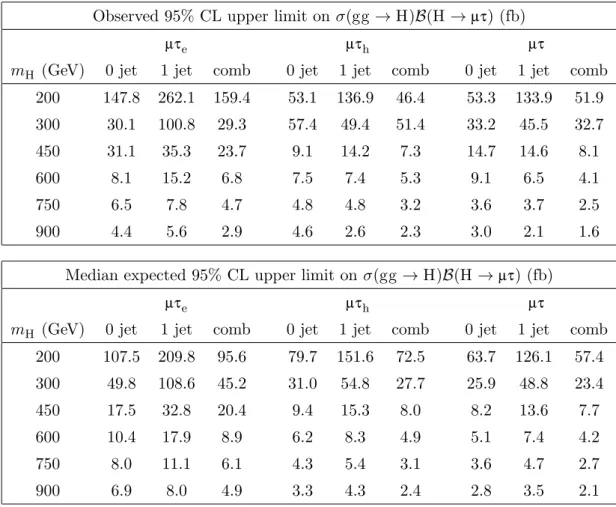
Observed 95% CL upper limit on σ(gg → H)B(H →µτ) (fb)
µτe µτh µτ
mH (GeV) 0 jet 1 jet comb 0 jet 1 jet comb 0 jet 1 jet comb
200 147.8 262.1 159.4 53.1 136.9 46.4 53.3 133.9 51.9 300 30.1 100.8 29.3 57.4 49.4 51.4 33.2 45.5 32.7 450 31.1 35.3 23.7 9.1 14.2 7.3 14.7 14.6 8.1 600 8.1 15.2 6.8 7.5 7.4 5.3 9.1 6.5 4.1 750 6.5 7.8 4.7 4.8 4.8 3.2 3.6 3.7 2.5 900 4.4 5.6 2.9 4.6 2.6 2.3 3.0 2.1 1.6
Median expected 95% CL upper limit on σ(gg → H)B(H →µτ) (fb)
µτe µτh µτ
mH (GeV) 0 jet 1 jet comb 0 jet 1 jet comb 0 jet 1 jet comb 200 107.5 209.8 95.6 79.7 151.6 72.5 63.7 126.1 57.4 300 49.8 108.6 45.2 31.0 54.8 27.7 25.9 48.8 23.4 450 17.5 32.8 20.4 9.4 15.3 8.0 8.2 13.6 7.7 600 10.4 17.9 8.9 6.2 8.3 4.9 5.1 7.4 4.2 750 8.0 11.1 6.1 4.3 5.4 3.1 3.6 4.7 2.7 900 6.9 8.0 4.9 3.3 4.3 2.4 2.8 3.5 2.1
Table 5. The observed and median expected 95% CL upper limits on σ(gg → H)B(H →µτ).
8.2 H → eτ results
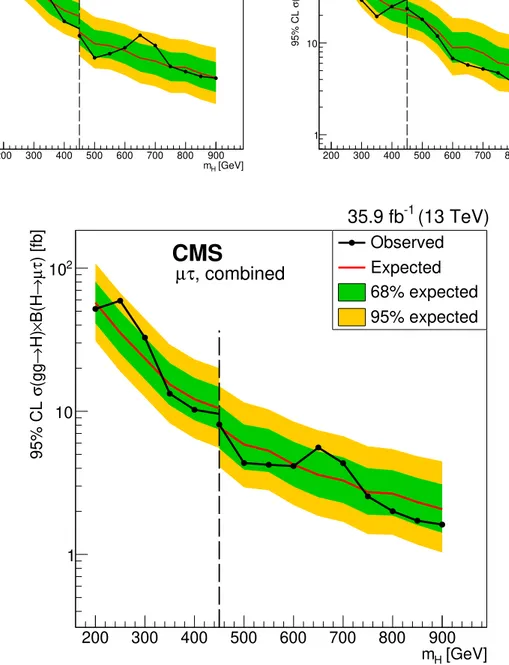
The distributions of the collinear mass Mcol compared to the signal and background con-tributions in the H → eτh and H → eτµ channels, in each category, are shown in figures 6 and 7. No excess over the background expectation is observed. The observed and median expected 95% CL upper limits on σ(gg → H)B(H → eτ) range from 94.1 (91.6) fb to 2.3 (2.3) fb, and are given for each category in table 6. The limits are also summarized graph-ically in figure8 for the individual categories, and in figure 9 for the combination of both two τ decay channels.
9 Summary
The first direct search for lepton flavour violating decays of a neutral non-standard-model Higgs boson (H) in theµτand eτ channels is presented in this paper. The analyzed data set corresponds to an integrated luminosity of 35.9 fb−1of proton-proton collision data recorded at√s = 13 TeV. The results are extracted from a fit to the collinear mass distributions. No evidence is found for lepton flavour violating decays of H in the investigated mass range. The observed (expected) upper limits at 95% confidence level on the product of production
JHEP03(2020)103
[GeV] H m 200 300 400 500 600 700 800 900 ) [fb] τ µ → B(H × H) → (gg σ 95% CL 1 10 2 10 Observed Expected 68% expected 95% expected (13 TeV) -1 35.9 fb CMS , 0 jet h τ µ [GeV] H m 200 300 400 500 600 700 800 900 ) [fb] τ µ → B(H × H) → (gg σ 95% CL 1 10 2 10 Observed Expected 68% expected 95% expected (13 TeV) -1 35.9 fb CMS , 1 jet h τ µ [GeV] H m 200 300 400 500 600 700 800 900 ) [fb] τ µ → B(H × H) → (gg σ 95% CL 1 10 2 10 Observed Expected 68% expected 95% expected (13 TeV) -1 35.9 fb CMS , 0 jet e τ µ [GeV] H m 200 300 400 500 600 700 800 900 ) [fb] τ µ → B(H × H) → (gg σ 95% CL 10 2 10 Observed Expected 68% expected 95% expected (13 TeV) -1 35.9 fb CMS , 1 jet e τ µFigure 4. The observed and median expected 95% CL upper limits on σ(gg → H)B(H →µτ), for theµτh (upper) andµτe (lower) channels, for 0-jet (left) and 1-jet (right) categories. The dashed line shows the transition between the two investigated mass ranges.
cross section with branching fraction, for H mass in the range 200–900 GeV, decaying to µτ and eτ vary from 51.9 (57.4) fb to 1.6 (2.1) fb and from 94.1 (91.6) fb to 2.3 (2.3) fb, respectively.
Acknowledgments
We congratulate our colleagues in the CERN accelerator departments for the excellent per-formance of the LHC and thank the technical and administrative staffs at CERN and at other CMS institutes for their contributions to the success of the CMS effort. In addition, we gratefully acknowledge the computing centres and personnel of the Worldwide LHC Computing Grid for delivering so effectively the computing infrastructure essential to our
JHEP03(2020)103
[GeV] H m 200 300 400 500 600 700 800 900 ) [fb] τ µ → B(H × H) → (gg σ 95% CL 1 10 2 10 Observed Expected 68% expected 95% expected (13 TeV) -1 35.9 fb CMS , combined h τ µ [GeV] H m 200 300 400 500 600 700 800 900 ) [fb] τ µ → B(H × H) → (gg σ 95% CL 1 10 2 10 Observed Expected 68% expected 95% expected (13 TeV) -1 35.9 fb CMS , combined e τ µ [GeV] H m 200 300 400 500 600 700 800 900 ) [fb] τ µ → B(H × H) → (gg σ 95% CL 1 10 2 10 Observed Expected 68% expected 95% expected(13 TeV)
-135.9 fb
CMS
, combined
τ
µ
Figure 5. The combined observed and median expected 95% CL upper limits on σ(gg → H)B(H → µτ), for µτh (upper left) and µτe (lower right) channels, and their combination µτ (lower). The
JHEP03(2020)103
[GeV] col M 0 500 1000 Obs./Exp. 0.5 1 1.5 2 Events/bin -2 10 -1 10 1 10 2 10 3 10 4 10 5 10 6 10 ObservedW/QCD Diboson ,t+jets t t µ µ ee/ → Z τ τ → Z SM Higgs Bkg. unc. τ e → LFV H (BSM) σ × 0.01 H M 200 0.169pb 300 0.066pb 450 0.023pb (13 TeV) -1 35.9 fb CMS , 0 jet h τ e [GeV] col M 0 500 1000 Obs./Exp. 0.5 1 1.5 2 Events/bin -2 10 -1 10 1 10 2 10 3 10 4 10 5 10 6 10 Observed W/QCD Diboson ,t+jets t t µ µ ee/ → Z τ τ → Z SM Higgs Bkg. unc. τ e → LFV H (BSM) σ × 0.01 H M 200 0.169pb 300 0.066pb 450 0.023pb (13 TeV) -1 35.9 fb CMS , 1 jet h τ e [GeV] col M 0 500 1000 Obs./Exp. 0.5 1 1.5 2 Events/bin -2 10 -1 10 1 10 2 10 3 10 4 10 5 10 ObservedDiboson W/QCD SM Higgs ,t+jets t t µ µ ee/ → Z Bkg. unc. τ e → LFV H (BSM) σ × 0.01 H M 200 0.169pb 300 0.066pb 450 0.023pb (13 TeV) -1 35.9 fb CMS , 0 jet µ τ e [GeV] col M 0 500 1000 Obs./Exp. 0.5 1 1.5 2 Events/bin -2 10 -1 10 1 10 2 10 3 10 4 10 5 10 ObservedDiboson W/QCD SM Higgs ,t+jets t t µ µ ee/ → Z Bkg. unc. τ e → LFV H (BSM) σ × 0.01 H M 200 0.169pb 300 0.066pb 450 0.023pb (13 TeV) -1 35.9 fb CMS , 1 jet µ τ eFigure 6. The Mcoldistribution in the signal region, for the eτh(upper) and eτµ (lower) channels
for the Higgs boson mass in the range 200–450 GeV for 0-jet (left) and 1-jet (right) categories. The uncertainty bands include both statistical and systematic uncertainties. The plotted values are number of events per bin using a variable bin size. The background is normalised to the best fit values from a binned likelihood fit, discussed in the text, to the background only hypothesis. For depicting the signals a branching fraction of 1% and BSM cross sections from ref. [79] are assumed.
analyses. Finally, we acknowledge the enduring support for the construction and operation of the LHC and the CMS detector provided by the following funding agencies: BMBWF and FWF (Austria); FNRS and FWO (Belgium); CNPq, CAPES, FAPERJ, FAPERGS, and FAPESP (Brazil); MES (Bulgaria); CERN; CAS, MoST, and NSFC (China); COL-CIENCIAS (Colombia); MSES and CSF (Croatia); RPF (Cyprus); SENESCYT (Ecuador); MoER, ERC IUT, PUT and ERDF (Estonia); Academy of Finland, MEC, and HIP (Fin-land); CEA and CNRS/IN2P3 (France); BMBF, DFG, and HGF (Germany); GSRT (Greece); NKFIA (Hungary); DAE and DST (India); IPM (Iran); SFI (Ireland); INFN
JHEP03(2020)103
[GeV] col M 0 500 1000 Obs./Exp. 0.5 1 1.5 2 Events/bin -2 10 -1 10 1 10 2 10 3 10 4 10 ObservedW/QCD Diboson ,t+jets t t µ µ ee/ → Z τ τ → Z SM Higgs Bkg. unc. τ e → LFV H (BSM) σ × 0.01 H M 450 0.023pb 600 0.010pb 750 0.005pb 900 0.003pb (13 TeV) -1 35.9 fb CMS , 0 jet h τ e [GeV] col M 0 500 1000 Obs./Exp. 0.5 1 1.5 2 Events/bin -2 10 -1 10 1 10 2 10 3 10 4 10 ObservedW/QCD Diboson ,t+jets t t µ µ ee/ → Z τ τ → Z SM Higgs Bkg. unc. τ e → LFV H (BSM) σ × 0.01 H M 450 0.023pb 600 0.010pb 750 0.005pb 900 0.003pb (13 TeV) -1 35.9 fb CMS , 1 jet h τ e [GeV] col M 0 500 1000 Obs./Exp. 0.5 1 1.5 2 Events/bin -2 10 -1 10 1 10 2 10 3 10 4 10 Observed Diboson W/QCD SM Higgs ,t+jets t t µ µ ee/ → Z Bkg. unc. τ e → LFV H (BSM) σ × 0.01 H M 450 0.023pb 600 0.010pb 750 0.005pb 900 0.003pb (13 TeV) -1 35.9 fb CMS , 0 jet µ τ e [GeV] col M 0 500 1000 Obs./Exp. 0.5 1 1.5 2 Events/bin -2 10 -1 10 1 10 2 10 3 10 4 10 Observed Diboson W/QCD SM Higgs ,t+jets t t µ µ ee/ → Z Bkg. unc. τ e → LFV H (BSM) σ × 0.01 H M 450 0.023pb 600 0.010pb 750 0.005pb 900 0.003pb (13 TeV) -1 35.9 fb CMS , 1 jet µ τ eFigure 7. The Mcoldistribution in the signal region, for the eτh(upper) and eτµ (lower) channels
for the Higgs boson mass in the range 450–900 GeV for 0-jet (left) and 1-jet (right) categories. The uncertainty bands include both statistical and systematic uncertainties. The plotted values are number of events per bin using a variable bin size. The background is normalised to the best fit values from a binned likelihood fit, discussed in the text, to the background only hypothesis. For depicting the signals a branching fraction of 1% and BSM cross sections from ref. [79] are assumed.
(Italy); MSIP and NRF (Republic of Korea); MES (Latvia); LAS (Lithuania); MOE and UM (Malaysia); BUAP, CINVESTAV, CONACYT, LNS, SEP, and UASLP-FAI (Mexico); MOS (Montenegro); MBIE (New Zealand); PAEC (Pakistan); MSHE and NSC (Poland); FCT (Portugal); JINR (Dubna); MON, RosAtom, RAS, RFBR, and NRC KI (Russia); MESTD (Serbia); SEIDI, CPAN, PCTI, and FEDER (Spain); MOSTR (Sri Lanka); Swiss Funding Agencies (Switzerland); MST (Taipei); ThEPCenter, IPST, STAR, and NSTDA (Thailand); TUBITAK and TAEK (Turkey); NASU (Ukraine); STFC (United Kingdom); DOE and NSF (U.S.A.).
JHEP03(2020)103
Observed 95% CL upper limit on σ(gg → H)B(H → eτ) (fb)
eτµ eτh eτ
mH (GeV) 0 jet 1 jet comb 0 jet 1 jet comb 0 jet 1 jet comb
200 119.2 365.3 117.8 179.4 197.8 139.6 103.2 180.1 94.1 300 85.1 208.7 94.5 56.4 56.4 43.2 50.6 65.4 46.0 450 14.0 25.1 11.7 7.6 16.9 6.8 5.9 13.2 5.2 600 17.4 13.9 11.7 9.3 9.1 6.3 8.8 6.9 5.8 750 5.1 9.5 4.1 4.7 5.6 3.3 2.9 4.5 2.3 900 7.7 8.3 5.3 3.8 5.0 2.7 3.1 4.0 2.3
Median expected 95% CL upper limit on σ(gg → H)B(H → eτ) (fb)
eτµ eτh eτ
mH (GeV) 0 jet 1 jet comb 0 jet 1 jet comb 0 jet 1 jet comb 200 158.2 366.6 142.3 135.7 238.9 120.1 102.9 200.5 91.6 300 57.9 123.0 52.3 42.9 70.3 37.5 34.5 62.0 30.2 450 20.4 32.6 17.2 10.1 18.0 8.7 9.0 15.4 7.8 600 14.7 22.1 11.9 8.6 11.6 6.8 7.5 9.9 5.9 750 8.6 10.5 6.2 4.9 6.5 3.7 4.1 5.3 3.0 900 8.5 9.0 5.7 4.0 4.7 2.6 3.3 4.0 2.3
Table 6. The observed and median expected 95% CL upper limits on σ(gg → H)B(H → eτ).
Individuals have received support from the Marie-Curie programme and the European Research Council and Horizon 2020 Grant, contract Nos. 675440, 752730, and 765710 (Eu-ropean Union); the Leventis Foundation; the A.P. Sloan Foundation; the Alexander von Humboldt Foundation; the Belgian Federal Science Policy Office; the Fonds pour la Forma-tion `a la Recherche dans l’Industrie et dans l’Agriculture (FRIA-Belgium); the Agentschap voor Innovatie door Wetenschap en Technologie (IWT-Belgium); the F.R.S.-FNRS and FWO (Belgium) under the “Excellence of Science — EOS” — be.h project n. 30820817; the Beijing Municipal Science & Technology Commission, No. Z181100004218003; the Ministry of Education, Youth and Sports (MEYS) of the Czech Republic; the Deutsche Forschungs-gemeinschaft (DFG) under Germany’s Excellence Strategy — EXC 2121 “Quantum Uni-verse” — 390833306; the Lend¨ulet (“Momentum”) Programme and the J´anos Bolyai Re-search Scholarship of the Hungarian Academy of Sciences, the New National Excellence Program ´UNKP, the NKFIA research grants 123842, 123959, 124845, 124850, 125105, 128713, 128786, and 129058 (Hungary); the Council of Science and Industrial Research, India; the HOMING PLUS programme of the Foundation for Polish Science, cofinanced from European Union, Regional Development Fund, the Mobility Plus programme of the Ministry of Science and Higher Education, the National Science Center (Poland), contracts
JHEP03(2020)103
[GeV] H m 200 300 400 500 600 700 800 900 ) [fb] τ µ → B(H × H) → (gg σ 95% CL 1 10 2 10 Observed Expected 68% expected 95% expected (13 TeV) -1 35.9 fb CMS , 0 jet h τ e [GeV] H m 200 300 400 500 600 700 800 900 ) [fb] τ µ → B(H × H) → (gg σ 95% CL 1 10 2 10 Observed Expected 68% expected 95% expected (13 TeV) -1 35.9 fb CMS , 1 jet h τ e [GeV] H m 200 300 400 500 600 700 800 900 ) [fb] τ µ → B(H × H) → (gg σ 95% CL 10 2 10 Observed Expected 68% expected 95% expected (13 TeV) -1 35.9 fb CMS , 0 jet µ τ e [GeV] H m 200 300 400 500 600 700 800 900 ) [fb] τ µ → B(H × H) → (gg σ 95% CL 10 2 10 3 10 Observed Expected 68% expected 95% expected (13 TeV) -1 35.9 fb CMS , 1 jet µ τ eFigure 8. The observed and median expected 95% CL upper limits on σ(gg → H)B(H → eτ), for the eτh (upper) and eτµ (lower) channels, for 0-jet (left) and 1-jet (right) categories. The dashed line shows the transition between the two investigated mass ranges.
Harmonia 2014/14/M/ST2/00428, Opus 2014/13/B/ST2/02543, 2014/15/B/ST2/03998, and 2015/19/B/ST2/02861, Sonata-bis 2012/07/E/ST2/01406; the National Priorities Re-search Program by Qatar National ReRe-search Fund; the Ministry of Science and Education, grant no. 3.2989.2017 (Russia); the Programa Estatal de Fomento de la Investigaci´on Cient´ıfica y T´ecnica de Excelencia Mar´ıa de Maeztu, grant MDM-2015-0509 and the Pro-grama Severo Ochoa del Principado de Asturias; the Thalis and Aristeia programmes cofinanced by EU-ESF and the Greek NSRF; the Rachadapisek Sompot Fund for Post-doctoral Fellowship, Chulalongkorn University and the Chulalongkorn Academic into Its 2nd Century Project Advancement Project (Thailand); the Nvidia Corporation; the Welch Foundation, contract C-1845; and the Weston Havens Foundation (U.S.A.).
JHEP03(2020)103
[GeV] H m 200 300 400 500 600 700 800 900 ) [fb] τ µ → B(H × H) → (gg σ 95% CL 1 10 2 10 Observed Expected 68% expected 95% expected (13 TeV) -1 35.9 fb CMS , combined h τ e [GeV] H m 200 300 400 500 600 700 800 900 ) [fb] τ µ → B(H × H) → (gg σ 95% CL 1 10 2 10 Observed Expected 68% expected 95% expected (13 TeV) -1 35.9 fb CMS , combined µ τ e [GeV] H m 200 300 400 500 600 700 800 900 ) [fb] τ µ → B(H × H) → (gg σ 95% CL 1 10 2 10 Observed Expected 68% expected 95% expected(13 TeV)
-135.9 fb
CMS
, combined
τ
e
Figure 9. The combined observed and median expected 95% CL upper limits on σ(gg → H)B(H → eτ), for eτh (upper left) and eτµ (upper right) channels, and their combination eτ (lower). The dashed line shows the transition between the two investigated mass ranges.
JHEP03(2020)103
Open Access. This article is distributed under the terms of the Creative Commons Attribution License (CC-BY 4.0), which permits any use, distribution and reproduction in any medium, provided the original author(s) and source are credited.
References
[1] ATLAS collaboration, Observation of a new particle in the search for the Standard Model Higgs boson with the ATLAS detector at the LHC,Phys. Lett. B 716 (2012) 1
[arXiv:1207.7214] [INSPIRE].
[2] CMS collaboration, Observation of a new boson at a mass of 125 GeV with the CMS experiment at the LHC,Phys. Lett. B 716 (2012) 30[arXiv:1207.7235] [INSPIRE].
[3] CMS collaboration, Observation of a new boson with mass near 125 GeV in pp collisions at√ s = 7 and 8 TeV, JHEP 06 (2013) 081[arXiv:1303.4571] [INSPIRE].
[4] F. Englert and R. Brout, Broken symmetry and the mass of gauge vector mesons,Phys. Rev. Lett. 13 (1964) 321[INSPIRE].
[5] P.W. Higgs, Broken symmetries, massless particles and gauge fields,Phys. Lett. 12 (1964) 132[INSPIRE].
[6] P.W. Higgs, Broken symmetries and the masses of gauge bosons,Phys. Rev. Lett. 13 (1964) 508[INSPIRE].
[7] G.S. Guralnik, C.R. Hagen and T.W.B. Kibble, Global conservation laws and massless particles,Phys. Rev. Lett. 13 (1964) 585[INSPIRE].
[8] P.W. Higgs, Spontaneous symmetry breakdown without massless bosons,Phys. Rev. 145 (1966) 1156[INSPIRE].
[9] T.W.B. Kibble, Symmetry breaking in non-Abelian gauge theories,Phys. Rev. 155 (1967) 1554[INSPIRE].
[10] ATLAS and CMS collaborations, Measurements of the Higgs boson production and decay rates and constraints on its couplings from a combined ATLAS and CMS analysis of the LHC pp collision data at√s = 7 and 8 TeV, JHEP 08 (2016) 045[arXiv:1606.02266] [INSPIRE].
[11] CMS collaboration, Combined measurements of Higgs boson couplings in proton-proton collisions at √s = 13 TeV,Eur. Phys. J. C 79 (2019) 421[arXiv:1809.10733] [INSPIRE].
[12] M. Buschmann, J. Kopp, J. Liu and X.-P. Wang, New signatures of flavor violating Higgs couplings,JHEP 06 (2016) 149[arXiv:1601.02616] [INSPIRE].
[13] J.D. Bjorken and S. Weinberg, A mechanism for nonconservation of muon number,Phys. Rev. Lett. 38 (1977) 622[INSPIRE].
[14] J.L. Diaz-Cruz and J.J. Toscano, Lepton flavor violating decays of Higgs bosons beyond the Standard Model,Phys. Rev. D 62 (2000) 116005[hep-ph/9910233] [INSPIRE].
[15] T. Han and D. Marfatia, h → µτ at hadron colliders,Phys. Rev. Lett. 86 (2001) 1442 [hep-ph/0008141] [INSPIRE].
[16] E. Arganda, A.M. Curiel, M.J. Herrero and D. Temes, Lepton flavor violating Higgs boson decays from massive seesaw neutrinos,Phys. Rev. D 71 (2005) 035011[hep-ph/0407302] [INSPIRE].
JHEP03(2020)103
[17] A. Arhrib, Y. Cheng and O.C.W. Kong, Comprehensive analysis on lepton flavor violatingHiggs boson to µ∓τ± decay in supersymmetry without R parity,Phys. Rev. D 87 (2013) 015025[arXiv:1210.8241] [INSPIRE].
[18] M. Arana-Catania, E. Arganda and M.J. Herrero, Non-decoupling SUSY in LFV Higgs decays: a window to new physics at the LHC,JHEP 09 (2013) 160[Erratum ibid. 10 (2015) 192] [arXiv:1304.3371] [INSPIRE].
[19] E. Arganda, M.J. Herrero, R. Morales and A. Szynkman, Analysis of the h, H, A → τ µ decays induced from SUSY loops within the mass insertion approximation,JHEP 03 (2016) 055[arXiv:1510.04685] [INSPIRE].
[20] E. Arganda, M.J. Herrero, X. Marcano and C. Weiland, Enhancement of the lepton flavor violating Higgs boson decay rates from SUSY loops in the inverse seesaw model,Phys. Rev. D 93 (2016) 055010[arXiv:1508.04623] [INSPIRE].
[21] K. Agashe and R. Contino, Composite Higgs-mediated FCNC, Phys. Rev. D 80 (2009) 075016[arXiv:0906.1542] [INSPIRE].
[22] A. Azatov, M. Toharia and L. Zhu, Higgs mediated FCNC’s in warped extra dimensions, Phys. Rev. D 80 (2009) 035016[arXiv:0906.1990] [INSPIRE].
[23] H. Ishimori, T. Kobayashi, H. Ohki, Y. Shimizu, H. Okada and M. Tanimoto, Non-Abelian discrete symmetries in particle physics,Prog. Theor. Phys. Suppl. 183 (2010) 1
[arXiv:1003.3552] [INSPIRE].
[24] G. Perez and L. Randall, Natural neutrino masses and mixings from warped geometry,JHEP 01 (2009) 077[arXiv:0805.4652] [INSPIRE].
[25] S. Casagrande, F. Goertz, U. Haisch, M. Neubert and T. Pfoh, Flavor physics in the Randall-Sundrum model: I. Theoretical setup and electroweak precision tests,JHEP 10 (2008) 094[arXiv:0807.4937] [INSPIRE].
[26] A.J. Buras, B. Duling and S. Gori, The impact of Kaluza-Klein fermions on Standard Model fermion couplings in a RS model with custodial protection,JHEP 09 (2009) 076
[arXiv:0905.2318] [INSPIRE].
[27] M. Blanke, A.J. Buras, B. Duling, S. Gori and A. Weiler, ∆F = 2 observables and fine-tuning in a warped extra dimension with custodial protection,JHEP 03 (2009) 001 [arXiv:0809.1073] [INSPIRE].
[28] G.F. Giudice and O. Lebedev, Higgs-dependent Yukawa couplings,Phys. Lett. B 665 (2008) 79[arXiv:0804.1753] [INSPIRE].
[29] J.A. Aguilar-Saavedra, A minimal set of top-Higgs anomalous couplings, Nucl. Phys. B 821 (2009) 215[arXiv:0904.2387] [INSPIRE].
[30] M.E. Albrecht, M. Blanke, A.J. Buras, B. Duling and K. Gemmler, Electroweak and flavour structure of a warped extra dimension with custodial protection,JHEP 09 (2009) 064 [arXiv:0903.2415] [INSPIRE].
[31] A. Goudelis, O. Lebedev and J.-H. Park, Higgs-induced lepton flavor violation,Phys. Lett. B 707 (2012) 369[arXiv:1111.1715] [INSPIRE].
[32] D. McKeen, M. Pospelov and A. Ritz, Modified Higgs branching ratios versus CP and lepton flavor violation,Phys. Rev. D 86 (2012) 113004[arXiv:1208.4597] [INSPIRE].
JHEP03(2020)103
[33] A. Pilaftsis, Lepton flavor nonconservation in H0 decays,Phys. Lett. B 285 (1992) 68[INSPIRE].
[34] J.G. K¨orner, A. Pilaftsis and K. Schilcher, Leptonic CP asymmetries in flavor changing H0 decays,Phys. Rev. D 47 (1993) 1080[hep-ph/9301289] [INSPIRE].
[35] E. Arganda, M.J. Herrero, X. Marcano and C. Weiland, Imprints of massive inverse seesaw model neutrinos in lepton flavor violating Higgs boson decays,Phys. Rev. D 91 (2015) 015001[arXiv:1405.4300] [INSPIRE].
[36] M. Sher and K. Thrasher, Flavor changing leptonic decays of heavy Higgs bosons,Phys. Rev. D 93 (2016) 055021[arXiv:1601.03973] [INSPIRE].
[37] E. Arganda, X. Marcano, N.I. Mileo, R.A. Morales and A. Szynkman, Model-independent search strategy for the lepton-flavor-violating heavy Higgs boson decay to τ µ at the LHC,Eur. Phys. J. C 79 (2019) 738[arXiv:1906.08282] [INSPIRE].
[38] CMS collaboration, Search for lepton flavour violating decays of the Higgs boson to µτ and eτ in proton-proton collisions at√s = 13 TeV,JHEP 06 (2018) 001[arXiv:1712.07173] [INSPIRE].
[39] CMS collaboration, Search for lepton-flavour-violating decays of the Higgs boson, Phys. Lett. B 749 (2015) 337[arXiv:1502.07400] [INSPIRE].
[40] CMS collaboration, Search for lepton flavour violating decays of the Higgs boson to eτ and eµ in proton-proton collisions at√s = 8 TeV,Phys. Lett. B 763 (2016) 472
[arXiv:1607.03561] [INSPIRE].
[41] ATLAS collaboration, Search for lepton-flavour-violating decays of the Higgs and Z bosons with the ATLAS detector,Eur. Phys. J. C 77 (2017) 70[arXiv:1604.07730] [INSPIRE].
[42] ATLAS collaboration, Search for lepton-flavour-violating H → µτ decays of the Higgs boson with the ATLAS detector,JHEP 11 (2015) 211[arXiv:1508.03372] [INSPIRE].
[43] CMS collaboration, Evidence for the direct decay of the 125 GeV Higgs boson to fermions, Nature Phys. 10 (2014) 557[arXiv:1401.6527] [INSPIRE].
[44] CMS collaboration, Evidence for the 125 GeV Higgs boson decaying to a pair of τ leptons, JHEP 05 (2014) 104[arXiv:1401.5041] [INSPIRE].
[45] CMS collaboration, Observation of the Higgs boson decay to a pair of τ leptons with the CMS detector,Phys. Lett. B 779 (2018) 283[arXiv:1708.00373] [INSPIRE].
[46] CMS collaboration, Search for neutral MSSM Higgs bosons decaying to a pair of tau leptons in pp collisions,JHEP 10 (2014) 160[arXiv:1408.3316] [INSPIRE].
[47] ATLAS collaboration, Evidence for the Higgs-boson Yukawa coupling to tau leptons with the ATLAS detector,JHEP 04 (2015) 117[arXiv:1501.04943] [INSPIRE].
[48] CMS collaboration, The CMS experiment at the CERN LHC,2008 JINST 3 S08004 [INSPIRE].
[49] CMS collaboration, The CMS trigger system,2017 JINST 12 P01020[arXiv:1609.02366] [INSPIRE].
[50] CMS collaboration, CMS luminosity measurements for the 2016 data taking period, CMS-PAS-LUM-17-001, CERN, Geneva, Switzerland (2017).
[51] P. Nason, A new method for combining NLO QCD with shower Monte Carlo algorithms, JHEP 11 (2004) 040[hep-ph/0409146] [INSPIRE].
![Table 4. Theoretical uncertainties from [ 79 ] are applied to the Higgs boson production cross sections for the different masses](https://thumb-eu.123doks.com/thumbv2/9libnet/3906005.44527/14.892.181.712.124.314/table-theoretical-uncertainties-applied-higgs-production-sections-different.webp)