A portable microfluidic platform for rapid determination of microbial
load and somatic cell count in milk
Gamze Düven1,2&Barbaros Çetin3 &Hüseyin Kurtuldu4&Gülten Tiryaki Gündüz1&Şebnem Tavman1
&Duygu Kışla1 Published online: 14 June 2019
# Springer Science+Business Media, LLC, part of Springer Nature 2019 Abstract
Microfluidics systems that have been emerged in the last 20 years and used for processing the fluid in a microchannel structure at microliter levels are alternative to the conventional methods. The objective of the study is to develop a microfluidic platform for determination of the microbial load and the number of somatic cells in milk. For this purpose, a polydimethylsiloxane (PDMS) chip with a channel size of 300μm × 60 μm was produced. Cells/bacteria labeled with fluorescent stain in milk were counted with the proposed microfluidic platform and the results were compared with the reference cell concentration/the bacterial counts by conventional method. It was found that our platform could count somatic and bacterial cells with an accuracy above 80% in 20 min run for each analysis. The portable overall platform has an overall dimension of 25x25x25 cm and weighs approximately 9 kg.
Keywords Microfluidics . Quality of milk . Somatic cell count . Bacteria count
1 Introduction
Microfluidic platforms can serve as a powerful tool for detec-tion and identificadetec-tion of bio-particles from a sample. Especially, when the bio-particle is pathogenic, rapid detec-tion is utmost important for public health. Many microfluidic platforms have been proposed for bacterial detection in clini-cal samples such as blood and urine. Wu et al. (2009) demon-strated a microfluidic device to separate bacteria (E.coli) from human red blood cells at high cell concentrations (above 108 cells/mL) using a sample flow rate up to 18μL/min. Since the separation was based on hydrodynamic effects, it is mainly based on size, and cannot differentiate viable and non-viable
bacteria. Golden et al. (2013) and Wen et al. (2014) proposed microfluidic platforms for identification of multiple pathogen-ic bacteria responsible for urinary tract infection with a coin-cidence rate above 90% as compared to the conventional methods. Metzger et al. (2014) suggested automated dark field microscopy to simultaneously identify and quantify immobilized live pathogen bacteria directly from clinical samples within less than 4 h including sample preparation and data acquisition. Recently, Yasaki et al. (2018) combined ionic current sensing and fluorescence detection in a microfluidic device to discriminate bacteria. The device was capable of identifying not only the internal structure of the bacteria such as Gram positive or negative but also measuring the size of individual bacteria at the same time. Very recently, two microfluidic platforms have been proposed for isolation of bacteria from blood cells at high cell concentrations employing acoustophoresis in a silicon (Ohlsson et al.2018) and plastic microfluidic chips (Dow et al.2018) at a sample flow rate of 50-400 μL/min which leads to high enough throughput for many clinical applications (Cetin et al.2014). However, both platforms rely on bulky hardware for flow control and acoustic actuation, and lack of a rapid detection systems.
Detection and identification of possible foodborne patho-gens also play a vital role in the control of food quality. Many microfluidic systems have also been proposed to be utilized in food industry as well. Several platforms presented for * Barbaros Çetin
[email protected]; [email protected]
1 Department of Food Engineering, Ege University,
35100 Izmir, Turkey
2
Department of Food Engineering, Izmir Institute of Technology, 35430 Izmir, Turkey
3
Microfluidics & Lab-on-a-chip Research Group, Mechanical Engineering Department, I.D. Bilkent University,
06800 Ankara, Turkey
4 Faculty of Engineering, Department of Biomedical Engineering,
detection of mycotoxins (Guo et al. 2015), Listeria monocytogenes with Polymerase Chain Reaction (PCR) (Delibato et al.2009), E.coli O157:H7 with immunomagnetic separation followed by real time PCR (Fu et al.2005), food or waterborne pathogenic rotavirus with reverse transcription-PCR systems (Li et al.2011) as well as electrochemical de-tection of foodborne bacteria based on sensing of bacterial RNA without any nucleic acid amplification (Pöhlmann et al.2009). Although much faster analysis time compared to the conventional techniques (such as plating) was achieved with these microfluidic platforms, the fabrication of the chip and/or operation requires some biochemical reagents which would increase the cost of the analysis and/or disposable set, and still requires a total analyses time of couple of hours.
Besides detection, enumeration of bio-particles is also es-sential for many biological and chemical applications. More specifically, it is a prominent issue for milk industry (e.g. total viable count or somatic cell count). Milk has a complex matrix composed of fat globules in colloidal form and water with dissolved carbohydrates and protein complexes. It has neutral pH, high nutrient content and water activity value, which makes it suitable growth media for microorganisms (Mortari and Lorenzelli2014). Somatic cell counts and total viable counts in milk are generally used as an index of udder health in dairy cows. However, positive relationship between somat-ic cell counts, total viable counts and mastitis in dairy is a questionable issue. When the number of bacteria in milk in-creases, the number of somatic cells also increases due to the infection, especially mastitis (Zeng et al. 1999). Currently, detection and enumeration of microbial contaminants rely ex-tremely on conventional methods such as plating, direct mi-croscopy, redox staining etc. Generally, those are labor-intensive procedures that require days for analysis and skilled personnel to interpret the results. Flow cytometry was also applied for analysis for relatively rapid analyses of bacterial load in milk (Gunasekera et al.2000,2003), however the necessity for skilled personnel is still on the table together with relatively expensive hardware and disposables. Therefore, fast, sensitive, cost effective, reliable, repeatable method or technology for the microbial and somatic cell counts in dairy industry is desirable and would be very beneficial. In addition, a platform with portability would also realize on-site analysis. Moon et al. (2007) investigated the use of a microfluidic system for counting somatic cells in milk. In their study, after stabilization of somatic cells with potassium dichromate, cells were stained with fluorescent dye and counted with microfluidic chip-based system with a rate of 1360–7920 so-matic cells per minute. Yamaguchi et al. (2006) and Ikeda et al. (2009) were used commercially available on-chip flow cytometry device (Agilent 2100 Bioanalyzer) to detect la-belled Pseudomonas and L.monocytogenes cells with fluores-cence in situ hybridization probe (FISH) in milk and they reported that the total analysis time (including sample
preparation and chip analysis) was around 4 h with a detection limit of 1 × 10⁶cells/mL. Fernandes et al. (2014) were devel-oped on chip flow cytometry device to identify and quantify magnetically labelled S. agalactiae in milk. They found that milk constituents (fat globules, casein etc.) inhibit bonding of magnetic nanoparticles to the bacteria leading to lower signal amplitudes. Moreover, strong magnetic product leads to ag-glomeration of cells in microchannel. Although very promis-ing and satisfactory results have been reported for water, on the milk side (which has a relatively more complex matrix) microfluidics platforms with relative fast analyses time is lim-ited. Garcia-Cordero et al. (2010) developed a low-cost, por-table microfluidic system to count somatic cells and measure the fat content of milk, simultaneously. Accurate somatic cell count was achieved over the range of 5 × 10⁴–3 × 10⁶cells/ mL with a total analysis time of 15 min. Despite the fact that microfluidic systems are proposed in the literature for the de-termination of microbial load and somatic cell count, most of proposed systems require long analysis time to process, skilled personnel, and relative expensive hardware and dispos-ables. Moreover, most of them focus on either somatic cell or bacterial cell counts.
Microfluidic systems with flow control units need to be disposal to preclude any source of biological and chemical contamination and ensure clean operation. To overcome afore-mentioned issues regarding determination of microbial load and somatic cell counts in milk, we present a microfluidic platform consists of disposal microfluidic chip and in-house build fluorescence detection system in this study. Microfluidic chip delivers the sample into the optical detection area, and the system does not require any means of controlled pumping; therefore, the platform is free of hardware for flow control. For the counting process, two alternative counting algorithms have been developed both of which do not rely on precise flow rate control. For most of the bio-particle concentrations, the counting is achieved with an accuracy above 80%. Somatic cell and bacteria counts are performed within 20 min of processing time (15 min for staining, 5 min of on-chip analysis) on a portable platform. The overall platform has an overall dimension of 25 cm × 25 cm × 25 cm, weights ap-proximately 9 kg, and can be transferred to the site for on-site analysis. The cost of the overall platform is estimated as $2500, and the cost of the counting for one single set is esti-mated as couple dollars.
2 Materials and methods
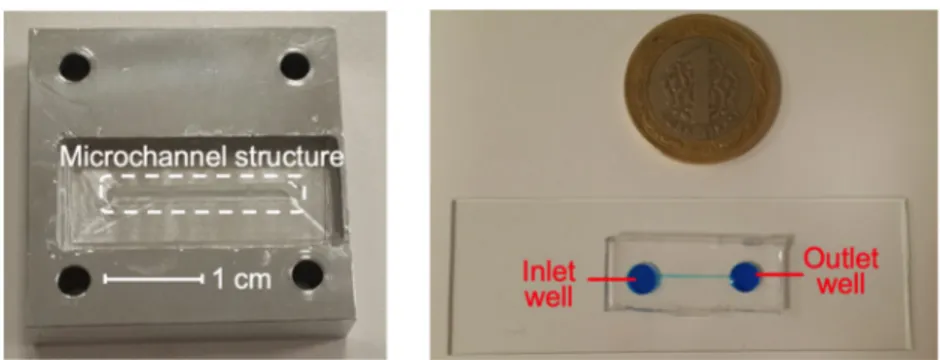
Bacterial and somatic cell counts were carried out with a microfluidic chip (Fig.1). The microfluidic chip consists of a rectangular microchannel with a cross-section of 300μm × 60μm (WxH). The size of the microchannel was decided to maximize the performance of the optical hardware. The mold
of the microfluidic device fabricated out of aluminum. Fabrication of the mold was performed by a 3-axis micro-machining center (PROINO Z3X Micro Maker, Mikro Protez Ltd.Şti., Ankara, Turkey) with an accuracy of 5 μm. The details about the mold machining can be found elsewhere (Zeinali et al.2015) .
2.1 Optical hardware
The optical system design shown in Fig.2was developed to perform bio-particle counting experiments. In this design, all optics was constructed on a single plane which was placed onto a motorized z-axes translation stage to adjust the focal distance between the objective and sample. Software devel-oped in-house was employed to control image acquisition and stage movement. Objective lenses with 40X and 100X mag-nification were employed for the somatic and bacterial cell counts, respectively. The beam produced by a laser source (532 nm) was directed to the sample with an adjustable silver mirror through a beam expander, and the beam reflected from the sample was imaged by a monochrome CCD camera (Imaging Source DMK 31BU03) after passing through a Barlow lens that adjusted the magnification for visualization of the entire channel on the camera sensor. The laser beam was not spatially filtered to provide high-intensity excitation. Both the transmitted and reflected beam were filtered with a fluo-rescent cube designed for PYMG staining. Measurements of cells stained with SYTO 9 were performed by replacing the
laser light source with an LED light source (FWHM 30 nm at 470 nm) and with a suitable filter cube. In addition, a white LED was used to center the channels in the camera image before fluorescence imaging. Prior to each measurement when the channels were filled with stained cells and there was no flow, the z-stage was moved at 5μm intervals through a depth of 60μm to capture the images to find the imaging plane with the maximum density.
2.2 Chip fabrication
Chip was fabricated by PDMS (Polydimethylsiloxane) mold-ing usmold-ing aluminum molds and Sylgard® 184 Silicone Elastomer Kit (Sigma, USA). PDMS and curing agents were mixed in the ratio of 10:1 and poured into the mold to produce the chips. Vacuum was applied to the mold for 15–20 min to remove air bubbles in the mixture. Then, the mold was placed in an oven at 80 °C for 40–45 min to cure PDMS. The PDMS piece was carefully peeled off from the mold. The inlet and outlet wells were punched out. The PDMS piece was bonded onto a clean slide following a 50-s plasma treatment (Zeinali et al.2015; Cetin et al.2016).
2.3 Milk samples and test cultures
Certified reference milk samples (RMS, Associazione Italiana Allevatori Laboratorio Standard Latte, Italy) were used in the experiments to determine somatic cell count. RMS were Fig. 1 Photograph of the mold
(right) and the microfluidic chip (left) with a rectangular microchannel with a size of
300μm × 60 μm
Fig. 2 Microfluidic platform (left) and optical hardware (right)
stored in the refrigerator until their expiration dates. Four dif-ferent samples at concentration of 122,000 cells/mL, 250,000 cells/mL, 535,000 cells/mL and 748,000 cells/mL were prepared.
Skimmed UHT milk (SUM;İçim, Ak Food Industry and Trade Inc.,İstanbul, Turkey) was used for the experiments to determine bacterial counts. Milk was obtained from a local market inİzmir, Turkey and sterilized at 121 °C for 15 min before the experiments. S. aureus ATCC 6538P and E. coli ATCC 8739 were employed as the test cultures which were obtained from Microbiology Laboratory at Ege University, Department of Food Engineering.
2.4 Somatic cell count in RMS
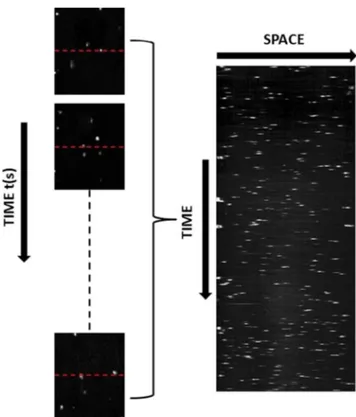
Somatic cells in RMS were stained by the addition of 6μL Pyronin-Y Methyl Green (PYMG, Abcam, USA) to each 1.0 mL RMS and waited for 6 min at room temperature in the dark according to Abcam PYMG staining procedure (Abcam, USA). Then, the somatic cells were counted by using the microfluidic platform. Stained RMS was load into the inlet reservoir with a micropipette. Following the filling of the channel with the stained RMS, the cells in the channel were observed and counted under fluorescent light with the optical system. 1-dimensional (1D) and 2-dimensional (2D) imaging techniques were implemented for enumeration of the cells by a CCD camera. The 1D method is fast and can be performed in real-time but requires knowledge of the flow rate. The 2D approach requires post-processing of the images but does not need data on flow rate since the measurements are carried out in a known volume. The 1D imaging technique minimizes cell count errors that may arise from non-homogeneous illu-mination within the chip. A laser and LED were used as ex-citation sources in the compact fluorescence imaging system because of their size and power. However, spatial variations in the beam causes non-uniform illumination, thus requiring spa-tial filtering of the source. The filtering was not incorporated into the system as it reduces the intensity below the acceptable level for measurement. For this reason, 1D measurements were only performed in the middle of the channel. As delin-eated in Fig.3, a horizontal line was selected at the vertical mid-point of each time-recorded image. A space-time image was then generated by stacking the fluorescence intensities along these lines. The space-time image was binarized and the individual connected components identified as cells were counted as a function of time. In this technique, the flow rate needs to be known to determine the number of cells per vol-ume. The flow speed was calculated by selecting a second horizontal line close to the first one and finding the maximum correlation time between the signals on these selected lines. The average speed over the measurement period was estimat-ed as 80μm/s. Then, the number of cells counted per second along with the flow rate was used to calculate the number of
cells per mL. Figure4shows the cell concentration as a func-tion of time in a cross-secfunc-tional area of 0.018 mm2(channel width x depth) for an RMS reference sample. Since there were a few cells within the imaging volume, it was likely that no cells were located on the line as the measurement started. For a similar reason, the number of cells detected within a few sec-onds fluctuated and produced noise in estimating the concen-tration. Acquisition over a relatively long time (e.g. 90 s) was enough to obtain an accurate estimate of the number of cells counted per second. The measured concentration of the cells started to converge to a constant value of 247.50 K cells/mL (which was estimated by a linear fit) after 90-s of data Fig. 3 Space-time image generated by cell count profiles with 1D imaging technique 0 20 40 60 80 100 120 Time(s) 0 50 100 150 200 250 300 350 # o f s omatic cells(x1000/mL)
Converged value: 247.5x10³ cells/mL
Fig. 4 The number of cells per ml given as a function of time. The estimated value is 247.50 K cells/ml, and the reference value is 250 K cells/mL for the RMS sample
collection. A horizontal line is fitted for the data between 60 s and 90 s. Different RMS sample concentrations flowing at the same rate were determined by a similar approach. To check the repeatability of the technique, at least five 90-s intervals were employed from data taken over a course of about 6 min at each concentration. All five 90-s intervals generated a result within ±%4 of the mean value.
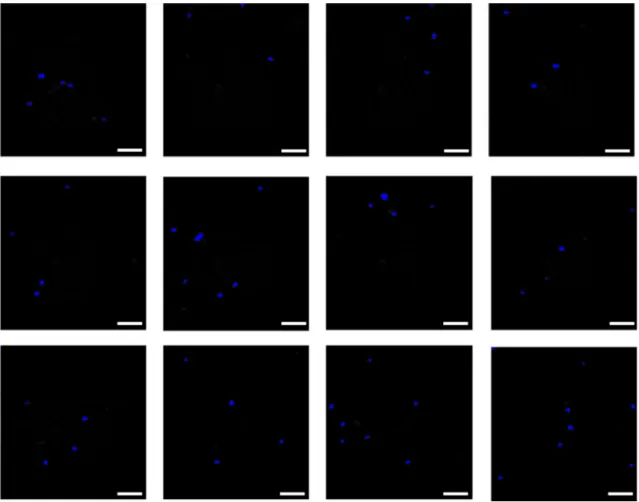
The 2D imaging technique, which is robust to spatial in-tensity variations, employs counting in a known volume (im-aging area x channel height) without any need for the flow rate. It is a slower alternative to the 1D method since it requires batch processing of images after the data collection which takes about 2–4 min depending on the cell concentration in the sample. Detection of somatic cells in a volume of 0.00594 mm3using this approach is demonstrated in Fig.5. Fluorescence images of the cells were captured at a frame rate of 16 frames/s. In order to minimize the effect of non-uniform illumination, a background image was first obtained by aver-aging the time series of images, and then it was extracted from each image in the sequence. Cells were identified by an auto-thresholding algorithm in which size-based filtering was also applied to eliminate non-cell artifacts. One-minute acquisition time was ample to obtain a statistically significant average
number of cells per volume. The mean value changed by only ±2% for the five times greater measurement period. This tech-nique is capable of measuring concentration as low as 104 stained cell/mL. One important issue is that the flowing solu-tion needs to uniform cell concentrasolu-tion, otherwise the counting result would change depending on time frame im-ages are acquired for the post-process.
2.5 Bacterial count in SUM
Bacterial cultures were maintained Plate Count Agar (PCA, Merck, Germany) slants at 4 °C. They were activated 2 times at 37 °C for 24 h in 5 mL Nutrient Broth (NB, Oxoid, UK), and then 2% of cultures were inoculated in 100 mL NB. Bacterial suspensions were divided into 10 tubes and incubat-ed at 37 °C for 12 h. Following incubation, E.coli and S.aureus cultures were centrifuged at 5000 rpm for 30 min and washed with 0.85% NaCl (Merck, Germany) two times (AOAC1984). The pellet of the last step of the centrifugation was re-suspended in 0.85% NaCl equal to the initial volume of the supernatant (E.coli and S.aureus suspensions). Conventional method was employed for quantification of the bacterial cells in the suspension. After preparing appropriate
Fig. 5 2D fluorescence images of PYMG stained somatic cells in a certain volume of RSM, captured by a monochrome CCD camera. The detected cells
dilutions from E.coli or S.aureus suspensions in 0.85% NaCl, they were plated into PCA and the plates were incubated at 37 °C for 24–48 h.
SUM samples containing E.coli and mixed cultures of E.coli and S.aureus were prepared and the numbers were de-termined by using the microfluidic platform. E.coli suspen-sions were diluted in SUM to prepare four different concen-trations (1:100, 1:1000, 1:2000 and 1:10000) of SUM samples containing E. coli. SUM samples containing mixed cultures of E. coli and S.aureus at three different concentrations (1:100 E.coli + 1:10 S.aureus, 1:1000 E.coli + 1:100 S.aureus, 1:2000 E.coli + 1:200 S.aureus) were prepared by mixing SUM samples including different concentrations of E.coli and S.aureus at the ratio of 1:1. After preparation of SUM samples containing E.coli and mixed cultures of E.coli and S.aureus, bacterial cells were stained to give florescent signal. The bacterial cultures were stained by LIVE/DEAD BacLight Bacterial Viability Kit (Invitrogen, UK). The staining protocol of the manufacturer was implemented. Accordingly, equal volumes of component-A (SYTO 9 dye, 1.67 mM / Propidium iodide, 1.67 mM) and component-B (SYTO 9 dye, 1.67 mM / Propidium iodide, 18.3 mM) were combined in a microfuge tube and mixed thoroughly. Three microliters of the dye mixture were added into 1.0 mL of the bacterial suspension and mixed. Samples were waited at room
temperature for 15 min in the dark, and then counted by the microfluidic platform (Table1).
3 Results and discussion
3.1 Somatic cell count
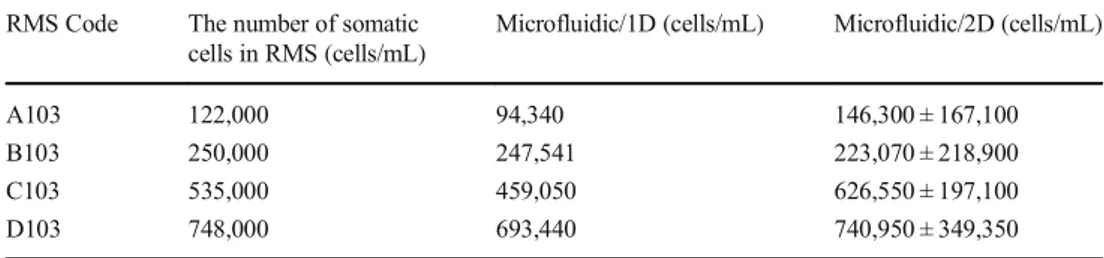
RMS containing somatic cells at four different concentrations (122,000 cells/mL, 250,000 cells/mL, 535,000 cells/mL and 748,000 cells/mL) were employed to determine the reproduc-ibility and accuracy of the platform. Both 1D and 2D imaging techniques were implemented. The results obtained by 1D imaging technique presented in Fig.6-(a). According to the results obtained by 1D imaging technique, 79,710 cells/mL, 241,260 cells/mL, 459,050 cells/mL and 693,440 cells/mL were counted as an approximate value in the RMS samples as summarized in Table2. Even if 1D imaging was employed for different 90-s intervals as mentioned in Section 2.4, only one set of measurement data is presented in Fig.6(a)for each concentration to resemble the real operation of the device. It was found that our platform could count somatic cells in RMS with an accuracy above 80% by 1D imaging technique. The error bars are not presented on Fig.6-(a) since the method has only one experiment for each data. Comparison of the Table 1 The number of somatic
cells in RMS and the counting results by the microfluidic platform
RMS Code The number of somatic
cells in RMS (cells/mL)
Microfluidic/1D (cells/mL) Microfluidic/2D (cells/mL)
A103 122,000 94,340 146,300 ± 167,100 B103 250,000 247,541 223,070 ± 218,900 C103 535,000 459,050 626,550 ± 197,100 D103 748,000 693,440 740,950 ± 349,350
(a)
(b)
100 200 300 400 500 600 700 800 # of somatic cells in RMS (x1000/mL) 0 100 200 300 400 500 600 700 800 Measured # o f soma tic cells in RM S (x 10 00/ mL) 100 200 300 400 500 600 700 800 # of somatic cells in RMS (x1000/mL) 0 200 400 600 800 1000 1200 Measur e d#o f s o m a ti cc e lls in RM S (x 1 0 00 /m L )Fig. 6 Comparison of the counting results: (a) 1D imaging technique and (b) 2D imaging technique. The dashed line on the graph is not a linear trend
counting results in RMS by 2D imaging technique was shown in Fig.6-(b). At each somatic cell concentration, 1000 fluo-rescence images were captured at a known microchannel vol-ume. The somatic cells were detected and counted in each fluorescence image. Standard deviation was obtained by anal-ysis of 1000 images at each concentration value. The somatic cell count in RMS was determined with a minimum accuracy of 80%. The figure also shows the standard deviation value calculated for each data. The standard error is much lower because it is calculated over 1000 images (data not shown). These calculations were obtained from 1000 images for a measurement duration of one minute. If the measurement of time and number of captured image increase, the standard deviation will decrease. However, it will not result in a signif-icant change in the average value.
3.2 Bacterial count
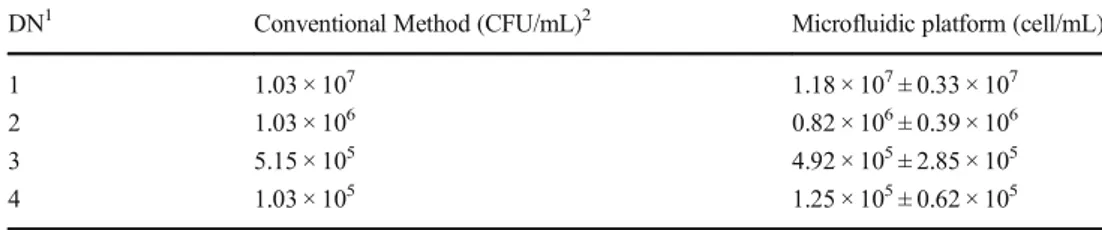
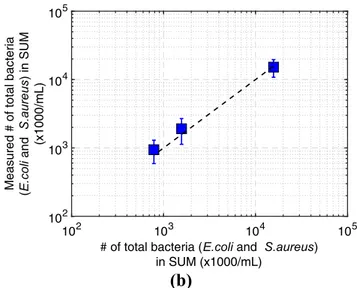
SUM milk samples inoculated with E. coli at four different concentrations and the combination of E.coli and S.aureus at three concentrations were counted using both plate count method and the microfluidic platform to evaluate reproduc-ibility and accuracy of the proposed method. The bacterial count results by the conventional method and dilution-related estimated values of the samples are given in Table2 and Table3. Four different concentrations (1.03 × 10⁷CFU/ mL, 1.03 × 10⁶CFU/mL, 5.15 × 10⁵CFU/mL, 1.03 × 10⁵
CFU/mL) were used for counting SUM samples including only E.coli. The results are presented in Fig.7-(a). E.coli in SUM was counted by the microfluidic platform with an accu-racy above 80% as compared to the conventional method. Following the E.coli count, total bacteria count experiments were carried out. Three different concentrations (1.57 × 10⁷ CFU/mL, 1.57 × 10⁶CFU/mL and 7.85 × 10⁵CFU/mL) were used in the mixture of E.coli and S.aureus in SUM samples. The results are shown in Fig.7-(b). SUM including different concentrations of E.coli and S.aureus were counted by our platform with an accuracy above 80% as compared to the conventional method. The results are also summarized in Table2and Table3.
Satisfactory cell/bacteria counting results (from 105to 106 cells/mL concentrations) were obtained with an accuracy above 80% by the microfluidic platform as compared to the reference cell concentration. However, the same successful counting was not obtained under 105cells/ml concentrations since the number of particles passing through the measure-ment window seen with the optical system decreases to 1–2 particles/min which leads to significant statistical errors. When the performance of the microfluidic platform was pared to existing microfluidic devices, it was shown that com-mercial microfluidic device (Agilent 2100 Bioanalyzer) could count 102cells/mL (Ikeda et al.2009). Flow cytometry sys-tems can detect as small as 103cells/mL. However, these systems are not suitable for measurements of samples which has high cell concentrations (approximately above 106cells/ mL) as they achieve saturation at high cell concentrations. In addition, they are costly and require skilled personnel to op-erate. A counting chamber, particularly the hemocytometer, may be viable and simple solution for determining the number of cells per unit volume of a suspension under a microscope. However, the counting chamber requires manual counting which is time-consuming, labor-intensive and prone to human error. The present platform can analyze 15μL of milk (stained with fluorescent dye) in just 3 min, especially in counting of samples containing high concentrations of cells via very low-cost disposable set and relatively inexpensive hardware. The throughput of the system can be further improved by running the sample with a higher flow rate, however there is a certain threshold for the flow rate since faster flowing cells may Table 2 Counting results of SUM
with different concentrations of E.coli by conventional method and microfluidic platform
DN1 Conventional Method (CFU/mL)2 Microfluidic platform (cell/mL)
1 1.03 × 10⁷ 1.18 × 10⁷± 0.33 × 10⁷
2 1.03 × 10⁶ 0.82 × 10⁶± 0.39 × 10⁶
3 5.15 × 10⁵ 4.92 × 10⁵± 2.85 × 10⁵
4 1.03 × 10⁵ 1.25 × 10⁵± 0.62 × 10⁵
1
Dilution number (1: 1/100, 2: 1/1000, 3: 1/2000, 4: 1/10000 dilution)
2The values are estimated values due to dilution factor
Table 3 Counting results of SUM with different concentrations of
E. coli and S. aureus by conventional method and microfluidic platform
DN1 Numbers of S. aureus + E.coli mixed cultures
Conventional2(CFU/mL) Microfluidic platform (cell/mL)
1 1.57 × 10⁷ 1.52 × 10⁷± 0.44 × 10⁷
2 1.57 × 10⁶ 1.91 × 10⁶± 0.78 × 10⁶
3 7.85 × 10⁵ 9.43 × 10⁵± 3.53 × 10⁵
1
dilution number (1: 1/10 S. aureus + 1/100 E. coli, 2: 1/100 S. aureus + 1/1000 E. coli, 3: 1/200 S. aureus + 1/2000 E. coli)
2
values are estimated values of the sum of E. coli and S. aureus suspension
deteriorate the optical signal which would affect accuracy of the system. The current hardware can collect sufficient fluo-rescence signals at flow speeds below 150μm/s. It should also be noted that over-sampled data acquired at very low speeds may cause the measurement to converge more slowly. Albeit not very narrow, there is a flow rate range for an optimal operation of the platform.
4 Concluding remarks
Rapid and low-cost microfluidic platform for counting of both somatic cells and bacterial cells in milk was developed. Experiments revealed that the counting results are compatible with the results by the reference cell concentration/ conventional method. Our platform can handle the somatic and bacterial cells count within 20 min without any need for any skilled personnel and much faster compared to the con-ventional methods. The overall platform has an overall dimen-sion of 25x25x25 cm and weighs approximately 9 kg in this current configuration which can be claimed to be portable. However, with a better engineering the size of the chassis of the system can be further reduced for better portability. In future studies, it is planned to reduce the detection limit of the system to 1000 cells/mL during the same measurement period with lower magnification, similar numerical aperture objective lenses and higher resolution low-light cameras. The optics can also be re-designed to have two fluorescent imaging systems capable of simultaneously measuring somatic cell and bacterial count at different locations on the same microchannel. The proposed platform may be applied for on-site microbial quality control of milk during the collection
from the producer. Moreover, the technology can be potential-ly adapted for on-site real-time food quality monitoring of aqueous solutions such as water, clarified fruit juices as well as in determining the bacteria and cell concentrations for mi-crobiological and other biological applications as long as de-sired accuracy of a particular application is within the limit of our platform.
Acknowledgements Financial support from the Turkish Scientific and Technical Research Council (Grant No. 114 M597) is greatly appreciated. B.Ç. would like to acknowledge funding from the Turkish Academy of Sciences through Outstanding Young Scientist Program (TUBA-GEBIP) and Science Academy Distinguished Young Scientist Award (BAGEP).
References
AOAC, 1984, Official Method of Analysis, 14thEd., Washington D.C.,
USA: Assoc. Official Analytical Chemists
B. Cetin, M.B. Ozer, M.E. Solmaz, Microfluidic bio-particle
manipula-tion for biotechnology. Biochem. Eng. J.92, 63–82 (2014)
B. Cetin, M.B. Ozer, E. Cagatay, S. Buyukkocak, An integrated acoustic and dielectrophoretic particle manipulation in a microfluidic device for particle wash and separation fabricated by mechanical
machin-ing. Biomicrofluidics10, 014112 (2016)
E. Delibato, A. Gattuso, A. Minucci, B. Auricchio, D. De Medici, L. Toti, M. Castagnola, E. Capoluongo, M.V Gianfranceschi, PCR experion automated electrophoresis system to detect Listeria monocytogenes
in foods. J. Sep. Sci.32(21), 3817–3821 (2009)
P. Dow, K. Kotz, S. Gruszka, J. Holder, J. Fiering, Acoustic separation in plastic microfluidics for rapid detection of bacteria in blood using
engineered bacteriophage. Lab Chip18(6), 923–932 (2018)
A.C. Fernandes, C.M. Duarte, F.A. Cardoso, R. Bexiga, S. Cardoso, P.P. Freitas, Lab-on-chip cytometry based on magnetoresistive sensors
for bacteria detection in milk. Sensors14(8), 15496–15524 (2014)
(a)
(b)
101 102 103 104 105 # of E.coli in SUM (x1000/mL) 101 102 103 104 105 Mea su red #o f E.col i inS U M (x 100 0 /mL) 102 103 104 105# of total bacteria (E.coli and S.aureus) in SUM (x1000/mL) 102 103 104 105 Mea s ur ed # o f tot al b a cte ria (E.c oli an d S .aureu s ) in S UM (x 1 0 00/ mL )
Fig. 7 Comparison of the counting results of SUM including by 2D
imaging technique: (a) different concentrations of E.coli (1:100, 1:1000,
1:2000 and 1:10000) and (b) different concentrations of E.coli and
S.aureus (1:100 E.coli + 1:10 S.aureus, 1:1000 E.coli + 1:100 S.aureus,
1:2000 E.coli + 1:200 S.aureus). x-axis data is obtained by the conventional method. The dashed line on the graph is not a linear trend line, it is informational to show the precision of the counting method with the microfluidic platform and conventional method
Z. Fu, S. Rogelj, T.L. Kieft, Rapid detection of Escherichia coli O157:H7 by immunomagnetic separation and real-time PCR. Int. J. Food
Microbiol.99(1), 47–57 (2005)
J.L. Garcia-Cordero, L.M. Barrett, R. O’Kennedy, A.J. Ricco,
Microfluidic sedimentation cytometer for milk quality and bovine
mastitis monitoring. Biomed. Microdevices 12(6), 1051–1059
(2010)
J.P. Golden, J. Verbarg, P.B. Howell, L.C. Shriver-Lake, F.S. Ligler, Automated processing integrated with a microflow cytometer for pathogen detection in clinical matrices. Biosens. Bioelectron. 40(1), 10–16 (2013)
T.S. Gunasekera, P.V. Attfield, D.A. Veal, A flow cytometry method for rapid detection and enumeration of total bacteria in milk. Appl.
Environ. Microbiol.66(3), 1228–1232 (2000)
T.S. Gunasekera, D.A. Veal, P.V. Attfield, Potential for broad applications of flow cytometry and fluorescence techniques in microbiological
and somatic cell analyses of milk. Int. J. Food Microbiol.85(3),
269–279 (2003)
L. Guo, J. Feng, Z. Fang, J. Xu, X. Lu, Application of microfluidic
Blab-on-a-chip^ for the detection of mycotoxins in foods. Trends Food
Sci. Technol.46(2), 252–263 (2015)
M. Ikeda, N. Yamaguchi, M. Nasu, Rapid on-chip flow cytometric
detec-tion of listeria monocytogenes in milk. J. Health Sci.55(5), 851–885
(2009)
Y. Li, C. Zhang, D. Xing, Integrated microfluidic reverse transcription-polymerase chain reaction for rapid detection of food- or waterborne
pathogenic rotavirus. Anal. Biochem.415(2), 87–96 (2011)
S. Metzger, R.A. Frobel, W.M. Dunne, Rapid simultaneous identification and quantitation of Staphylococcus aureus and Pseudomonas aeruginosa directly from bronchoalveolar lavage specimens using
automated microscopy. Diagn. Microbiol. Infect. Dis.79(2), 160–
165 (2014)
J.S. Moon, H.C. Koo, Y.S. Joo, S.H. Jeon, D.S. Hur, C.I. Chung, H.S. Jo, Y.H. Park, Application of a new portable microscopic somatic cell counter with disposable plastic Chip for Milk analysis. J. Dairy Sci. 90(5), 2253–2259 (2007)
A. Mortari, L. Lorenzelli, Recent sensing technologies for pathogen
de-tection in milk: A review. Biosens. Bioelectron.60, 8–21 (2014)
P. Ohlsson, K. Petersson, P. Augustsson, T. Laurell, Acoustic impedance matched buffers enable separation of bacteria from blood cells at
high cell concentrations. Sci. Rep.8(1), 9156 (2018)
C. Pöhlmann, Y. Wang, M. Humenik, B. Heidenreich, M. Gareis, M. Sprinzl, Rapid, specific and sensitive electrochemical detection of
foodborne bacteria. Biosens. Bioelectron.24(9), 2766–2771 (2009)
X.X. Wen, B.L. Xu, W.X. Wang, G.T. Liang, B. Chen, Y.M. Yang, D.Y. Liu, Rapid identification of multiple bacteria on a microfluidic chip.
Chin. J. Anal. Chem.42(6), 791–798 (2014)
Z. Wu, B. Willing, J. Bjerketorp, J.K. Jansson, K. Hjort, Soft inertial microfluidics for high throughput separation of bacteria from human
blood cells. Lab Chip9(9), 1193–1199 (2009)
N. Yamaguchi, H. Ohba, M. Nasu, Simple detection of small amounts of Pseudomonas cells in milk by using a microfluidic device. Lett.
Appl. Microbiol.43(6), 631–636 (2006)
H. Yasaki, T. Yasui, T. Yanagida, N. Kaji, M. Kanai, K. Nagashima, Y. Baba, A real-time simultaneous measurement on a microfluidic de-vice for individual bacteria discrimination. Sensors Actuators B
Chem.260, 746–752 (2018)
S. Zeinali, B. Çetin, S. Oliaei, Y. Karpat, Fabrication of continuous flow microfluidics device with 3D electrode structures for high through-put DEP applications using mechanical machining. Electrophoresis,
Special Issue on Dielectrophoresis36(13), 1432–1442 (2015)
S.S. Zeng, E.N. Escobar, S.P. Hart, L. Hinckley, M. Baulthaus, G.T. Robinson, G. Jahnke, Comparative study of the effects of testing laboratory, counting method, storage and shipment on somatic cell
counts in goat milk. Small Rumin. Res.31(2), 103–107 (1999)
Publisher’s note Springer Nature remains neutral with regard to