c
⃝ T¨UB˙ITAK
doi:10.3906/elk-1203-109 h t t p : / / j o u r n a l s . t u b i t a k . g o v . t r / e l e k t r i k /
Research Article
Coherence analysis on thermal effect for power cables under different
environmental conditions
Sezai TAS¸KIN1,∗, S¸ahin Serhat S¸EKER2, ¨Ozcan KALENDERL˙I2, Murat KARAHAN3
1
Department of Electrical and Electronics Engineering, Celal Bayar University, Manisa, Turkey
2
Department of Electrical Engineering, ˙Istanbul Technical University, ˙Istanbul, Turkey
3Department of Electrical and Electronics Engineering, Dumlupınar University, Simav, K¨utahya, Turkey
Received: 24.03.2012 • Accepted: 04.07.2012 • Published Online: 20.12.2013 • Printed: 20.01.2014
Abstract: There are 2 important aspects of this research; these are the experimental study and the data analysis, which are based on coherence analysis. In this study, a low-voltage power cable is tested under 2 different environments, air and water, and the variations in temperature are measured for the conductor, the sheath parts of the cable, and the environment. The recorded test data are analyzed using such as coherence analysis. This in turn provides the means to determine the relationship among the sheath, conductor, and the environment. In conclusion, high correlated peaks in the frequency domain are used to determine the temperature effect.
Key words: Power cable, coherence analysis, current, and thermal relationship
1. Introduction
Power cables are generally used in urban distribution networks and are preferred for their aesthetics and reliable operation. In contrast, overhead lines are preferred in power transmission among the distribution networks.
Power cable systems require expensive investments; thus, they must be reliable. However, an underground power cable is exposed to electrical, thermal, and mechanical effects during its operation [1].
The simple structure of power cables turns into a complex structure when the voltage and the transmitted power levels are increased as a result of increased heat or environmental and mechanical strains. This situation requires determination of the maximum current carrying capacity of the power cables [2].
Power cables’ temperature depends on many factors, such as current flowing through the cable, cable geometry, and structural properties such as the materials used in the manufacturing of the cable, laying styles of other cables in the vicinity of the cable, thermal properties of the environment, and moisture of the surrounding soil.
There is a strong relation between the current carrying capacity and temperature distributions of power cables. Losses produced by the applied voltage to a cable and current flowing through its conductor generate heat; therefore, the current carrying capacity of a cable depends on the effective distribution of the generated heat from the cable to the surrounding environment. Insulating materials in the cables and the surrounding environment proves uniform heat distribution to be difficult due to the existence of high thermal resistances [2]. Thermal hotspots are likely to age the conductor; consequently, in order to achieve a more reliable operation,
the temperature levels of the cable components during continuous operation should be determined. Analytical, numerical, or real-time measurement techniques may be utilized in this regard.
Literature research is especially focused on analytical and numerical solutions [3–7]. Historically speaking, the first and foremost important study based on the heat transfer calculations in power cables was published in 1938, and another was published in 1957 [8,9]. Calculations in thermal analysis for power cables were made usually by using only boundary temperature conditions, geometry, and material information [10]. In [11], experimental study results between the power cable sheath temperature and current relation were shown, only with the same environmental conditions. Numerous other studies related to the subject have also been presented in the literature [12–18].
This paper aims to perform a coherence analysis to determine the relationships among the sheath, conductor, and environmental temperatures of a power cable at different conditions. The experimental procedure and data collection are presented, and the analysis of the data is given.
2. Coherence analysis
In the signal processing literature, the common approach for extracting the information about the frequency features of a random signal is to transform the signal to the frequency domain by computing the discrete Fourier transform (DFT). Detailed descriptions of signal transforms can be found in various textbooks on digital signal processing; see, for example, [19,20].
The DFT provides a common means of frequency extraction of a random time-domain signal [21]. For a block of data of N samples, the transform at frequency m∆f (∆f : frequency resolution) is given by:
X(m∆f ) =
N∑−1
k=0
x [k∆t] e−j2πNmk. (1)
The autopower spectral density (APSD) of x(t) is estimated as:
Sxx(f ) =
1
N |X(m∆f)|
2
, f = m∆f. (2)
The cross-power spectral density (CPSD) between x(t) and y(t) is similarly estimated. The statistical accuracy of the estimate in Eq. (2) increases as the number of data points or data blocks increase.
The causality of 2 signals or the commonality between them is usually estimated using the coherence function. The coherence function is given by:
γxy(f ) = |S
xy(f )| √
Sxx(f )Syy(f )
, 0 < γxy < 1, (3)
where Sxxand Syy are the APSDs of x(t) and y(t) , respectively, and Sxy is the CPSD between x(t) and y(t) .
A value of coherence close to unity indicates a highly linear and close relationship between the 2 signals.
3. Experimental set-up and measurement system
Experimental studies are performed in order to examine the relationship between current and temperature in power cables. For this purpose, current levels, conductor temperature, and sheath temperature were recorded
for a low voltage power cable in laboratory conditions. The collected experimental data were analyzed within the MATLAB environment. All measurements were performed in the ˙Istanbul Technical University Faculty of Electrical and Electronics Engineering High Voltage Laboratory in Turkey.
The cable used in the experiment is a low-voltage power cable, structurally 0.6/1/1.2 (U0/Un/Um) kV,
3 × 35/16 mm2, 31/2 core (3 phase, 1 neutral), PVC-insulated, and armored with a galvanized flat steel wire cross-hold steel band, with inner and outer PVC sheaths.
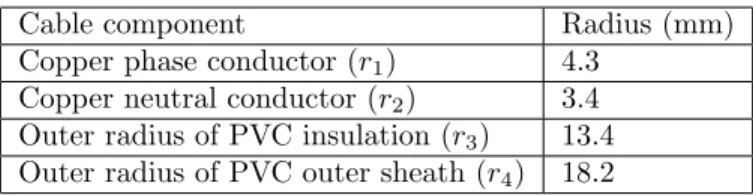
The catalog information of this PVC-insulated cable with a 29.1-mm outer diameter specifies that DC
resistance at 20 ◦C is 0.524 Ω /km and the maximum operating temperature is 70 ◦C [1]. Geometric properties
of the tested cable are given in the Table and a cross-section of the cable is shown in Figure 1.
Table. Radius of the power cable components.
Cable component Radius (mm)
Copper phase conductor (r1) 4.3
Copper neutral conductor (r2) 3.4
Outer radius of PVC insulation (r3) 13.4
Outer radius of PVC outer sheath (r4) 18.2
In Figure 1, O is the center of the cable; O1 and O2 represent the centers of the phase and neutral
conductors, respectively. Thickness of the core insulation for each phase conductor, dS1, is 0.54 mm, and the
insulation thickness for the neutral conductor, dS2, is 0.33 mm.
In order to examine the relationship between the current and the temperature regarding power cables in water and air, a polyester test container was used. During the measurements, the cable was placed halfway from the sides and at a 15-cm distance from the bottom of the container. The experimental set-up is shown in Figure 2. Conductor (Cu) PVC O r1 r2 r3 r4 O1 O2 ds1 ds2 O Ventilator Experiment Pool Tested Cable Shunt Resistor Current Source Termocouples
Figure 1. Cross-section of the power cable used. Figure 2. Experimental set-up for 0.6/1-kV cable.
The current for the power cable was supplied from a welding machine; the highest output current is 300 A. A Variac on the welding machine adjusts the output current. The highest current value that the cable can carry in steady state operation is 132 A in the catalog of that cable. During the experiment, phase conductors were connected to each other in series.
Conductor and sheath temperatures were measured 50 cm apart from both ends of the current source in accordance with the defined temperature measurement conditions in the relevant Turkish standard [22].
In the test, the measurement data were acquired from 7 different points. Six of these points are utilized for temperature measurements. Only one point is utilized for current measurement. Four temperature measurement nodes, which measure conductor temperatures, are located on the conductor and sheath at both ends. The other 2 nodes measure air and water temperatures.
A constant current of 132 A is passed through the power cable for 3 h during the following situations. After each case, there was a waiting period of almost 3 h for the heated cable to cool down:
• The cable in air with natural convection, • The cable in air with forced convection, • The cable in water with natural convection, • The cable in water with forced convection.
The current and temperature data are measured by dedicated analog sensors and are then taken by LabVIEW to be further utilized on a personal computer.
The used data acquisition system consists of the following components made by National Instruments
(NI): the voltage range of analog input module used for the current measurements was ±60 mV (NI
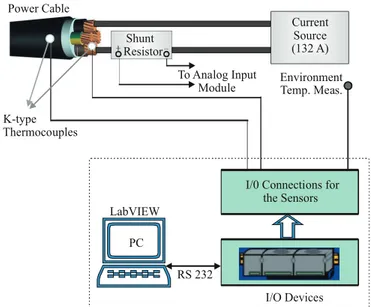
FP-AI-110). The current measurement was performed using a shunt resistor of 60 mV/400 A. For the temperature measurements, K-type thermocouples and a temperature module (NI FP-TC-120) were used. The test set-up is shown in Figure 3. Additionally, Figure 4 shows LabVIEW’s visual front panel, specially developed for the test measurements. Environment Temp. Meas. K-type Thermocouples Shunt Resistor To Analog Input Module I/O Devices I/0 Connections for
the Sensors RS 232 PC LabVIEW Current Source (132 A) Power Cable
Figure 3. Test system configuration.
4. Data analysis and spectral results
As a result of the data acquisition, the collected data are listed as follows:
• Current value at 132 A, • Temperature of the conductor,
• Temperature of the power cable sheath, • Temperature of the environment.
0 1000 2000 3000 4000 5000 6000 7000 8000 9000 10,000 0 20 40 60 80 100 120 140 Time [s]
Power cable in air with forced convection
Current Cable conductor
temperature Cable sheathtemperature Environmenttemperature
(a) 0 1000 2000 3000 4000 5000 6000 7000 8000 9000 10,000 0 20 40 60 80 100 120 140 Time [s]
Power cable in air with natural convection
Current Cable conductor
temperature Cable sheathtemperature Environmenttemperature (b) A m pl it ude [A , ° C] A m pl it ude [A , ° C]
Figure 4. LabVIEW’s front panel as graphical user interface for the test system.
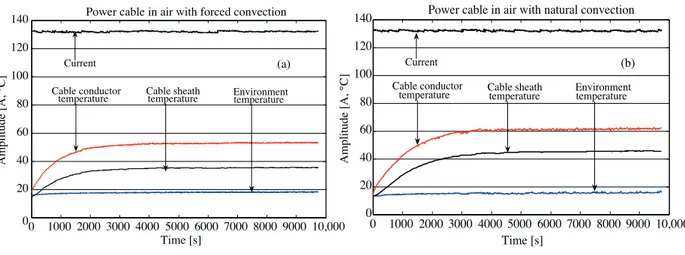
The above quantities are measured for different conditions in the air and water and with/without forced
convection. Their time-domain representations are shown in Figures 5a and 5b, and Figures 6a and 6b,
respectively. 0 1000 2000 3000 4000 5000 6000 7000 8000 9000 10,000 0 20 40 60 80 100 120 140 Time [s]
Power cable in air with forced convection
Current Cable conductor
temperature Cable sheathtemperature Environmenttemperature
(a) 0 1000 2000 3000 4000 5000 6000 7000 8000 9000 10,000 0 20 40 60 80 100 120 140 Time [s]
Power cable in air with natural convection
Current Cable conductor
temperature Cable sheathtemperature Environmenttemperature (b) A m pl it ude [A , ° C] A m pl it ude [A , ° C]
Figure 5. Data for current and temperatures of the cable parts and environment in air: a) with forced convection, b) with natural convection.
From the figures related to the spectra, in Figure 7a, it is observed that the spectrum of the environment temperature follows the spectrum of the conductor temperature. However, some harmonic components are seen; in this manner, the variation is similar to the spectrum of the sheath temperature. Under the condition of natural convection, these harmonics do not appear for the spectrum of the conductor, while the spectra of the environment temperature and sheath temperature follow each other as seen in Figure 7b. In terms of the Figures 8a and 8b, similar properties are observed.
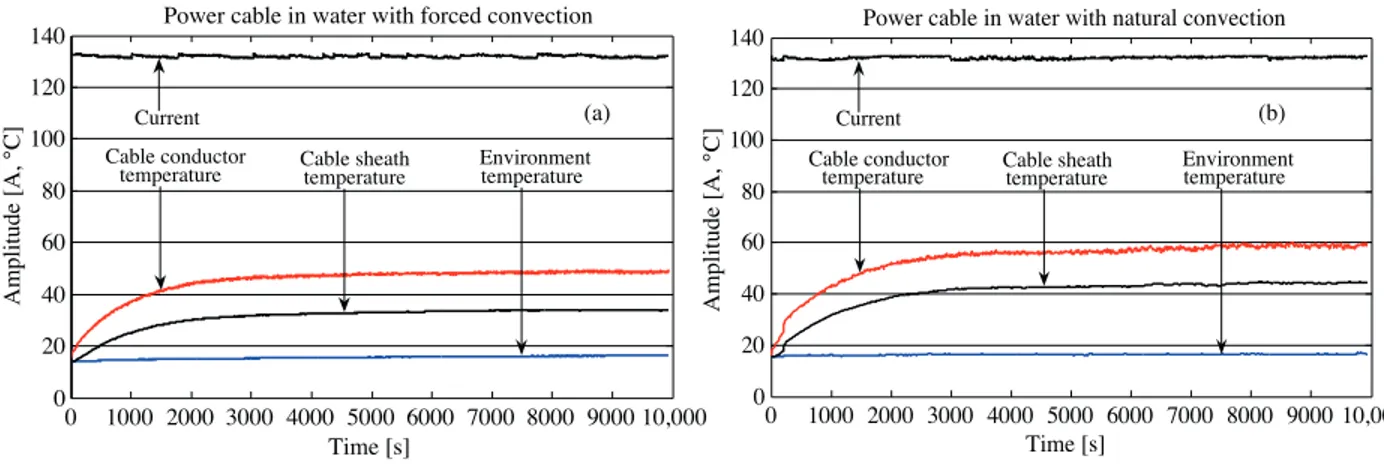
0 1000 2000 3000 4000 5000 6000 7000 8000 9000 10,000 0 20 40 60 80 100 120 140 Time [s]
Power cable in water with forced convection
Current Cable conductor
temperature Cable sheathtemperature Environmenttemperature
(a) 0 1000 2000 3000 4000 5000 6000 7000 8000 9000 10,000 0 20 40 60 80 100 120 140 Time [s]
Power cable in water with natural convection
Current Cable conductor
temperature Cable sheathtemperature Environmenttemperature
(b) A m pl it ude [A , ° C] A m pl it ude [A , ° C]
Figure 6. Data for current and temperatures of the cable parts and environment in water: a) with forced convection, b) with natural convection.
The spectral variations are given in Figures 7a and 7b and Figures 8a and 8b, respectively, after the time-domain representations of the measured signals.
0 0.2 0.4 0.6 0.8 1 1.2 1.4 1.6 1.8 2 10-6 10-4 10-2 100 102 104 106 108 Frequency [Hz]
Spectra for current and temperatures of the cable in air with forced convection
Current Cable conductortempetarure Cable sheathtemperature Environmenttemperature (a)
0 0.2 0.4 0.6 0.8 1 1.2 1.4 1.6 1.8 2 Frequency [Hz]
Spectra for current and temperatures of the cable in air with natural convection
Current Cable conductortemperature Cable sheathtemperature Environmenttemperature (b) A m pl it ude 10-6 10-4 10-2 100 102 104 106 108 A m pl it ude
Figure 7. Spectra for the current and temperatures of the cable parts in air: a) with forced convection, b) with natural convection.
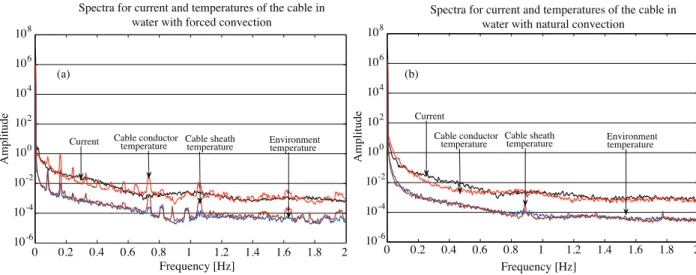
For the experiment with forced convection in water, the spectra of the conductor and sheath temperatures contain the harmonic components and the spectrum of the sheath temperature follows the spectrum of the environment temperature. Additionally, for natural convection status, these harmonics do not resemble the
previous test in air. As a result, it can be concluded that there is strong correlation among the sheath,
conductor, and environment temperatures. These independencies can be shown by the coherence analysis
and related frequency values are determined due to high correlation levels. These normalized cross-spectral variations, which are called coherence, can be given by the following figure. Hereby, the most convenient interaction is considered for the test in water with forced convection because the spectrum of the cable current also follows the spectral variations of the conductor and environment temperature, as seen in Figure 8b. Hence, this situation is shown by the coherence analysis approach in Figure 9.
0 0.2 0.4 0.6 0.8 1 1.2 1.4 1.6 1.8 2 10-6 10-4 10-2 100 102 104 106 108 Frequency [Hz]
Spectra for current and temperatures of the cable in water with forced convection
Current Cable conductortemperature Cable sheathtemperature Environment temperature (a) 0 0.2 0.4 0.6 0.8 1 1.2 1.4 1.6 1.8 2 10-6 10-4 10-2 100 102 104 106 108 Frequency [Hz]
Spectra for current and temperatures of the cable in water with natural convection
Current
Cable conductor
temperature Cable sheathtemperature Environmenttemperature (b) A m pl it ude A m pl it ude
Figure 8. Spectra for the current and temperatures of the cable parts in water: a) with forced convection, b) with natural convection. 0 0.2 0.4 0.6 0.8 1 1.2 1.4 1.6 1.8 2 0 0.1 0.2 0.3 0.4 0.5 0.6 0.7 0.8 0.9 1 Frequency [Hz]
Coherence results for the cable in water with forced convection
2 4
1
3
5 6
1. Coherence between the current and cable sheath temp. 2. Coherence between the current and cable conductor temp. 3. Coherence between the cable conductor temp. and environment temp. 4. Coherence between the current and environment temp.
5. Coherence between the cable conductor temp. and cable sheath temp. 6. Coherence between the environment temp. and cable sheath temp.
A
m
pl
it
ude
Figure 9. Coherence results for the test of the power cable in water with forced convection.
According to these results, the most effective peaks take place between 0.75 and 1.65 Hz, which indicates
strong correlation among the sheath, conductor, and environment temperatures. However, the coherence
amplitudes, which are defined between the conductor and sheath temperatures, for a threshold value selected at around the level of 0.3 are observed at 0.19, 0.75, 1.063, and 1.65 Hz.
5. Conclusions
This paper described and analyzed the temperature of a cable operating under 4 different installations, namely in air and in water with free and forced convection. The main purpose of the study was to investigate the temperature effects in the cable for different environmental situations. For this reason, a low sampling-frequency value was considered to observe the temperature effects.
The results of the data analysis showed strong correlation among the sheath, conductor, and environment temperatures. In this manner, the coherence technique was used for the determination of this strong correlation level and the most correlated levels, which were greater than the level of 50%, were determined between the conductor and sheath temperatures at 0.19, 0.75, and 1.063 Hz.
For this study, the conductor and sheath temperatures of a low-voltage power cable in air and also in water with natural and forced convection tests were studied in a laboratory environment. Using different test conditions and measurement methods, different power cables in the different conditions may be tested and analyzed. Hence, the experiments can be performed under optimal test conditions. Temperature measurement locations may also be changed and different measurement methods can be utilized taking the heat distribution issue into account. For example, a distributed sensing method can be used instead of the conventional point temperature method.
Future studies may utilize the output of this paper and expand into heat transfer analysis and modeling.
Acknowledgments
The authors would like to extend their thanks for the support provided by the ˙Istanbul Technical University Faculty of Electrical and Electronics Engineering High Voltage Laboratory.
Nomenclature
x(t) A signal
g(t) A fixed dimension window
τ Centered time location
∆f Frequency resolution
∆t Data-sampling interval
γxy Coherence function
Sxx and Syy Autopower spectral density of x(t) and y(t)
Sxy Cross power spectral density between x(t) and y(t)
References
[1] G. Yilmaz, S.E. Karlik, “A distributed optical fiber sensor for temperature detection in power cables”, Sensors and Actuators A, Vol. 125, pp. 148–155, 2006.
[2] M. Karahan, ¨O. Kalenderli, “Coupled electrical and thermal analysis of power cables using finite element method”, in: V.S. Vikhrenko, Heat Transfer - Engineering Applications, InTech, pp. 205–230, 2011.
[3] G. Gela, J.J. Dai, “Calculation of thermal fields of underground cables using the boundary element method”, IEEE Transactions on Power Delivery, Vol. 3, pp. 1341–1347, 1998.
[4] C.C. Hwang, J.J. Chang, H.Y. Chen, “Calculation of ampacities for cables in trays using finite elements”, Electric Power Systems Research, Vol. 54, pp. 75–81, 2000.
[5] J. Nahman, M. Tanaskovic, “Determination of the current carrying capacity of cables using the finite element method”, Electric Power Systems Research, Vol. 61, pp. 109–117, 2002.
[6] I. Kocar, A. Erta¸s, “Thermal analysis for determination of current carrying capacity of PE and XLPE insulated power cables using finite element method”, IEEE Melecon, pp. 905–908, 2004.
[7] IEC Standard, PD IEC/TR 62095:2003, Electric Cables. Calculations of current ratings. Cable current rating calculations using finite element method, 2003.
[8] S. Whitehead, E.E. Hutchings, “Current rating of cables for transmission and distribution”, Journal of the IEE, Vol. 38, pp. 517–557, 1939.
[9] J.H. Neher, M.H. McGrath, “The calculation of the temperature rise and load capability of cable systems”, Transactions of the American Institute of Electrical Engineers Part III, Vol. 76, pp. 752–772, 1957.
[10] N. Kovac, I. Sarajcev, D. Poljak, “Nonlinear-coupled electric-thermal modeling of underground cable systems”, IEEE Transactions on Power Delivery, Vol. 21, pp. 4–14, 2006.
[11] S. Taskin, S. Seker, M. Karahan, C. Akinci, “Spectral analysis for current and temperature measurements in power cables”, Electric Power Components & Systems, Vol. 37, pp. 415–426, 2009.
[12] G.J. Anders, Rating of Electric Power Cables: Ampacity Calculations for Transmission, Distribution, and Industrial Applications, New York, IEEE Press, 1997.
[13] G.J. Anders, Rating of Electric Power Cables in Unfavorable Thermal Environment, New York, IEEE Press, 2005. [14] J.J. Desmet, D.J. Putman, F. D’hulster, R.J. Belmans, “Thermal analysis of the influence of nonlinear, unbalanced
and asymmetric loads on current conducting capacity of LV-cables”, IEEE PowerTech Conference, 2003.
[15] J.J. Desmet, D.J. Putman, G.M. Vanalme, R.J. Belmans, “Modelling and sensitivity analysis of the thermal behaviour of cables for different current conditions”, 11th International Conference on Harmonics and Quality of Power, pp. 471–476, 2004.
[16] S.P. Walldorf, J.S. Engelhardt, F.J. Hoppe, “The use of real-time monitoring and dynamic ratings for power delivery systems and the implications for dielectric materials”, IEEE Electrical Insulation Magazine, Vol. 15, pp. 28–33, 1999.
[17] O.E. Gouda, A.Z. El Dein, G.M. Amer, “Improving the under-ground cables ampacity by using artificial backfill materials”, Proceedings of the 14th International Middle East Power Systems Conference, pp. 38–43, 2010. [18] M. Karahan, H.S. Varol, ¨O. Kalenderli, “Thermal analysis of power cables using finite element method and
current-carrying capacity evaluation”, International Journal of Engineering Education, Vol. 25, pp. 1158–1165, 2009. [19] N. Kehtarnavaz, N. Kim, Digital Signal Processing System-Level Design Using LabVIEW, Burlington, MA, USA,
Newnes, 2005.
[20] M. Weeks, Digital Signal Processing Using MATLAB and Wavelets, Hingham, MA, USA, Infinity Science Press LLC, 2007.
[21] S.V. Vaseghi, Advanced Digital Signal Processing and Noise Reduction, Chichester, UK, Wiley, 2000.
[22] TS EN 50393, Turkish Standard, Cables-test methods and requirements for accessories for use on distribution cables of rated voltage 0.6/1.0 (1.2) kV, 2007.