Valentina Bello
Dept. of Electrical, Computer and Biomedical Engineering University of Pavia
Pavia, Italy
[email protected] M. Selim Hanay
Department of Mechanical Engineering Bilkent University
Ankara, Turkey [email protected]
Atakan B. Ari
Department of Mechanical Engineering Boston University
Boston, United States of America [email protected]
Kamil L. Ekinci
Department of Mechanical Engineering Boston University
Boston, United States of America [email protected]
Abstract—In this work, we describe a method to measure and characterize the mechanical properties of nano-electro-mechanical systems (NEMS) based on laser interferometry. The resonant mechanical modes of doubly-clamped nanomechanical beam resonators were first characterized using their thermal fluctuations in air. Afterwards, the NEMS devices were electro-thermally actuated, and their frequency responses were measured, also in air. The main novelty in this work is the simultaneous use of two electro-thermal actuators integrated on opposite ends of the NEMS, which could selectively actuate higher order modes based on the relative phase difference (of 0°, 45° or 90°) applied between the two actuators. All the measurements were carried out in a homodyne Michelson interferometer, allowing for ultrasensitive contact, non-invasive, remote, and non-destructive analysis.
Keywords—nano-electro-mechanical systems, optical measurements, laser interferometry, mechanical resonances, thermal noise, electro-thermal actuation
I. INTRODUCTION
In recent years, nano-electro-mechanical systems (NEMS) have attracted much interest from the scientific community [1]–[3]. They are similar to micro-electro-mechanical systems (MEMS), but are able to attain even better performance limits by virtue of their sub-micron dimensions. Because of their
interesting characteristics, NEMS have found applications in several fields of science and technology, in particular as sensors and actuators. In sensing, they have been used for analyzing gas properties [4], [5], mass spectrometry [6], [7], force detection [8], [9] and inertial imaging [10]. Moreover, higher order modes have recently been exploited in some applications, such as mass and stiffness sensing [11] and quality factor control [12]. Since these nano devices are often operated in their resonant modes, characterization and measurement of the resonance frequencies are of fundamental importance. Laser interferometry is a powerful measurement technique based on the use of highly-coherent light for the detection of displacements on the order of femtometers. An optical interferometer offers several advantages: it allows for non-invasive, non-contact, and remote analysis of the device of interest without applying any type of external stimulus or stress. Moreover, an interferometric measurement is non-destructive, allowing the same device to be tested many times and in different conditions without damaging the device. Because of these features, optical interferometry has already been widely exploited for the characterization of MEMS [13]– [15]. In this work, we used a He-Ne-based Michelson interferometer for characterizing the frequency response of suspended doubly-clamped nano-beams. First, the NEMS devices were characterized by their thermal fluctuations in air,
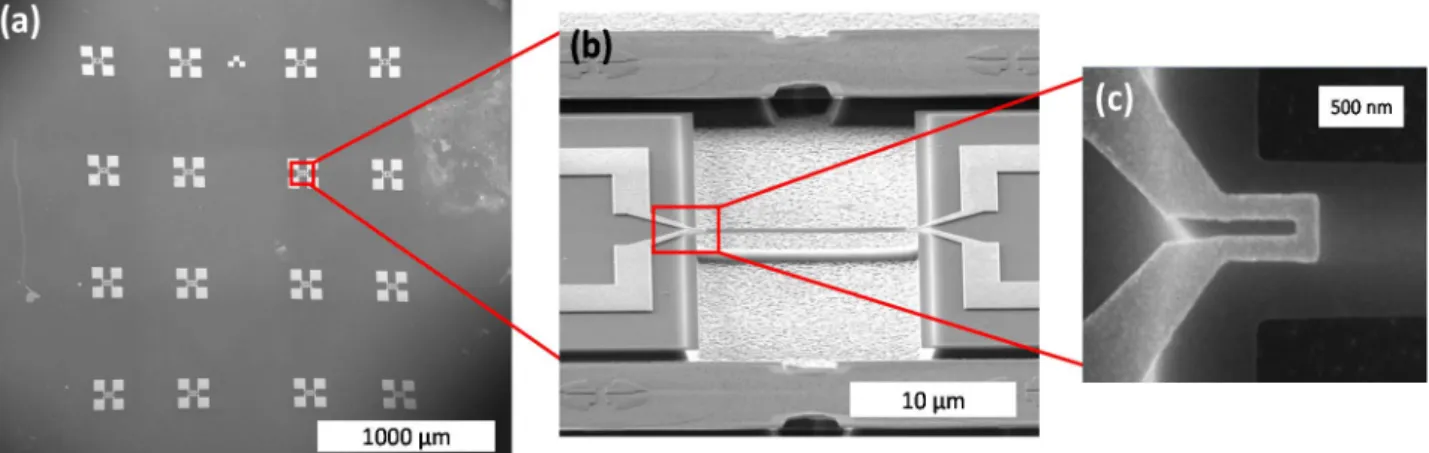
Fig. 1. (a) Scanning electron microscope images of a chip with 16 suspended nano-beams. (b) A single suspended SiN beam. (c) Zoomed area showing one of the gold electrodes at each end of the beam used for actuation.
This full text paper was peer-reviewed at the direction of IEEE Instrumentation and Measurement Society prior to the acceptance and publication .
Measurement and Characterization
of Nano-Electro-Mechanical Systems
and mechanical resonances up to the fifth harmonic were detected. Subsequently, the nano-beams were driven electro-thermally, using a double drive scheme based on phase-shifted voltage signals, and their responses were studied in air.
II. DOUBLY-CLAMPED BEAMS
The nano-electro-mechanical systems used in this work are suspended doubly-clamped beams, fabricated on a silicon-nitride layer over a silicon substrate [16]. Each beam has two nanofabricated gold electrodes (one at each extremity) that are used for actuation of the devices. The beams have width w = 950 nm, thickness t = 100 nm and length L in the range 5-60 μm. Fig. 1 shows scanning electron microscope images of an entire chip with 16 devices (Fig. 1(a)), a single NEMS device (Fig. 1(b)), and the area of a single device where one of the gold electrodes is fabricated (Fig. 1(c)).
III. ELECTRO-THERMAL ACTUATION
The devices were actuated exploiting the electro-thermal effect [17]. When a voltage is applied to the gold electrode, a current flows through the metallic layer. This causes Joule heating of the electrode, resulting in a temperature increase and subsequently thermal expansion of the electrode and the beam. Since gold and silicon nitride have different thermal expansion coefficients α (αAu 12 × 10-6 K-1, αSiN 3.3 ×
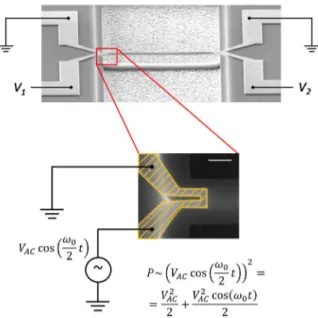
10-6 K-1), this differential thermal expansion produces a mechanical deformation of the structure and hence actuates flexural motion of the beam. In this work, we used a double actuation scheme (Fig. 2): the beams were driven by applying two sinusoidal voltage signals, V1 and V2, at the two gold
electrodes on both ends. The two signals had the same amplitude VAC and their frequency ω0/2 was varied
simultaneously. The phase difference between them was set equal to 0°, 45° or 90°. These particular values of phase difference were chosen because Joule heating actuates mechanical motion at twice the value of the frequency of the applied voltage. Indeed, the dissipated electrical power P is proportional to the square of the drive voltage:
P α [VAC cos(ω0t/2)]2 = VAC2/2 + [VAC2 cos(ω0t)]/2 (1)
Hence, 0°, 45° and 90° phase differences in the two drive voltages exert forces to opposite ends of the beam with 0°, 90° and 180° phase difference, respectively, which allow us to observe specific conditions and modes. The dissipated power at each electrode is given by the sum of a DC term and an AC term oscillating at frequency ω0.
IV. HOMODYNE MICHELSON INTERFEROMETER
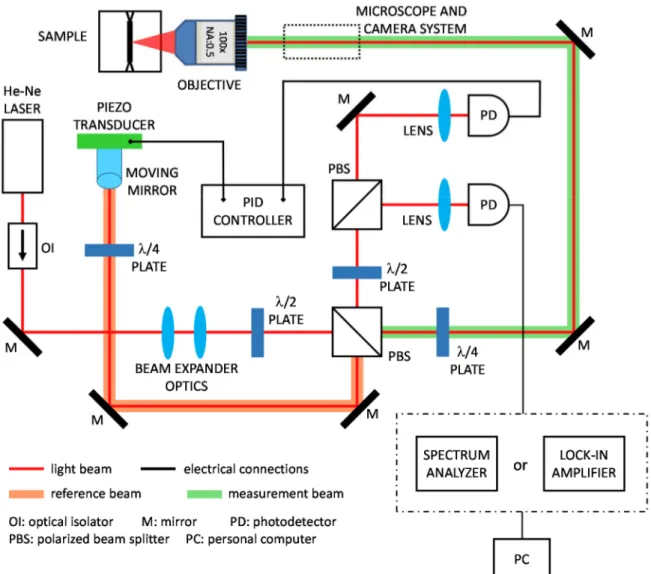
Fig. 3 shows the setup used for the experimental measurements. It is a homodyne free-space Michelson interferometer, where both the measurement and the reference beam have the same optical frequency. Light from a He-Ne laser (Research Electro-Optics Inc., CO, USA), emitted at a wavelength of 633 nm, is directed through an optical isolator, to protect the source from unwanted back-reflections, a series of beam expander optics and a half-wave plate towards a cube polarized beam splitter (PBS). The plate allows for adjusting the polarization and thus for controlling the fraction of light that is reflected or transmitted by the beam splitter. The reflected beam is redirected along the reference arm of the interferometer. It crosses a quarter-wave plate, and it reflects from a moving mirror mounted on a piezo transducer, connected to a proportional integrative-derivative (PID)
controller. Hence, the entire optical interferometer is in a closed feedback loop so that the path length of the reference arm can be adjusted to compensate for slow mechanical and optical path variations and to keep the system in the point of optimal sensitivity. The transmitted beam (measurement beam) crosses a quarter-wave plate, is focused by an objective lens with a magnification of 100X and a numerical aperture of 0.5 onto the sample under test, and it is back reflected to the PBS. The double pass through the quarter-wave plate shifts the polarization so that light can be reflected when it reaches the PBS. A series of lenses, a white light lamp and a camera (CX-ST50, Sony, Japan) are located along the measurement arm: they constitute a microscope system, which allows for monitoring in real-time the location of the laser spot with respect to the NEMS device. The reference and measurement beams are carefully aligned so that they can overlap and be directed towards another PBS. The two light beams are then focused through lenses onto two photodiodes (PD). One (PDA8A, Thorlabs, NJ, USA) carries the signal to the PID controller and is used for feedback stabilization; the other one (NewFocus 1801-AC-FS, Newport, CA, USA) is used to measure the nano-beam displacements and is connected to a spectrum analyzer (FieldFox N9918A, Keysight, CA, USA) for thermal noise measurements or a lock-in amplifier for driven measurements.
V. THEORY OF HOMODYNE INTERFEROMETRY In homodyne interferometry, the reference and the sample beam are at the same wavelength λ, and a change in the optical path of one of the arms results in a change in the interference path and thus the intensity of the light measured by the photodetector. If the reference and measurement arms have total lengths of zR and zM – 2d, respectively, the complex
electric fields AR and AM at the photodetector are given by
AR = aRexp [i(ωt – kzR)], (2)
AM = aMexp [i(ωt – k(zM – 2d))], (3)
Fig. 2. Double-side electro-thermal actuation. The nano-beams were actuated on both sides by applying two voltage signals, V1 and V2, with
where aR and aM are the electric field amplitudes, i is the
imaginary number, ω = 2πc/λ, k = 2π/λ and 2d is the variation in the sample arm length due to the movement of the NEMS device under test. The subscripts “R” and “M” refer to the reference and measurement signals, respectively. Then, the total intensity detected by the photodetector due to the interference between the two light beams is
ID= |AM + AR|2 =
= aM2 + aR2 + 2aMaRcos [k(zR – zM) + 2kd))]. (4)
If the displacement is much smaller than the wavelength (i.e., 2d ≪ λ), then Eq. (4) can be approximated as
ID ≈ (aM2 + aR2) + 2aMaRcos [k(zR – zM)]
− 4aMaRkdsin [k(zR – zM)]. (5)
The intensity ID is thus given by a constant background factor
(the two first terms of Eq. (5)) and a term that is proportional to the displacement of the device d (last term of Eq. (5)).
Moreover, zR – zM = nλ/4, with n odd integer number
represents the condition of maximum sensitivity because the background is minimized, and the term proportional to the displacement is maximized. Hence Eq. (5) reduces to:
ID = (aM2 + aR2) − 8πaMaRd/λ. (6)
The path-length stabilization system described above and constituted by the moving mirror and the PID controller is used to lock the optical path in the interferometer to the condition described by Eq. (6).
Fig. 3. Homodyne Michelson interferometer used to carry out the experimental measurements. Coherent light emitted by a He-Ne laser is divided by a polarized beam splitter (PBS) between the measurement arm (highlighted in green) and the reference arm (highlighted in orange). After recombination of the two beams, light is splitted by another PBS and directed towards two photodiodes (PD). One is used to carry out the measurement of the nano-beam displacement. The other PD provides the feedback signal for a proportional integrative-derivative (PID) controller for moving the mirror in order to stabilize the optical path.
VI. EXPERIMENTAL RESULTS
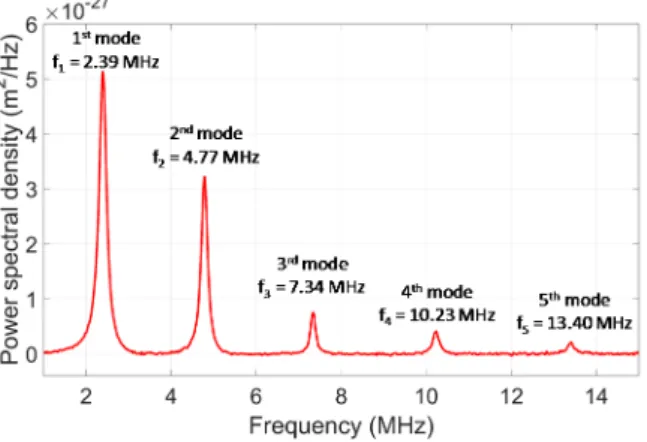
Experimental thermal-noise response and driven response measurements were carried out for a beam with length L = 40 μm. First, the thermo-mechanical response of the device in air was studied by measuring the displacement fluctuations of the nano-beam without applying any kind of external force. In this situation, the motion of the beam is caused by the thermal fluctuations in the surrounding fluid due to the finite temperature. In particular, the air molecules surrounding the
beam collide with the beam in a random way and transfer their momentum to the beam, which in turn actuates the beam motion. Experimental measurements are shown in Fig. 4. Mechanical resonant modes up the fifth harmonic were detected at a position of 0.25L. In particular, the first resonant mode is at a frequency f1 = 2.39 MHz, while higher order
modes are located at frequencies that roughly satisfies the condition fm = mf1, where m is the order of the mode (f2 = 4.77
MHz, f3 = 7.34 MHz, f4 = 10.23 MHz and f5 = 13.40 MHz).
Afterwards, the nano-beam was electro-thermally driven in air by applying two sinusoidal voltage signals V1 and V2, at
the two gold electrodes fabricated at the two ends of the beam. V1 and V2 both had amplitudes of 200 mV, and their
frequencies were varied simultaneously to measure the beam response in the frequency range 1-15 MHz. Moreover, phase difference between the two drive voltages was set to 0°, 45° or 90°, as explained in Section III. The experimental results, shown in Fig. 5, were repeated three times by moving the position of the laser spot along the beam as shown in Fig. 5(a). The measurements reported in Fig. 5(b) were performed at the center of the beam (i.e., positioning the laser spot at 0.5L), where it is possible to detect only the odd modes, since the amplitude of the even modes is zero at this position [18]. It is evident that first, third and fifth mode are strongly excited when the relative phase shift between drive signals is equal to 0° (red trace), while their amplitudes decrease by a factor of ~1.5 when the phase difference is set to 45° (green trace). The amplitudes become even smaller when the phase shift is 90° (blue trace). At position 0.25L (Fig. 5(c)), drive signals with Fig. 4. Spectrum of thermal fluctuations measured in air of a
nano-beam with length L = 40 μm. Mehanical modes up to the fifth were detected.
Fig. 5. Driven measurements carried out for a beam with L = 40 μm in air. (a) The three positions where the measurements were performed. Device response was studied at 0.5L (b), 0.25L (c), and 0.33L (d).
phase difference of 0° can excite the odd modes more strongly. On the other hand, when the phase difference is equal to 90°, the second and forth modes have higher amplitude and the first, third and fifth modes have nearly zero amplitude. In the case of a phase shift of 45°, all resonances can be excited with similar amplitude. Finally, measurements were repeated by positioning the beam spot at location 0.33L (Fig 5(d)). Measurements at this position are similar to those at 0.25L since the two positions are very close. The amplitude of the third mode is very small for every phase shift value because it has a zero-crossing very close to this position.
VII. CONCLUSIONS
Laser interferometry is a powerful measurement technique that can be exploited to perform contact, remote, non-destructive measurements on NEMS devices. In this work, we used a homodyne Michelson scheme to characterize the mechanical frequency response of doubly clamped nano-beams. In particular, a beam with a length of L = 40 μm was investigated. From spectral analysis of the thermal motion of the beam, the first five resonant modes were detected. Electro-thermally actuated measurements were also performed in air. The unique contribution of this work was to drive the nano-beam by exploiting a double actuation scheme, where two voltage signals were simultaneously applied, one at each side of the NEMS, with the same amplitude and frequency but with a relative phase difference set to 0°, 45° or 90°. This resulted in actuation forces on two ends of the beam that either enhanced or reduced the motion, depending on the imposed phase difference. It was observed that when the phase difference between the signals was 0°, odd modes were excited more strongly, while with a phase difference of 90° even modes were excited at a higher amplitude. If the phase shift was set to 45°, it was possible to excite all resonant modes simultaneously.
REFERENCES
[1] K. L. Ekinci and M. L. Roukes, “Nanoelectromechanical systems,”
Rev. Sci. Instrum., vol. 76, no. 6, p. 061101, Jun. 2005.
[2] T. Kouh, D. Karabacak, D. H. Kim, and K. L. Ekinci, “Diffraction effects in optical interferometric displacement detection in nanoelectromechanical systems,” Appl. Phys. Lett., vol. 86, no. 1, p. 013106, Jan. 2005.
[3] T. Kouh, M. Hanay, and K. Ekinci, “Nanomechanical Motion Transducers for Miniaturized Mechanical Systems,” Micromachines, vol. 8, no. 4, p. 108, Apr. 2017.
[4] V. Kara, Y.-I. Sohn, H. Atikian, V. Yakhot, M. Lončar, and K. L. Ekinci, “Nanofluidics of Single-Crystal Diamond Nanomechanical Resonators,” Nano Lett., vol. 15, no. 12, pp. 8070–8076, Dec. 2015. [5] V. Kara, V. Yakhot, and K. L. Ekinci, “Generalized Knudsen Number
for Unsteady Fluid Flow,” Phys. Rev. Lett., vol. 118, no. 7, p. 074505, Feb. 2017.
[6] M. S. Hanay et al., “Single-protein nanomechanical mass spectrometry in real time,” Nat. Nanotechnol., vol. 7, no. 9, pp. 602– 608, Sep. 2012.
[7] E. Sage et al., “Neutral particle mass spectrometry with nanomechanical systems,” Nat. Commun., vol. 6, no. 1, p. 6482, May 2015.
[8] E. T. Herruzo, A. P. Perrino, and R. Garcia, “Fast nanomechanical spectroscopy of soft matter,” Nat. Commun., vol. 5, no. 1, p. 3126, May 2014.
[9] L. M. de Lépinay, B. Pigeau, B. Besga, P. Vincent, P. Poncharal, and O. Arcizet, “A universal and ultrasensitive vectorial nanomechanical sensor for imaging 2D force fields,” Nat. Nanotechnol., vol. 12, no. 2, pp. 156–162, Feb. 2017.
[10] M. S. Hanay, S. I. Kelber, C. D. O’Connell, P. Mulvaney, J. E. Sader, and M. L. Roukes, “Inertial imaging with nanomechanical systems,”
Nat. Nanotechnol., vol. 10, no. 4, pp. 339–344, Apr. 2015.
[11] E. Gil-Santos et al., “Nanomechanical mass sensing and stiffness
spectrometry based on two-dimensional vibrations of resonant nanowires,” Nat. Nanotechnol., vol. 5, no. 9, pp. 641–645, Sep. 2010. [12] W. J. Venstra, H. J. R. Westra, and H. S. J. van der Zant, “Q-factor
control of a microcantilever by mechanical sideband excitation,”
Appl. Phys. Lett., vol. 99, no. 15, p. 151904, Oct. 2011.
[13] V. Annovazzi-Lodi, M. Benedetti, S. Merlo, and M. Norgia, “Optical Detection of Multiple Modes on Resonant Micromachined Structures,” IEEE Photonics Technol. Lett., vol. 16, no. 7, pp. 1703– 1705, Jul. 2004.
[14] G. Silva, F. Carpignano, F. Guerinoni, S. Costantini, M. De Fazio, and S. Merlo, “Optical Detection of the Electromechanical Response of MEMS Micromirrors Designed for Scanning Picoprojectors,” IEEE J.
Sel. Top. Quantum Electron., vol. 21, no. 4, pp. 147–156, Jul. 2015.
[15] V. Annovazzi-Lodi, M. Benedetti, S. Merlo, and M. Norgia, “Spot Optical Measurements on Micromachined Mirrors for Photonic Switching,” IEEE J. Sel. Top. Quantum Electron., vol. 10, no. 3, pp. 536–544, May 2004.
[16] A. B. Arı, M. Çağatay Karakan, C. Yanık, İ. İ. Kaya, and M. Selim Hanay, “Intermodal Coupling as a Probe for Detecting Nanomechanical Modes,” Phys. Rev. Appl., vol. 9, no. 3, p. 034024, Mar. 2018.
[17] I. Bargatin, I. Kozinsky, and M. L. Roukes, “Efficient electrothermal actuation of multiple modes of high-frequency nanoelectromechanical resonators,” Appl. Phys. Lett., vol. 90, no. 9, p. 093116, Feb. 2007. [18] A. N. Cleland, Foundations of Nanomechanics : From Solid-State