The Kuznets curve and the effect of international regulations
on environmental efficiency
Baris K. Yörük Osman Zaim
Boston College Bilkent University
Abstract
This paper extends the results of series of papers, i.e., Zaim (2004) and Yörük and Zaim (2005a, 2005b). We construct an environmental efficiency index for OECD countries and establish an environmental Kuznets curve relationship between environmental efficiency and income. We then investigate the effect of an international protocol on reducing global emissions on the environmental efficiency.
Frank Gollop, Syed F. Mahmud, Richard Tresch, Asel Aliyasova, and Süheyla Özyildirim provided helpful comments. Usual disclaimer applies.
Citation: Yörük, Baris K. and Osman Zaim, (2006) "The Kuznets curve and the effect of international regulations on environmental efficiency." Economics Bulletin, Vol. 17, No. 1 pp. 1−7
Submitted: December 20, 2005. Accepted: February 23, 2006.
1. Introduction
The environmental Kuznets curve hypothesis claims that there exists an inverted U-type relationship between the level of pollution emissions and income. The economic intuition behind this result is that once a country reaches a certain standard of living, concerns about environment become increasingly pronounced and necessary institutional, legal, and technological regulations take place to reduce relevant emissions to desirable levels. To investigate the existence of a Kuznets curve relationship, a common methodology adopted in the literature (Grossman and Krueger, 1995; Selden and Song, 1994; Holtz-Eakin and Selden, 1995) has been a trial and error approach in which different functional forms are estimated to obtain a statistically significant fit between some measures of environmental efficiency and per capita income levels. The results of these studies support the Kuznets relationship for air pollutants, i.e., sulphur dioxide and suspended particulates, but they are mixed for water pollutants. In addition, none of these studies addresses the impact of aggregate pollution, i.e., the effect of air and water pollutants together.
This paper contributes to the previous empirical literature on the environmental Kuznets curve hypothesis in three aspects. First, following the studies that try to quantify the opportunity cost of adopting a more environmentally desirable production process, i.e., Färe et al. (1989), we recognize the underlying production mechanism, which converts inputs into outputs and pollutants. Second, in computing an environmental efficiency index, we assess the aggregate effect of environmental degradation that consists of both air and water pollution. Hence, we investigate the relationship between the aggregate effect of pollutants and income rather than addressing the relationship between a single pollutant and income. Third, we show the positive effect of an international protocol on reducing global emissions, the United Nations Framework Convention on Climate Change (hereafter, UNFCCC) that has been ratified by all OECD countries by 19941,on our environmental efficiency index.
The rest of this paper is organized as follows. Section two describes the methodology used. Section three presents the data, and the findings relating to environmental efficiency, the Kuznets curve, and the effect of the UNFCCC on environmental efficiency. Section four concludes.
2. Methodology
Following Zaim (2004), we construct an environmental efficiency index to measure the environmental performance of the OECD countries. The basic idea of this method relies on the construction of a quantity index of undesirable outputs, i.e., pollutants, and a quantity index of desirable outputs by giving due emphasis to the distinctive characteristics of production with pollutants. Consider the technology set
)} , ( produce can : ) , , {(x y b x y b
T = , where x indexes the vector of inputs, y indexes the vector of desirable outputs, and b indexes the vector of undesirable outputs. The quantity index of desirable outputs measures the success of country i in expanding its desirable
outputs while using the same level of inputs and producing the same level of pollutants compared to another country j , in a production environment in which the disposal of undesirable outputs is costly. The quantity index of undesirable outputs measures the ________________________
success of country i in contracting its pollutants while holding its desirable outputs and
inputs at the same level as to another countryj . Our environmental efficiency index is
defined as the ratio of these two indices. Formally, we define a sub-vector distance for desirable outputs asDy(x,y,b)=inf{θ :(x,y/θ,b)∈T}, which holds the inputs and undesirable outputs fixed and expands the good outputs as much as feasible, and an input based distance function asDb(x,y,b)=sup{λ:(x,y,b/λ)∈T}, which holds the inputs and desirable outputs fixed and contracts the undesirable outputs as much as feasible. We define the function ( , , , ) ( , , )/ ( o, j, o)
y o i o y j i o o y x b y y D x y b D x y b Q = as the quantity
index of desirable outputs, and ( , , , ) ( , , )/ ( o, o, j) b i o o b j i o o b x y b b D x y b D x y b Q = as the
quantity index of undesirable outputs. Finally, we formulate our efficiency index as
) , , , ( / ) , , , ( ) , , , , , , ( 0 0 0 0 0 0 0 . i j b j i y j i j i l k x y b y y b b Q x y b b Q x b y y
E = , which satisfies all
the desirable properties of index numbers as documented by Fisher (1922). We present the linear programming problems in computing the distance functions mentioned in the Appendix section.
3. Data and Discussion of Results
Employing the methodology above, the environmental performance of OECD countries is analyzed for the 1983-1998 period. The input set is represented by the net fixed capital stock and labor, whereas GDP is used to represent desirable output set. The data on these variables are taken from Marquetti (2002)2. Total carbon dioxide emissions (hereafter, CO2) and organic water pollutant emissions (hereafter, WP) are the proxies for
air and water pollutants respectively, both of which are taken from World Development Indicators (World Bank, 2003). The empirical analysis in this section is presented in two steps. The first step involves the decomposition of the environmental efficiency index with GDP as the desirable output, CO2 and WP as the undesirable outputs, and the capital
stock and labor as productive inputs. In the second step, the environmental Kuznets curve hypothesis is analyzed along with the effect of UNFCCC on the environmental efficiency of OECD countries.
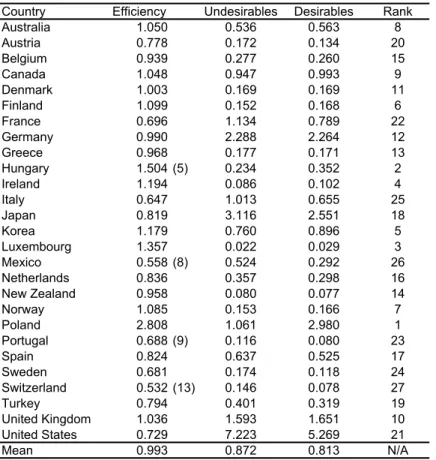
In computing our environmental efficiency index, rather than assigning an individual country as a reference as suggested by the previous studies, we start our analysis by creating a hypothetical country3 to assess the performance of countries relative to the average. Table I reports the mean efficiency index relative to the hypothetical country and its decomposition into desirable and undesirable quantity indices. Notice that efficiency scores greater than 1 (less than 1) represents a better (inferior) performance with respect to the hypothetical country, which takes the value of 1 for all years and indices computed4.
________________________
2 GDP is defined as purchasing power adjusted with 1996 prices. Labor is defined as the number of
employed workers. The estimation of the net fixed standardized capital stock is explained in Marquetti (2002).
3 The data for the hypothetical country are calculated by the taking the cumulative average of the OECD
countries for each of the variables considered.
4Some countries yield infeasible solutions for some years. In order to reduce the number of infeasible
solutions, following Färe et al. (2001), we assume that each year’s technology is determined by observations on inputs and outputs from the current period and the past two periods. Färe et al. (2001) discusses the relevance and technical details on infeasible solutions when constructs index numbers.
Poland, Hungary, and Luxembourg appear to be the three best performers among the OECD countries, while Italy, Mexico, and Switzerland are ranked the three worst. Notice that, most of the countries yield inferior efficiency scores relative to the hypothetical country.
Table I. Mean Environmental Efficiency Index
Country Efficiency Undesirables Desirables Rank Australia 1.050 0.536 0.563 8 Austria 0.778 0.172 0.134 20 Belgium 0.939 0.277 0.260 15 Canada 1.048 0.947 0.993 9 Denmark 1.003 0.169 0.169 11 Finland 1.099 0.152 0.168 6 France 0.696 1.134 0.789 22 Germany 0.990 2.288 2.264 12 Greece 0.968 0.177 0.171 13 Hungary 1.504 (5) 0.234 0.352 2 Ireland 1.194 0.086 0.102 4 Italy 0.647 1.013 0.655 25 Japan 0.819 3.116 2.551 18 Korea 1.179 0.760 0.896 5 Luxembourg 1.357 0.022 0.029 3 Mexico 0.558 (8) 0.524 0.292 26 Netherlands 0.836 0.357 0.298 16 New Zealand 0.958 0.080 0.077 14 Norway 1.085 0.153 0.166 7 Poland 2.808 1.061 2.980 1 Portugal 0.688 (9) 0.116 0.080 23 Spain 0.824 0.637 0.525 17 Sweden 0.681 0.174 0.118 24 Switzerland 0.532 (13) 0.146 0.078 27 Turkey 0.794 0.401 0.319 19 United Kingdom 1.036 1.593 1.651 10 United States 0.729 7.223 5.269 21 Mean 0.993 0.872 0.813 N/A
Notes: The number of infeasible solutions is in parenthesis. Undesirables: Mean country quantity index of undesirable outputs.
Desirables: Mean country quantity index of desirable outputs
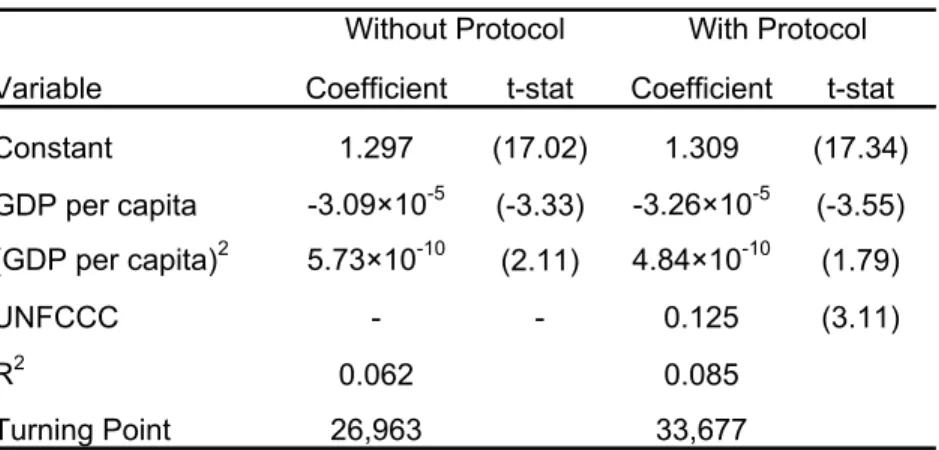
In this study, our main objective is to determine if there exists an environmental Kuznets curve relationship between efficiency scores and GDP per capita, and to assess the effect of UNFCCC on the efficiency index. In Table II, we report the parametric regression results using the environmental efficiency index as dependent variable both with and without the effect of UNFCCC5. In the first specification that ignores the effect of UNFCCC, significant parameter estimates of GDP per capita and its quadratic term imply a U-type relationship between GDP per capita and the efficiency index. This estimate supports the environmental Kuznets curve hypothesis6. That is it implies that the ______________________
5 Yörük and Zaim (2005a) show the positive effect of the UNFCCC on productivity growth measures that
incorporate negative externalities. Yörük and Zaim (2005b) show the positive effect of UNFCCC on environmental performance when share of industry is considered in the analysis. But neither of the papers tests the Kuznets curve hypothesis.
6 Taskin and Zaim (2000) find a similar result employing a non-parametric index of environmental
environmental efficiency in OECD countries declines in the initial stages of development up until a threshold income level of $26,963 and then once this threshold level of income is reached, it starts increasing. In the second specification that incorporates the effect of UNFCCC, the same relationship is observed with a threshold income level of $33,677. In addition, the coefficient of the dummy variable capturing the effect of UNFCCC is posive and statistically significant, supporting the positive effect of UNFCCC on environmental efficiency in OECD countries that have ratified the convention.
Table II. Relationship between Environmental Efficiency and Income per Capita
Variable Coefficient t-stat Coefficient t-stat
Constant 1.297 (17.02) 1.309 (17.34) GDP per capita -3.09×10⁻⁵ (-3.33) -3.26×10⁻⁵ (-3.55) (GDP per capita)2 5.73×10⁻¹⁰ (2.11) 4.84×10⁻¹⁰ (1.79) UNFCCC - - 0.125 (3.11) R2 0.062 0.085 Turning Point 26,963 33,677
Without Protocol With Protocol
Notes: UNFCCC is a dummy variable that takes the value of one for the year, in which
the sample country ratified the UNFCCC and all subsequent years. 4. Conclusion
In this paper, we first construct an environmental efficiency index for the OECD countries and investigate an environmental Kuznets curve relationship between GDP per capita and envonmental efficiency. We find evidence of the existence of such a relationship. We then show the positive effect of international regulations, i.e., the UNFCCC, on environmental performance.
Appendix
In order to compute the environmental performance index, we need to solve two linear programming problems by employing DEA methodology. Assuming that j=0 refers to the associated quantities of hypothetical country and letting k =1,...K to index the countries in our sample, for each countryk′=1,...,K, we may compute for each sub-period (year) . . max )) , , ( ( 0 0 1 t s b y x D k y = θ − ′
∑
= ′ ≥ K k k m k m ky y z 1 θ m=1,...,M∑
= = K k j k j kb b z 1 0 j=1,...,J (1)∑
= ≤ K k n k n kx x z 1 0 n=1,...,N 0 ≥ k z k =1,...,Kwhich constitutes the numerator for ( 0, 0, k, l)
y x b y y
Q . The denominator is computed by replacing yk′ on the right hand side of the good output constraint with the observed
output for the hypothetical country ( y0). This problem constructs the best practice
frontier for each sub-period and computes the scaling factor on good outputs required for each observation to attain best practice.
On the other hand, the quantity index of bads can be computed by solving the following problem for each countryk′=1,...,K :
. . min )) , , ( ( 0 0 1 t s b y x D k y = λ − ′
∑
= ≥ K k m k m ky y z 1 0 m=1,...,M∑
= ′ = K k k j k j kb b z 1 λ j=1,...,J (2)∑
= ≤ K k n k n kx x z 1 0 n=1,...,N 0 ≥ k z k =1,...,KThis problem constitutes the numerator for ( 0, 0, k, l)
b x y b b
Q . The denominator is
computed by replacing bk′ on the right hand side of the bad output constraint with the
observed bad outputs for the hypothetical country (b ). Similar to the quantity index of 0
goods, this problem constructs the best practice frontier and computes the scaling factor on bad outputs required for each observation to attain the best practice.
References
Färe, R., Grosskopf, S., Lovell, C.A.K, and C. Pasurka (1989) “Multilateral productivity comparisons when some outputs are undesirable” Review of Economics and Statistics 71, 90-98.
Färe, R., Grosskopf, S., and C. Pasurka (2001) “Accounting for air pollution emissions in measuring state manufacturing productivity growth” Journal of Regional Science 41, 381-409.
Grossman, G. M. and A.B. Krueger (1995) “Economic growth and the environment”
Holtz-Eakin, D. and T. M. Selden (1995) “Stoking the fires? CO2 emissions and economic growth” Journal of Public Economics 57, 85-101.
Marquetti, A. (2001) Extended Penn World Tables 2.0. Data Set. Available at
http://homepage.newschool.edu/~foleyd/epwt .
Selden, T. M. and D. Song (1994) “Environmental quality and development: Is there a Kuznets curve in air pollution emissions?” Journal of Environmental Economics and
Management 27, 147-162.
Taskin, F. and O. Zaim (2000) “Searching for a Kuznets curve in environmental efficiency using kernel estimation” Economics Letters 68, 217-223.
World Bank, 2003, World Development Indicators, World Bank, Washington, DC.
Yörük, B.K. and O. Zaim (2005a) “Productivity growth in OECD countries: A comparison with Malmquist indices” Journal of Comparative Economics 33, 401-420. Yörük, B.K. and O. Zaim (2005b) “International regulations and environmental performance, Boston College, manuscript.
Zaim, O. (2004) “Measuring environmental performance of state manufacturing through changes in pollution intensities: A DEA framework” Ecological Economics 48, 37-47.