FOR OPTIMAL BUFFER ALLOCATION
IN PRODUCTION LINES
A THESIS
SUBMITTED TO THE DEPARTMENT OF INDUSTRIAL
ENGINEERING
AND THE INSTITUTE OF ENGINEERING
AND SCIENCE OF BILKENT UNIVERSITY
IN PARTIAL FULFILLMENT OF THE REQUIREMENTS
FOR THE DEGREE OF
MASTER OF SCIENCE
By
Ömer Selvi
September, 2002
Asst. Prof. Murat Fadıloğlu
I certify that I have read this thesis and that in my opinion it is fully adequate, in scope and in quality, as a thesis for the degree of Master of Science.
Prof. İhsan Sabuncuoğlu
I certify that I have read this thesis and that in my opinion it is fully adequate, in scope and in quality, as a thesis for the degree of Master of Science.
Prof. Erdal Erel
Approved for the Institute of Engineering and Science
Prof. Mehmet Baray
i
Abstract
THE LINE BALANCING ALGORITHM
FOR OPTIMAL BUFFER ALLOCATION
IN PRODUCTION LINES
Ömer Selvi
M.S. in Industrial Engineering
Supervisor: Asst. Prof. Murat Fadıloğlu
September, 2002
Buffer allocation is a challenging design problem in serial production lines that is often faced in the industry. Effective use of buffers (i.e. how much buffer storage to allow and where to place it) in production lines is important since buffers can have a great impact on the efficiency of the production line. Buffers reduce the blocking of the upstream station and the starvation of the downstream station. However, buffer storage is expensive both due to its direct cost and the increase of the work-in-process inventories it causes. Thus, there is a trade-off between performance and cost. This means that the optimal buffer capacity and the allocation of this capacity have to be determined by analysis. In this thesis, we focus on the optimal buffer allocation problem. We try to maximize the throughput of the serial production line by allocating the total fixed number of buffer slots among the buffer locations and in order to achieve this aim we introduced a new heuristic algorithm called “Line Balancing Algorithm (LIBA)”applicable to all types of production lines meaning that there is no restriction for the distributions of processing, failure and repair times of any machine, the disciplines such as blocking, failure etc. and the assumptions during the application of LIBA in the line.
ii
ÜRETİM HATLARINDA
OPTİMAL ARA DEPO PAYLAŞTIRIMI İÇİN
HAT DENGELEME ALGORİTMASI
Ömer Selvi
Endüstri Mühendisliği Bölümü Yüksek Lisans
Tez Yöneticisi: Yar. Doç. Murat Fadıloğlu
Eylül, 2002
Üretim Hatlarında ara depo paylaştırımı günümüz endüstrisinde genellikle karşılaşılan önemli bir problemdir. Ara depoların üretim hattında etkili kullanımı yani ara depoların hangi miktarda ve nereye yerleştirileceği önemlidir çünkü ara depoların üretim hatlarının verimliliğinde büyük etkisi vardır. Ara depolar kendisinin önündeki ve kendisini takip eden istasyonun tıkanma ve aç kalma sıklıklarını azaltır. Ama direkt maliyetinden ve ara ürün miktarındaki artışa neden olmasından dolayı ara depo kullanımı pahalı bir yatırımdır. Bu yüzden, performans ve maliyet arasında endirekt bir ilişki vardır. Bu, optimal ara depo gereksinim miktarı ve bu miktarın paylaştırımı analiz ile belirlenmeli anlamına gelir. Bu çalışmada, optimal ara depo paylaştırım problemi üzerinde odaklanılmıştır. Toplam sabit ara depo miktarını mevcut ara depo lokasyonları arasında paylaştırımı yoluyla seri üretim hattının birim üretim miktarı maksimize edilmeye çalışılmış ve bu amaca ulaşmak için istasyonların işleme,bozulum ve onarım zamanları dağılımı, blokaj, bozulum vs. disiplini ve hattın varsayımları ne olursa olsun her türlü üretim hattına tatbik edilebilir “Hat Dengeleme Algoritması” adlı sezgisel bir algoritma geliştirilmiştir.
Anahtar Sözcükler: Seri Üretim Hatları, Ara Depo, Optimal Ara Depo Payalaştırım
iii
Acknowledgement
I would like to express my gratitude to Asst. Prof. Murat Fadıloğlu for his supervision, suggestions and encouragement throughout the development of this thesis.
I am also indepted to Prof. İhsan Sabuncuoğlu and Prof. Erdal Erel for accepting to read and review this thesis and for their suggestions.
I would like to take this opportunity to thank Onur Boyabatlı, Çerağ Pinçe, Güneş Erdoğan, Savaş Çevik, Sezgin Işılak, Burhan Ürek, Ozan Pembe, Aydın Özçelik and Gökhan Çevik for their friendships, helps, morale supports and encouragements during my graduate life in Bilkent. I would also like to express my gratitude to Avni Sezer, Osman Sarıçam, Naci Yılmaz for their friendships.
My special thanks go to my family. This study is dedicated to them without whom it would not have been possible.
iv
Contents
Abstract i
Özet ii
Acknowledgement iii
Contents iv
List of Tables vi
List of Figures vii
List of Charts viii
1. INTRODUCTION………...1
2. BACKGROUND……….3
2. 1. Major Features and Classes of Production Lines……….3
2. 2. General Results Pertaining to Production Rate of a Production Line………6
2. 2. 1. Buffer Issues……….6
2. 2. 2. Reversibility and Duality………..8
3. LITERATURE SURVEY………10
4. TWO RELATED ALGORITHMS...……….26
4. 1. Standard and Non-Standard Exchange Vector Algorithms (SEVA and Non-SEVA)………..26
4. 1. 1. Standard Exchange Vector Algorithm (SEVA)………..29
4. 1. 2. Non-Standard Exchange Vector Algorithm (Non- SEVA)………31
v
5. 2. The Algorithm………...43
5. 2. 1. Initial Allocation Procedure………47
5. 2. 2. A Simple Example for Line Balancing Algorithm (LIBA)………52
5. 3. Comparison of Algorithms……….60
5. 3. 1. Numerical Results………...62
6. CONCLUSION……….71
BIBLIOGRAPHY………...75
APPENDIX………80
A. 1. The Pseudo-Code of LIBA………..………...80
A.2. General model frame for the simulation of the production lines in SIMAN V………...86
A.3. Experimental frame of the production line given in Seong et.al.[35] as Case 9 for the simulation in SIMAN V………....89
A.4. Behaviour of throughput with respect to total imbalance………..90
A.5. Throughput values for all feasible allocations in the sample problem given as Case 9 in Seong et. al.[35]………... ……….91
A.6. Processing, failure and repair rates for production lines in Seong et.al.[35]………...92
A.7. Optimal allocations with estimated throughput values via simulation for SEVA, Non-SEVA and LIBA………...………93
A.8. Efficiency evaluation of initial allocation procedure of LIBA………...94
vi
List of Tables
3. 1. Summary of Literature Survey………..25
5. 1. Processing, failure and repair rates for each machine ………..52
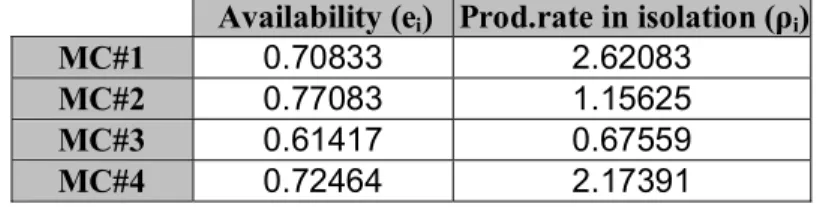
5. 2. Availabilities and production rates in isolation for all machines ………….…52
5. 3. Initial buffer allocation where bi = 1/(ρi+ρi+1) ………...53
5. 4. Initial buffer allocation where bi =1 / min{ρi , ρi+1}………...…53
5. 5. Initial buffer allocation where bi = (1/ρi ) + (1/ρi+1) ………...………53
5.6. Throughput values and related computations for the candidate initials……….……… 56
5.7. Throughput values and differences for two initial allocation alternatives for each replication………....56
5.8. Throughput values and efficiency of initial allocations determined by LIBA initial allocation procedure ………...………63
5. 9. Step sizes for the cases studied ………...……….64
5. 10. Increase in the throughput value in LIBA 2 ………..………67
5. 11. Increase in the throughput value in LIBA 1 ………..……….67
5. 12. Data of the cases that we study in Powell and Harris[33]………. 69
5. 13. Optimal allocations with estimated throughput values via simulation for SSA and LIBA ………...………..69
A.4. Behaviour of throughput with respect to total imbalance ………90
A.5. Throughput values for all feasible allocations in the sample problem given as Case 9 in Seong et. al.[35] ………...91
A.6. Processing, failure and repair rates for production lines in Seong et.al.[35]....92
A.7. Optimal allocations with estimated throughput values via simulation for SEVA, Non-SEVA and LIBA ………93
vii
List of Figures
1. 1. The N-machine production line ……….1
4. 1. The illustration of SEVA ……….30
4. 2. The procedure how to obtain non-standard integer exchange vector approximating the gradient vector in Non-SEVA ………..31
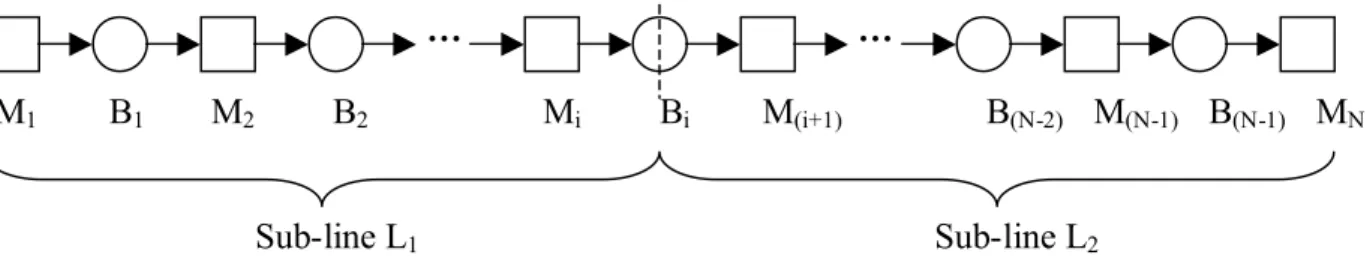
5. 1. The N-machine production line L ………40
5. 2. Two sub-lines L1 , L2 obtained by decoupling L from the buffer i …………40
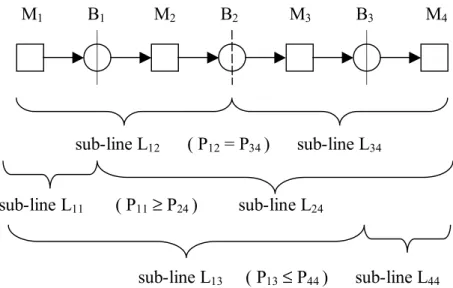
5. 3. Illustration of the property of imbalance around any other buffer locations even though the exact balance around any specific one in production lines...42
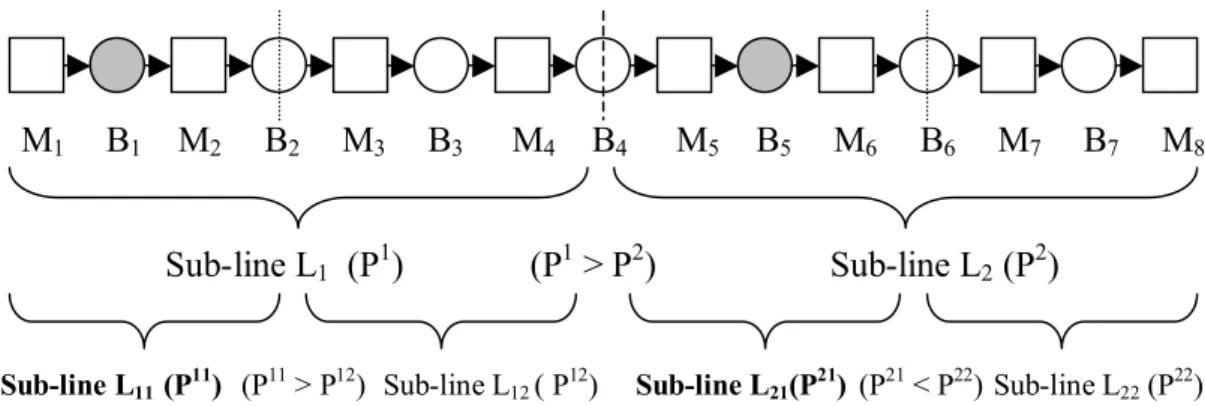
5. 4. Bisection procedure for determination of potential giver and receiver……....43
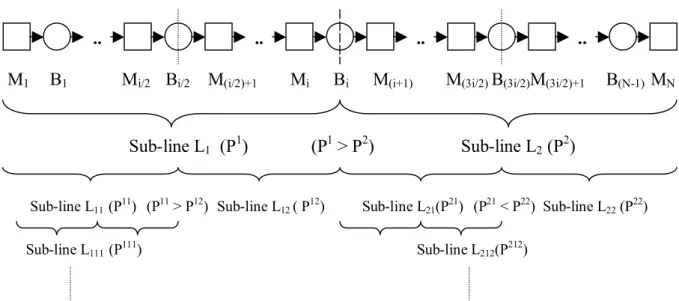
5. 5. Bisection of 8-machine production line until its final sub-lines………...44
5. 6. Illustration of determination of criticality function ………...…. 49
5. 7. Initial decomposition of the line during the execution of LIBA ………. 57
5. 8. Restart of LIBA from the second buffer location B2 ………….………..58
5. 9. LIBA proceeds to the first buffer location ………...59
viii
List of Charts
1
Chapter 1
INTRODUCTION
Production lines, also called manufacturing flow lines, transfer lines, flow lines or serial production lines, have been an important area of research ever since 1950’s. Since flow lines can often be found throughout manufacturing industry (e.g. automobile industry), many researches have recognized the importance of the subject and contributed to it.
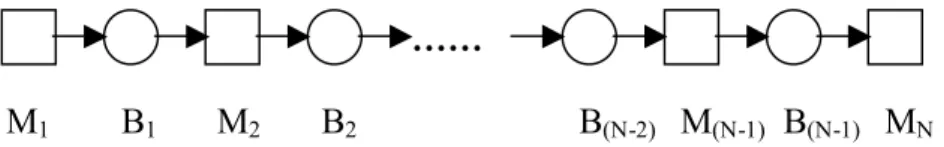
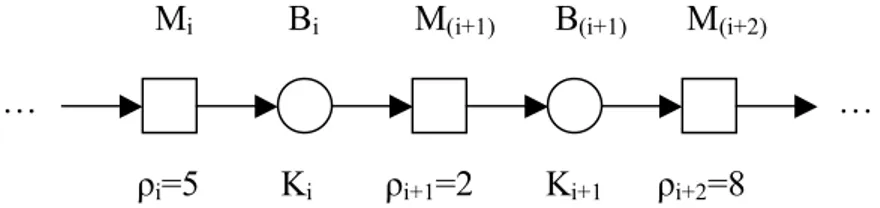
Let us first define manufacturing flow lines briefly. Manufacturing flow line systems consist of material, work areas, and storage areas. Material flows from work area to storage area, from storage area to the proceeding work area and so on. Material visits each storage and work area. There is an entry work area through which material enters and an exit work area through which it leaves the system. The work areas are usually called machines or stations and the storage areas are usually called buffers. Figure 1.1 illustrates an N-machine production line where Mi’s stand for machines and Bi’s are buffers.
……
M1 B1 M2 B2 B(N-2) M(N-1) B(N-1) MN Figure 1. 1. The N-machine production line
Due to their diversity, complexity and inherent randomness in their behaviour, modelling and estimating the performances of manufacturing flow lines are difficult. Especially, the randomness inherent in production lines is what makes manufacturing flow lines difficult to analyze. The primary source of randomness is that the times parts spend in work areas are not deterministic. This randomness may be due to random processing times, random failure and repair events that occur on the stations, or both.
In serial production lines, one of the key questions that the designers face is the buffer allocation problem, i.e., how much buffer storage to allow and where to place it in the line. This is an important question since buffers can have a great impact on the efficiency of the production line. They reduce blocking in the upstream stations and the starvation in the downstream stations. Unfortunately, buffer storage is expensive both due to its direct cost and the increase of the work-in-process inventories it causes. Because of the trade-off between the performance and the cost, determination of the total buffer capacity and the allocation of the buffer capacities is an important problem.
The problem can be formulated in many different ways depending on the choice of the objective function. Objectives used in the literature are basically maximizing throughput, minimizing work-in-process, minimizing sojourn time and minimizing cost or maximizing profit based on the user defined cost or profit functions. In this thesis, we study the classical problem, which is known as “Optimal Buffer Allocation Problem (OBAP)” with the objective of maximizing production rate. We focus on the allocation of total fixed number of buffer slots among the buffer locations for the optimal production rate of the production line.
In the second chapter of our study, we give a brief background of the production lines. We provide a review of related research in the literature in Chapter 3. In Chapter 4, we present two related algorithms on the allocation of total fixed number of buffer slots for maximizing throughput and compare these algorithms in Chapter 5 where we also develop a heuristic algorithm. Finally, concluding remarks are made in Chapter 6.
3
Chapter 2
BACKGROUND
2. 1. Major Features and Classes of Production Lines
There are three major classes of manufacturing flow lines. These are;
1. Asynchronous Systems 2. Synchronous Systems 3. Continuous Systems
Asynchronous and synchronous systems are suitable for the manufacturing of discrete parts. The only difference between them is that all the operations and machine state changes in the line occur simultaneously as well as buffer levels in the synchronous systems. In asynchronous systems, the machines are not forced to start or stop their operations at the same instant. Even when machines have fixed, equal operation times, the presence of buffers between them allows them to start and stop independently, as long as the intermediate buffers are neither empty nor full. In some applications, the operation times may be random. Finally, uncertain failure and repair times can lead the unsynchronized operation times. Unlike asynchronous systems, in synchronous systems, all machines are forced to start and stop their operations at the same time.
The feature distinguishes continuous systems from the others is that the material is treated as continuous rather than discrete. That is, instead of discrete parts moving from buffer to machine and vice versa at specific instants, there is a fluid that is transferred continuously. Continuous systems are naturally the production systems in which the material processed is a fluid rather than discrete entities (e.g. chemical processing).
A machine is said blocked if the processed part on it cannot be put to the downstream buffer and starving if it is idle and there is no part to be processed in the upstream buffer. The function of a buffer is to decouple machines. If a machine is subject to a disruption (a failure or a long operation time), the machine upstream can still operate until the upstream buffer fills up and the machine downstream can still operate until the downstream buffer becomes empty. The larger the buffers of the line, the longer before the filling or emptying occur, and the larger is the production rate. Pairs of machines that have no storage space between them have the greatest coupling; and infinite buffers, or storage areas that are never filled, have the least (Infinite buffers allow coupling when they become empty).
In real life, since all buffers have finite capacity, blocking may occur. There are two types of blocking;
1. Blocking After Service (BAS) 2. Blocking Before Service (BBS)
BAS, also called type-1 blocking, manufacturing blocking, production blocking, transfer blocking or non-immediate blocking, occurs at the instant of completion of a part on the machine, if downstream buffer is full. In that case, the part stays on the machine until a space is available in the downstream buffer. During this time, the machine is prevented from working and it is said to be blocked. When a space becomes available in the downstream buffer, the part is immediately transferred to the downstream buffer and the machine can start processing another part, if any.
In BBS, also called type-2 blocking, communication blocking, service blocking or immediate blocking, machine can start processing only if there is a space available in the downstream buffer. Otherwise, it has to wait until a space becomes available. BBS is further classified according to whether the position (space) on the machine may be
occupied or not while the machine is blocked. These two cases are Blocking Before Service with Position Occupied (BBS-PO) if the space on the machine is used during the blockage, and Blocking Before Service with Position Non-Occupied (BBS-PNO) if the space on the machine is not used during the blockage.
In some systems, machines are prone to failures. In the literature, generally two types of failures are considered. These are;
1. Operation Dependent Failures (ODFs) 2. Time Dependent Failures (TDFs)
ODFs are failures that are related to the processing of parts and thus can only occur when the machine is working. The machine is working means that the machine is up (operational) and it is not idle. On the other hand, TDFs are not related to the processing of part and thus can occur at any time, including the time when the machine is idle.
When failure occurs, the machine cannot process any material, so the upstream buffer cannot lose material and the downstream buffer cannot gain material. Systems in which machines can fail are called Flow Lines with Unreliable Machines (FLUMs) and systems in which machines do not fail are called Flow Lines with Reliable Machines (FLRMs). In FLRMs, all the randomness is due to the variability of the processing times, while, in FLUMs, randomness is due to both varying processing times and failures.
Material arrives at and leaves from the flow line in a variety of different ways. It is always possible for raw material to be unavailable, or removal of finished goods may be delayed in real life. Such systems are non-saturated systems. On the other hand, in the literature, it is almost always assumed that the first machine is never starved and the last is never blocked. Such systems are called saturated systems. However, it is possible to model a non-saturated system with a saturated system by adding a non-starving initial machine as the arrival process and a final machine that is never blocked (means it has infinite capacity downstream buffer) as the departure process to the line. Hence, the second machine of the model corresponds to the first machine of the real system and the machine just before the last machine of the model corresponds to the last machine of the real system.
2. 2. General Results Pertaining to Production Rate of a
Production Line
Several measures of performance are of interest when analyzing flow lines. The most important one is the production rate, P, which is the average number of parts leaving the system per unit time.
The production rate of a line is limited in two ways. First, the throughput can be no greater than that of the machine with the smallest isolated production rate. The isolated production rate of a machine is the rate that it would operate at if it were not in a system with other machines and buffers. When the machines have different isolated production rates, their capacities except the lowest are largely wasted. Second, the unsynchronized disruptions that cause buffers to be empty or full also waste machine capability. Buffers become empty or full because machines fail or take long time to process material at different times. If all machines could be perfectly synchronized, not only in performing operations, but also in failing and getting repaired, buffers would not affect flow. It is the lack of synchronization that causes machines to be starved or blocked, and thus to lose the opportunity to work.
A fundamental relationship of flow lines is the conservation of flow which states that all machines have the same production rates, that is
P1 = P2 = ….. = PN = P.
Conservation of flow holds for FLRMs and also for FLUMs provided that there is no scrapping of parts. Conservation of flow can be established by using sample path approach. The sample path behaviour of any flow line can be described by means of recursive equations. These equations are defined as the evolution equations of the flow line.
2. 2. 1. Buffer Issues
The production rate increases monotonically as the buffer capacities increase. This is monotonicity property. Consider two flow lines, L1 and L2, which have identical machines but with different buffer capacity vectors K1 and K2. The capacity of each
buffer in L2 is at least as large as the corresponding buffer in L1. That is, K1 ≤ K2. Then the production rate of the flow line satisfies
P(K1) ≤ P(K2).
The production rate of a flow line in which one buffer is infinite can be obtained by decomposing the line into two sub-lines from this infinite capacity buffer. Let La be the part of line L that consists only of the first i machines and the first (i – 1) buffers and similarly let Lb be the part of line L that consists only of the last (N - i) machines and the last (N - i - 1) buffers where the buffer location Bi has infinite capacity. Let Pa and Pb be the production rates of lines La and Lb respectively. Then, the production rate, Pinf , of the line with the infinite buffer is
Pinf = min(Pa , Pb).
By combining the above result with the monotonicity property, we obtain the following upper bound for the production rate of the line where there is no infinite capacity buffer:
P ≤ min(Pa , Pb)
By applying this decomposition several times, we see that the production rate of a flow line is bounded by the isolated production rate of the machine that has the smallest isolated production rate as given below:
P ≤ min( ρi ) i = 1 to N
Tighter upper bound on the production rate of the original line can be derived from the decomposition approach and given as
P ≤ min(Pi,i+1) i = 1 to (N-1)
where Pi,i+1 is the production rate of the two-machine flow line consisting of Mi, Bi , Mi+1 .
This upper bound can be useful since the production rates of the two-machine flow lines can be calculated exactly in most cases.
The monotonicity property can also be used to obtain the following lower bound on the production rate of the original line:
P0 ≤ P
where P0 is the production rate of the flow line with no intermediate storage.
2. 2. 2. Reversibility and Duality
Consider a flow line Lr, which is obtained from flow line L by reversing the flow of parts. The first machine in Lr is the same as the last machine in L. More generally, Mi in line Lr is the same as MN-i+1 in line L. Also buffers are reversed in line Lr. Then the production rate of the reversed line Lr is the same as the production rate of original line L if both lines’ blocking mechanism is BAS. This is reversibility property. Proof of this property is based on the comparison of the sample paths of the two systems again using the evolution equations.
Consider now the case of BBS. In that case, there is a much stronger equivalence between the two systems (Lr and L). This equivalence is based on the concept of job/hole (or part/hole) duality. The idea is that in line L, whenever a part moves in one direction, a hole (empty space) moves in the other direction. In the case of BBS, it is easy to check that the behaviour of parts in the reversed system is the same as the behaviour of holes in the original system. Indeed, starvation in the reversed system corresponds to blocking in the original system and vice-versa. As a result, the state distribution of parts in the reversed line is exactly the same as the steady-state distribution of holes in the original line. This equivalence especially implies that these two systems have the same production rate.
The concept of job/hole duality still makes sense in the case of BAS. However, the behaviour of parts in the reversed system is no longer the same as the behaviour of holes in the original system.
In this chapter we give the brief background of the production lines. It is worth to give this background since all researches on the production lines in the literature use any of these classes and features of production lines as the framework while modelling them and introduce new derivations by basically using the general results pertaining to
flow lines. Therefore, the content of this chapter will help the reader understand the next chapter easily where we will introduce the researches on production lines in the literature.
10
Chapter 3
LITERATURE SURVEY
Over the years, a large amount of research has been devoted to the analysis of production lines. This body of research can be classified as evaluative and generative. Evaluative studies focused on the performance evaluation of the production lines such as production rate, average WIP and average sojourn time in the system. Generative studies dealt with the optimization of these performance measures of the production lines. Since there is vast amount of work on production lines, we will only deal with the ones that are directly related to our problem, buffer allocation. However, the review of production lines written by Gershwin and Dallery[8] can be given as a guide to the readers who are interested in finding about evaluative studies.
In serial production lines, one of the key questions that the designers face is the buffer allocation problem, i.e., how much buffer storage to allow and where to place it in the line. This is an important question because buffers can have a great impact on the efficiency of the production line. They compensate blocking of the upstream stations and the starvation of the downstream stations. Unfortunately, buffer storage is expensive both due to its direct cost and the increase of the work-in-process inventories it causes. Therefore, there is a trade-off between performance and cost. Thus, the
determination of buffer capacity requirement and the allocation of the buffer capacities is an important issue.
While solving the buffer allocation problem, determination of the objective and the assumptions of the models that are worked on are also important for some reasons such as the tractability, fidelity to reality etc. Objectives that were used in the literature are basically maximizing throughput, minimizing work-in-process, minimizing sojourn time and minimizing cost or maximizing profit based on the user defined cost or profit functions. Minimization of WIP and average sojourn time are positively correlated, meaning that minimization of one produces the minimization of the other, while these objectives are negatively correlated with the objective of maximizing throughput. There are also multi-objective studies aiming to achieve two or more objectives, which were stated above, at the same time. You can see various studies with these objectives in the proceeding section. Unless otherwise stated, all proceeding researches used the basic assumption stated below due to simplicity and tractability;
1. The first machine is never starved and the last machine is never blocked
(Saturated Systems).
2. All random variables (processing times, uptimes, downtimes) are
independent random variables.
3. The transfer through the buffers takes zero time.
4. Manufacturing blocking (BAS) is the blocking criterion, meaning that any
machine can pass the completed part as long as a buffer space is available (or, when no buffer exists, the downstream machine is idle).
5. Failures are operation dependent failures (ODFs) meaning that any machine
can fail only when it is processing a part. In other words, a machine can not fail when it is idle (starved or blocked).
6. When a failure occurs, the part stays on the machine; it can be reworked
when the machine is up again; the work resumes exactly at the point it stops(no scrapping of parts)
Conway et al.[5] analyzed both balanced and unbalanced serial lines with stations having uniform and exponential processing times via simulation and reported a number of useful generalizations about the effect of buffers on serial lines. These can be summarized as follows:
• Diminishing returns: Throughput increases at a decreasing rate when
successive buffer are placed at a single buffer site, or when successive sets of buffers are placed at all sites.
• Non-concavity: Throughput increases in a non-concave fashion when
successive buffers are placed optimally.
• Sufficiency of small numbers: For lines with low coefficient of variations,
small numbers of buffers at each site are sufficient to recover most of the throughput lost to stochastic interference.
• Bowl-phenomenon: Buffers should be allocated evenly to all sites if
possible, with any remaining buffers allocated symmetrically around the centre of the line.
• Reversibility principle: Any line has the same throughput as its mirror
image.
• Decomposition principle: A single buffer should be placed where an
unlimited buffer would be most effective.
• Built-up property: The optimal allocation of (n+1) buffers can be built upon
the optimal allocation of n without moving any of the first n.
Anderson and Moodie[2] analyzed the balanced production lines with normal and exponential operation times to estimate the coefficients for buffer locations that satisfies the optimal production cost modeled. Multi-product production lines with equal storage capacity for all buffer locations were considered. Anderson and Moodie derived mathematical expression for the operation cost of the line for both cases: normal and exponential service times, and developed minimum cost buffer models from these expressions. Transient behavior of the line was also considered in order to observe whether it is beneficial to control the buffer capacities during this period or not. However, it was observed that there was no cost advantage in controlling the inventory during the transient period.
In his study, Helber[12] defined the problem of buffer space allocation in production lines as an investment problem. A model was developed and solution techniques were described that could be used to determine buffer allocations that maximize the expected net present value of the investment, including machines, buffers and inventory. Several examples of flow lines as well as assembly / disassembly
systems and flow lines with rework loops were analyzed. Optimal buffer allocation was determined via gradient algorithm based on the assumption of concavity of the function of the expected net present value of the investment with respect to the buffer capacity vector. Basic result of this study was that as product quality in a system with a rework loop improves, an optimally designed system can receive more buffer spaces and may use more inventory.
A flow-shop type production line where the stations were subject to breakdown was studied by Altiok and Stidham[1]. The objective was to find the allocation of inter-stage buffer capacities that maximizes the total profit. The stations, which are modeled as single-server queuing systems, had completion time distribution of two-stage Coxian type. After a standard transformation to a phase-type state representation, the new system gave rise to a Markov chain. The balance equations for this chain were solved by successive approximations to find the steady-state probability distribution of the number of items at each station, once the buffer capacities were given. A search procedure has been employed to find the optimal buffer capacities.
Seong et al.[36] studied the same objective function as Altiok and Stidham[1] with general linear constraints on buffer sizes and continuous-type product assumption. Operation times were assumed to be deterministic and equal, while the repairs and failures were exponentially distributed. They solved the problem with a gradient projection algorithm.
While allocating the fixed total number of buffers among intermediate buffer locations optimally, Andijani and Anwarul[3] considered and investigated the trade-off between three conflicting objectives: maximizing the average throughput rate, minimizing the average WIP and minimizing the average system time. They used lines with three and four identical reliable machines with exponential and uniform service times. Stochastic system simulation was used to generate and construct an efficient set of buffer allocations which maximizes the average throughput rate and minimizes both the average WIP and the average system time. Based on these simulation results, Analytical Hierarchy Process (AHP) was utilized to identify the most preferred allocation. The objective of this process was to find, for the line, the best buffer allocation solution to the trade-off between the three conflicting objectives stated.
Papadopoulos et.al.[25] also tried to allocate the fixed-number of buffers, servers and fixed amount of workload at the same time as well as individually and in couples in order to maximize the throughput with minimum average WIP by using simulated annealing approach. Decision variables considered were the sizes of the buffers placed between successive workstations of the lines, the number of servers operating parallel allocated to each workstation and the amount of workload allocated to each workstation. The study was extended up to 60 stations with 120 buffer capacity and 120 servers, and it was observed that the approach worked very well compared with complete enumeration whenever possible as well as produced near-optimal configurations for relatively large lines in reasonable time.
So[38] studied the buffer allocation problem with the objective of minimizing the average work-in-process (WIP) subject to a minimum required throughput and a constraint on the total buffer space. Both the balanced and the unbalanced lines up to five reliable machines were considered in this study. Exponential and non-exponential (Erlang-2, Coxian etc.) operation times were assumed in balanced lines while only exponential operation times were taken into account in the unbalanced lines. So’s results showed that the optimal strategy of allocating buffer size for this problem exhibited a rather interesting pattern that was different from the buffer allocation problem of maximizing the throughput subject to a constraint on the total buffer space. Specifically, monotonically increasing allocations, where an increasing amount of buffer space is assigned toward the end of the line, were shown to be optimal for the most cases investigated. Furthermore, empirical results obtained in this study suggest that when the line is unbalanced, the slowest operations should be assigned to the beginning of the line to provide the best throughput and the average work-in-process trade-off. On the basis of these results, a good heuristic for selecting the optimal buffer allocations for minimization of work-in-process inventory while achieving minimum required throughput with constant total buffer space was developed.
Papadopoulos and Vidalis[28] worked on the same optimization problem, minimizing the work-in-process inventory while achieving the required throughput with constant total buffer capacity. However, they only focused on the short reliable balanced production lines with Erlang-k ( k ≥ 2 ) operation times. More specifically, they studied the average WIP and throughput for all the ordered buffer allocations of a certain total number of buffer slots among the intermediate buffer locations. The
vectors of the buffer allocations were classified systematically into equivalence classes, something that facilitated a lot in the analysis of the evolution of the average WIP and the throughput as a function of these ordered allocations. Papadopoulos and Vidalis’ results were very similar to the ones So[38] derived. According to these results, each buffer location takes at least as much buffer slot as the preceding one for the required throughput levels small relative to the theoretical maximum throughput that is attained when the buffer slots at hand are placed in order to maximize the throughput of the whole line. However, while the desired throughput level is increasing to the theoretical maximum level, buffer slots are transferred to the inner locations gradually resulting in well-known bowl phenomenon. Also a heuristic algorithm was proposed to find the optimal buffer allocation (OBA), which reduces the search space by 50% compared to enumeration in this study.
Another study on the OBA in order to minimize WIP by Kim and Lee[20] proposed an efficient heuristic algorithm. This algorithm named MNS (Modified Non-SEVA) is the modified version of the Non-SEVA algorithm (Non-Standard Exchange Vector Algorithm) which was originally proposed by Seong et al.[35] for the throughput maximization problem. However, since some useful structural properties such as monotonicity and concavity which hold for the throughput function and are the basic assumptions of the Non-SEVA algorithm, do not hold for the average WIP. Therefore, Kim and Lee used the results of Seong et al.[35] in order to obtain a initial solution which close to the global optimum. Kim and Lee worked on the unreliable production lines with up to ten machines. The failure rate, the repair rate and the production rate of each machine were obtained from the same uniform distributions. In order to compare the efficiency of MNS in the computational tests, also another heuristic, which was based on one buffer assignment at a time, was proposed called Simple Heuristic Algorithm (SHA) in this study. The two algorithms were compared with the solutions obtained by enumeration for short lines with up to 3 or 4 machines and compared against each other for longer lines with 8 and 10 machines where complete enumeration is inefficient. For all cases, MNS outperformed SHA in terms of average WIP levels with reasonable number of iterations. MNS also gave average WIP levels very close to the optimal solution achieved by enumeration for the cases where enumeration technique was used.
Papadopoulos and Vouros[29] presented a prototype model management system (MMS) for the design and operation of manufacturing systems. The model management system classifies different models according to the type of the manufacturing system to which they apply and according to the particular technique employed. The system comprises three different techniques, namely, analytical, simulation and artificial intelligence (AI) based techniques for production lines. The first two are evaluative methods, whereas the last one is a generative (optimization) method that solves the buffer allocation problem in a production line. Papadopoulos and Vouros studied on both balanced and unbalanced production lines with reliable stations having exponential operation times aiming to minimize average WIP by allocating fixed number of buffer capacity. First contribution of this work was that the development of a flexible MMS, which provides a simple and intelligible framework for classifying different, modeling techniques, enables the interaction among these models and does not restrict the developers to follow a particular model development task. Second one is the development of a knowledge based system, called Advisor System for Buffer Allocation (ASBA), which solves the buffer allocation problem in the production lines with very satisfactory results.
Papadopoulos and Vouros[30] also introduced ASBA2, a knowledge based system that solves the buffer allocation problem in production lines as an extension of ASBA. ASBA allocates buffer space in reliable both balanced and unbalanced production lines, aiming at reducing average WIP subject to a given total buffer space and a required throughput. However, ASBA2 aims to extend the functionality of ASBA to unreliable, balanced and unbalanced production lines and allocates the fixed total buffer space in order to achieve the objective of maximizing throughput. The results showed that ASBA2 allocates the buffers very close to the optimal ones in a computationally efficient way by using specific types of knowledge.
Hillier and So[15] also provided a study of the effect of machine breakdowns and inter-stage storage on the efficiency of production lines. Based on the results they obtained, Hillier and So developed a simple heuristic method to estimate the amount of storage space required to compensate for the decrease in throughput due to machine breakdowns. The study focused on four and five machine production lines with again operation times from two-stage Coxian distribution. Hillier and So used Coxian distribution for operation times due to useful interpretation of this distribution. Stage 1
can be interpreted as corresponding to the normal service for an item at a machine, whereas Stage 2 corresponds to downtime at the station for whatever reason (e.g. breakdown of the machine) that interrupts this service where the probability of having Stage 2 corresponds to the probability that the service is interrupted by down time. Therefore, their model can be used to study the effect of breakdowns on the allocation of storage space in a production line. First basic result of this study was that the throughput of the production line is inversely proportional to the coefficient of variation of the operation times meaning that increase in coefficient of variation will reduce the throughput of the line. Secondly, percentage increase in the throughput achieved by adding one extra unit of buffer space decreases as the buffer capacities increase. Lastly, while the throughput of a line depends heavily on the average amount of downtime during one service, the mean length of downtimes can affect the throughput significantly for fixed average amount of downtime during one service; smaller mean length of downtimes gives higher throughput than larger mean length of downtimes.
Yamashita and Altiok[41] were concerned with finding the minimum total buffer number required and its allocation for a desired throughput in both balanced and unbalanced production lines with three and five stations having phase-type processing times. One significant difference of this study from others was that the capacity of each buffer was assumed to be bounded above by a constant value, say Ci. They have
implemented a dynamic programming algorithm that uses a decomposition method to approximate the line throughput at every stage.
Lutz et. al.[21] addressed the problem of buffer location and the storage size in a manufacturing lines. The question was what buffer sizes should be employed and where the buffers should be located. Hence, the objectives of Lutz et.al. were to determine the minimum number of storage spaces needed and the allocation of these storage spaces among the buffers, so as to maximize the overall throughput of the line. To achieve these objectives, simulation-search heuristic procedure based on tabu search was developed. Simulation was used to model the manufacturing process and the tabu search was used to guide the search to overcome the problem of being trapped at local optimal solutions. The procedure employs a Swap Search routine and a Global Search routine. With the Swap Search routine, the procedure identifies good performing buffer profiles and determines the maximum output level for any given storage level. With the Global Search routine, the procedure can locate promising neighborhood of buffer
profiles quickly. The procedure is capable of modeling a variety of manufacturing processes with a variety of scheduling policies and dispatching rules.
Park[31] presented characteristics of the buffer design problem associated with the production lines and discussed some drawbacks related to the optimization methods thus far his study applied to the buffer allocation problem. An efficient two-phase heuristic method, using a dimension reduction strategy and a buffer utilization-based beam search method, was developed to minimize total buffer storage required while satisfying a desired throughput rate in unreliable balanced production lines with stations having deterministic processing times, and geometric failure and repair times. While Phase I attempts to accelerate the finding of an initial solution by reducing the combinatorial search dimension to one, Phase II reduces the total buffer storage required as much as possible while maintaining a desired throughput rate.
Gershwin and Schor [9] described efficient algorithms for determining how buffer space should be allocated in a flow line. They considered unreliable lines with deterministic operation times. Two problems were analyzed: a primal and a dual problem. The goal of the primal problem is to minimize total buffer space required for the line to meet or exceed a given average production rate, and the goal of dual problem is to maximize the production rate achievable with a given total buffer space. The dual problem is solved by means of a gradient method, and the primal problem is solved using the dual solution. It was also showed how buffer allocation problems with profit maximization objective could be solved by using essentially the same algorithms.
Sheskin[37] studied the allocation of buffer spaces in systems like Gershwin and Schor[9]: those with unreliable machines with equal deterministic processing times. In addition, he assumed time-dependent failures. A decomposition method was used to produce numerical results for small systems with small buffer capacities. These results led to some rules of thumb on the allocation of buffer spaces to maximize production rate.
Soyster et.al.[39] used the same model with Sheskin[37] to study the maximization of production rate subject to general linear inequality constraints on buffer sizes. They approximated the production rate for small systems and used an integer programming package to find optimal allocation of buffer spaces.
El-Rayah[6] attempted to study the effect of unequal allocation of fixed number buffer storage and the imbalance in the operation time variabilities on the throughput and average WIP. He simulated balanced lines in terms of mean operation times where operation times were assumed to be normal. In the first section of the study, he only investigated the effect of unequal buffer allocation on the output rate and average WIP of the lines up to four machines which were also CV-balanced (where all machines have same coefficient of variation). On the basis of simulation results for this section, El-Rayah concluded that the output rate of a production line where the buffer capacity is allocated equally cannot be significantly improved by deliberately unbalancing buffer allocation. However, if imbalance is unavoidable, throughput is maximized by assigning larger buffer capacities to the middle buffer locations and smaller capacities to the end buffer locations on the line. He also observed from the results of the first section that increasing order of buffer capacities encourages the reduction of average WIP significantly while affecting the throughput in the decreasing direction so this knowledge should be taken into account while the objective is to minimize WIP. In the second section of his study, El-Rayah investigated the effect of imbalance of operation time variabilities on the output rate of the balanced production lines in terms of mean operation times with no storage buffers and he observed that bowl phenomenon holds meaning that assigning stations with more variable operation times to the ends of the line while assigning the ones with less variable operation times to the middle of the line in order to maximize output rate.
Hillier and So[14] studied the effect of coefficient of variation of operation times on the optimal allocation of storage space in production lines. They worked on both µ-balanced and CV-balanced lines with operation times having two-stage Coxian type distributions and considered the throughput as the only performance measure. Their study showed that the optimal buffer allocation depends on the degree of variability in the operation times. Specifically, the results showed that the inverted bowl effect is more pronounced with higher variability in the operation times. Higher variability meaning increasing coefficient of variations generally increases the imbalance in the optimal allocation.
Powell[32] provided a detailed study of the unbalanced three-station serial lines with reliable stations having log-normal processing times with the objective of maximizing throughput. In this study, imbalances in both means and variances were
considered. The study established a rule, Alternation Rule, for buffer allocation in unbalanced lines. It was observed that the optimal sequential allocation of buffers to lines in which one station had a higher mean or variance was to place the first buffer next to the bottleneck, but then to place subsequent buffers alternately at the two available sites. In effect, this rule suggests that a balanced allocation is optimal unless the imbalance in processing times is extreme. Powell also observed that imbalances in means have stronger effect than imbalances in variances, so that when a line is unbalanced in both senses one can buffer the bottleneck with the high mean in preference to that with the high variance unless the imbalances are extreme.
Chow[4] pursued a simple and practical solution for the optimal allocation of buffers with the objective of maximizing throughput. He adopted an approach similar to that used in Anderson and Moodie[2] except that the operation times were not necessarily identical and the number of stations in the line could be arbitrary. At the end, Chow constructed a dynamic programming procedure for buffer design for optimal throughput which generates results that consolidates the bowl-phenomenon.
Yamashina and Okamura[42] dealt with the role of buffer stocks in multi-stage transfer lines by presenting computer simulation results. Lines with unreliable stations were investigated. Breakdown and repair times were assumed to have geometric distributions. It was also assumed that breakdown results in the destruction or damage of the production unit at the affected stage so that the production unit must be removed from the line as scrap. Yamashina and Okamura observed that bowl phenomenon, which was stated for balanced lines with reliable stations, also holds for the balanced lines with unreliable stations. They also obtained the result that uniform buffer storage capacity allocation does not guarantee the optimum allocation even for balanced identical lines, but this postulate may be accepted for balanced identical lines in the sense that the throughput for uniform capacity allocation does not differ very much from the throughput for optimum allocation. It was also shown that an N-stage line should be designed such that the lowest stage production rate occurs in the Nth stage, the second lowest in the first stage, the third lowest in the (N-1)th stage, the fourth lowest in the second stage and so on, to maximize the line throughput. This study also demonstrates that the total buffer capacity should be allocated such that the difference between the production rates of the stages on either side of a storage point is minimized
and the production rate of the stages before the storage point is slightly greater than that of the stages following the storage point.
Papadopoulos and Spinellis[23] described a simulated annealing approach for solving the buffer allocation problem with the objective of maximizing throughput for fixed amount of buffer slots in reliable production lines with exponential operation times. Performance of the simulated annealing approach was evaluated by comparing the results of it with the results of complete enumeration whenever practical for short lines and the results of the reduced enumeration which is widely used in literature for the cases of longer lines. Obtained throughput rates by the simulated annealing approach were quite close to the solutions obtained by complete and reduced enumerations. However, evaluated configurations in simulated annealing approach nearly did not change while asymptotically increasing in complete enumeration and reduced enumeration with respect to the increase in the total buffer slots that will be allocated among the buffer locations. For this reason, simulated annealing approach is superior over both enumerative techniques for the lines with large total buffer slots.
Papadopoulos and Spinellis[24] broaden their research[23] by also taking genetic algorithm into account near simulated annealing and obtained interesting results. Genetic algorithm showed similar properties to simulated annealing. However, it gave slightly worse throughput rates than simulated annealing approach with less evaluative configurations where the difference between the throughput rates decreased with the increasing total buffer capacity and line length. The most interesting result that makes genetic algorithm superior to simulated annealing was that the number of evaluative configurations for simulated annealing is increasing linearly but with significantly higher rate than the case of genetic algorithm with respect to the increase in the number of stations in the line.
Hillier et.al.[16] investigated the problem of the optimal allocation of fixed to total buffer capacity for maximizing the throughput of the whole line. They used enumeration on balanced lines with identical exponential service times. Their conclusion was that storage bowl phenomenon holds meaning that interior buffer locations are given preferential treatment (more buffer slots) over the end buffer locations. The other key conclusion of this study was the hypothesis that, when the total amount of storage space also is a decision variable, the overall optimal solution
commonly follows a storage bowl phenomenon whereby the allocation of buffer storage space fits an inverted buffer pattern meaning that optimal allocation would have one additional storage space at each of the internal buffer locations.
Hillier[13] investigated the hypothesis in Hillier et al.[16] with a simple cost model including a linear revenue function and a linear cost per buffer space. The objective was to maximize profit with the total buffer space being decision variable in this study. Hillier worked with balanced and unbalanced four- and five-stations production lines with a single bottleneck in terms of mean processing times. Exponential, Erlang-2 and Erlang-4 processing times were used. Hillier observed that inverted bowl phenomenon was typically optimal for balanced lines but shape became more and more pronounced with larger numbers of buffer spaces. However, in unbalanced lines the buffer space pattern deviates from the bowl pattern by reducing the number of buffer spaces in buffer locations that are not adjacent to the bottleneck station. Also it was stated that the processing time variability measured by coefficient of variation was shown to have very little impact on the pattern of buffer space allocation while the total number of buffer spaces was significantly affected by (being roughly proportional) coefficient of variation of processing times.
Ho et.al.[17] presented a design algorithm based on the gradient vector of the throughput with respect to the buffer sizes, and aiming to maximize throughput via allocation of fixed amount of buffer capacity in transfer lines. They studied the effect of allocating an additional buffer space at a certain location along the line and predicted the improvement in the production rate. Proceedingly, they introduced simulation-based gradient algorithm which solves the buffer allocation problem for unreliable lines having Markovian property effectively.
Gurkan[11] used simulation-based optimization, sample path optimization, to find the optimal buffer allocation in serial production lines where machines were subject to random breakdowns and repairs in contrast to deterministic operation times. Gurkan’s objective was to maximize throughput with given total buffer capacity but she used fluid-type single product instead of discrete-type. Gurkan decided to work with continuous type production line instead of discrete-type since continuous type line simulation are substantially faster than discrete type line simulations meaning considerable increase in computational efficiency, the approximations of discrete
product transfer lines via continuous product transfer lines are quite accurate and she interested in optimizing systems of large size. Obtained results showed that her method performed quite well even for very long lines.
Papadopoulos and Vidalis[26] dealt with the optimal fixed amount of buffer allocation problem with the objective of maximizing throughput in balanced production lines with reliable workstations having exponential or Erlang-k ( k = 2,3,4 ) processing times. They presented two basic design rules that were extracted for the optimal buffer allocation in these types of lines using enumeration and developed a search technique that gives the optimal buffer allocation very fast.
Papadopoulos and Vidalis[27] also investigated the optimal buffer allocation giving the maximum throughput in short (with 3,4,5,6 and 7 stations) production lines with unreliable stations balanced in mean processing times. Repair and failure times were assumed to be exponential whereas operation times were assumed to have Erlang-k ( Erlang-k = 1,2,4 and 8 ) distribution. They answered the critical questions such as the effect of the distribution of the service and repair times, the availability of the stations and the repair rates on the optimal buffer allocation and the throughput of these types of lines. Papadopoulos and Vidalis also confirmed the validity of reversibility property for unreliable lines in this work.
Powell and Pyke [34] studied the problem of buffering reliable serial lines with moderate variability and a single bottleneck in terms of processing time for the maximization of throughput. Processing times were assumed to have log-normal distribution. Their analysis showed that bottleneck station drew buffers toward itself, but the optimal allocation was dependent on the location and the severity of the bottleneck, as well as the number of buffers available. It was also observed that relatively large imbalances in mean processing times are required to shift the optimal buffer allocation away from an equal allocation and line length appeared to have a relatively small effect on the optimal allocation with a given bottleneck. Furthermore, in severely unbalanced lines, throughput appeared to be insensitive to the allocation of buffers. Based on these results, Powell and Pyke suggested that equal buffer allocations might be optimal except in severely unbalanced lines.
Jafari and Shanthikumar[19] also aimed to solve the problem of allocation of given total buffer storage with the objective of maximizing throughput subject to local buffer storage constraints (i.e. buffer slots no more than Ci could be assigned to the buffer location Bi) in transfer lines. They worked on the synchronized transfer lines with unreliable stations having geometric up- and down-times. It was also assumed that when station i breaks down, the part being processed by it is either scrapped with probability βi or it will be completed with probability 1- βi , at the end of the cycle where the station is repaired. Jafari and Shanthikumar presented a heuristic solution which was based on dynamic programming and an approximate procedure to compute the production rate of the transfer line and which was producing quite reasonable results.
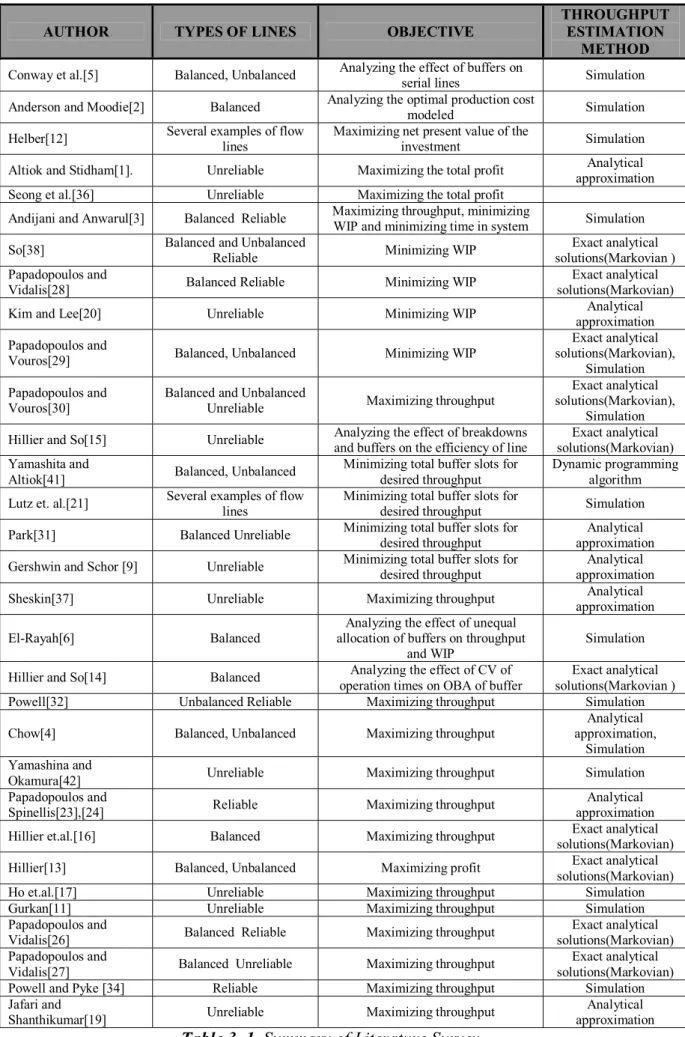
It is worth to conclude this chapter with summary of researches on the optimal buffer allocation in the literature. Below table named Table 3.1 gives the related researches with their objectives and types of lines on which they focus on briefly.
AUTHOR TYPES OF LINES OBJECTIVE THROUGHPUT ESTIMATION METHOD
Conway et al.[5] Balanced, Unbalanced Analyzing the effect of buffers on serial lines Simulation Anderson and Moodie[2] Balanced Analyzing the optimal production cost modeled Simulation Helber[12] Several examples of flow lines Maximizing net present value of the investment Simulation Altiok and Stidham[1]. Unreliable Maximizing the total profit approximation Analytical Seong et al.[36] Unreliable Maximizing the total profit
Andijani and Anwarul[3] Balanced Reliable Maximizing throughput, minimizing WIP and minimizing time in system Simulation So[38] Balanced and Unbalanced Reliable Minimizing WIP solutions(Markovian ) Exact analytical Papadopoulos and
Vidalis[28] Balanced Reliable Minimizing WIP solutions(Markovian) Exact analytical Kim and Lee[20] Unreliable Minimizing WIP approximation Analytical Papadopoulos and
Vouros[29] Balanced, Unbalanced Minimizing WIP
Exact analytical solutions(Markovian),
Simulation Papadopoulos and
Vouros[30]
Balanced and Unbalanced
Unreliable Maximizing throughput
Exact analytical solutions(Markovian),
Simulation Hillier and So[15] Unreliable Analyzing the effect of breakdowns and buffers on the efficiency of line solutions(Markovian) Exact analytical Yamashita and
Altiok[41] Balanced, Unbalanced
Minimizing total buffer slots for desired throughput
Dynamic programming algorithm Lutz et. al.[21] Several examples of flow lines Minimizing total buffer slots for desired throughput Simulation Park[31] Balanced Unreliable Minimizing total buffer slots for desired throughput approximation Analytical Gershwin and Schor [9] Unreliable Minimizing total buffer slots for desired throughput approximation Analytical Sheskin[37] Unreliable Maximizing throughput approximation Analytical
El-Rayah[6] Balanced allocation of buffers on throughput Analyzing the effect of unequal and WIP
Simulation
Hillier and So[14] Balanced Analyzing the effect of CV of operation times on OBA of buffer
Exact analytical solutions(Markovian ) Powell[32] Unbalanced Reliable Maximizing throughput Simulation Chow[4] Balanced, Unbalanced Maximizing throughput approximation, Analytical
Simulation Yamashina and
Okamura[42] Unreliable Maximizing throughput Simulation
Papadopoulos and
Spinellis[23],[24] Reliable Maximizing throughput
Analytical approximation Hillier et.al.[16] Balanced Maximizing throughput solutions(Markovian) Exact analytical Hillier[13] Balanced, Unbalanced Maximizing profit solutions(Markovian) Exact analytical
Ho et.al.[17] Unreliable Maximizing throughput Simulation
Gurkan[11] Unreliable Maximizing throughput Simulation
Papadopoulos and
Vidalis[26] Balanced Reliable Maximizing throughput solutions(Markovian) Exact analytical Papadopoulos and
Vidalis[27] Balanced Unreliable Maximizing throughput
Exact analytical solutions(Markovian) Powell and Pyke [34] Reliable Maximizing throughput Simulation Jafari and
Shanthikumar[19] Unreliable Maximizing throughput approximation Analytical
26
Chapter 4
TWO RELATED ALGORITHMS
Most of the studies, reviewed in the previous chapter, about the optimal buffer allocation in production lines with the objective of maximizing throughput do not solve the problem directly. Instead, some generalizations and intuitive ideas about the characteristic of the optimal buffer allocation or the effects of some parameters (i.e. repair rate, failure rate etc.) on it are introduced. On the other hand, the ones that solve the optimal buffer allocation problem are not applicable to all types of production lines. These types of studies focus on the specific production lines (i.e. balanced lines) or production lines with special features such as reliable machines etc. However, on the contrary to these studies, Seong et.al.[35] and Powell and Harris [33] introduced new heuristic algorithms applicable to all types of production lines.
4. 1. Standard and Non-Standard Exchange Vector
Algorithms (SEVA and Non-SEVA)
Seong et al.[35] worked on unbalanced lines with unreliable machines having exponential failure and repair times whereas operation times are deterministic or exponential with different rates. They focused on the optimal buffer allocation problem (OBAP) with the objective of maximizing throughput with the concavity assumption of
objective function. In their study, OBAP, a non-linear integer-programming problem, is presented as below mathematical structure;
OBAP: max E(K) K
s.t. eTK = C
Kj is a non-negative integer
where E(K) is the throughput with K, e is a unit column vector,
K is a buffer allocation ( = ( K1 , …….. , K(N-1) )T ), and
C is the fixed total buffer capacity available.
Two different versions of the heuristic algorithm for solving OBAP based on the idea of the local search are presented in this study. Namely, first of all, it is needed to define a specific neighborhood with respect to a given solution. The best solution in this defined neighborhood is determined and becomes the next solution. This process is repeated until no better solution is found. The process of defining the specific neighborhood is called the line segment selection and the process of finding and moving to the best solution in the neighborhood is called the point search.
The line segment selection yields a line segment L which is specified by two integer vectors L1, L2 and two integer parameters θ1 and θ2 ( θ1 < θ2 ) as below:
L ( L1, L2 , θ1 , θ2 ) = { L | L = L1+ θL2 , θ = θ1 , θ1 + 1, … , θ2 }
where L1, L2 , θ1 and θ2 are selected in such a way that all points in the set L ( L1, L2 , θ1 , θ2 ) are within the feasible region.
In the point search, an optimization problem given below is solved: max E(L)
s.t. L in L ( L1, L2 , θ1 , θ2 ) which is denoted by PS( E: L1, L2 , θ1 , θ2 ).
At this point, it is worthwhile to explain the point search and the line segment selection in more detail:
The point search is a process of finding the best integer solution among a set of integer solutions defined on a straight line. In PS( E: L1, L2 , θ1 , θ2 ), there are (θ2 - θ1 + 1) integer vector points in L. If (θ2 - θ1 + 1) is less than or equal to 4, objective function is evaluated at each point and the optimum solution can be obtained. However, if (θ2 -
θ1 + 1) is greater than 4, solving this problem becomes equivalent to finding an interval containing 4 consecutive integer vector points defined by an integer value θ* satisfying the following conditions:
E ( L1 + θ*L2 ) ≤ E ( L1 + (θ* + 1)L2 ) E ( L1 + (θ* + 2)L2 ) ≥ E ( L1 + (θ* + 3)L2 )
Such an interval can be found in O(log M) time where M ( = θ2 - θ1 + 1 ) is the number of integer vector points on the line segment L by using modified bisecting method. Optimum solution is among the one ( L1 + (θ* + 1)L2 ) , ( L1 + (θ* + 2)L2 ) with higher objective value of E(L).
Throughout the algorithm, since the sum of the components of each solution is equal due to the fixed amount of total given buffer slots, moving from one solution to the other can be considered as the movement along an integer directional vector h whose entries sum up to zero meaning that eTh = 0. Such vector is defined as “exchange vector”. If a certain exchange vector yields the better production rate, it is called “improving exchange vector”. Hence, the line segment selection can be thought of as a process of choosing a line segment along an improving exchange vector.
Two propositions are presented below that are necessary to develop heuristic algorithms, which differ only in the line segment selection procedure and that are based on the interesting properties of the feasible region K which is given as
K = {K | eTK = C, K ≥ 0 , K Є R(N-1), Kj integer for all j = 1, … , (N-1)}.
Proposition I: For an arbitrary pair of points K1 and K2 in the set K, K2 – K1 can be represented as a unique integer linear combination of vectors {X 1 , … , X (N-2)} defined as
1 if j = i i
j
X = -1 if j = i + 1 for all i = 1, … , (N-2). 0 otherwise
Proposition II: The vector Z satisfies eTZ = 0, if and only if Z is a linear combination of vectors {X 1 , … , X (N-2) }.
X i is called “standard exchange vector” since it represents an exchange between two adjacent buffers, i.e. ith and (i+1)th buffers.
4. 1. 1. Standard Exchange Vector Algorithm (SEVA)
Proposition I gives the basis for setting up a line segment selection procedure used for developing the first algorithm, Standard Exchange Vector Algorithm (SEVA). The basic derivation from Proposition I is the simple fact that all possible exchanges among the buffers can be represented as a unique linear combination of standard exchange vectors. In other words, any exchange among buffer allocations can be achieved by a set of exchanges between adjacent pairs of buffers. This idea is used for developing SEVA.
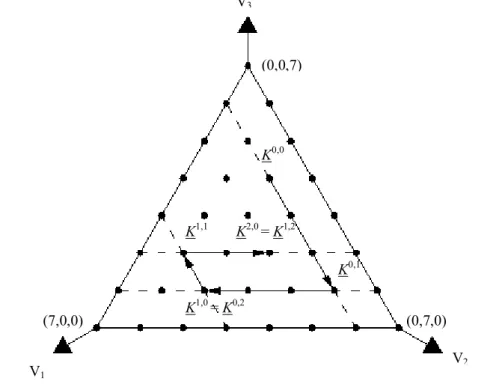
In the Figure 4.1, it can be seen how SEVA proceeds for 4-machine production line with three buffer locations where totally seven buffer slots will be allocated. The initial solution is K 0,0 (= K 0). At this point, two point search procedures are performed, generating K 0,1 and K 0,2. Then K 0,2 is assigned to K 1(= K 1,0) and again two more point search procedure is applied, yielding K 1,1 and K 1,2 where K 1,2 is set to the third point K 2 (= K 2,0) and the algorithm proceeds.