Nanotechnology
Low-amplitude, force gradient imaging of Cu(100)
surface using tunnel current feedback
To cite this article: H Ö Özer et al 2004 Nanotechnology 15 S5
View the article online for updates and enhancements.
Related content
Atomic force microscopy and spectroscopy Yongho Seo and Wonho Jhe
-Theoretical modelling of STM, STS and AFM
D Drakova
-Water distribution at solid/liquid interfaces visualized by frequency modulation atomic force microscopy
Takeshi Fukuma
-Recent citations
Atomic resolution force imaging through the static deflection of the cantilever in simultaneous Scanning Tunneling/Atomic Force Microscopy
H. Özgür Özer
-Simultaneous Measurement of Multiple Independent Atomic-Scale Interactions Using Scanning Probe Microscopy: Data Interpretation and the Effect of Cross-Talk Mehmet Z. Baykara et al
-Measurement of shear strength for HOPG with scanning tunneling microscopy by thermal excitation method
X.D. Ding et al
Nanotechnology 15 (2004) S5–S8 PII: S0957-4484(04)68566-7
Low-amplitude, force gradient imaging of
Cu(100) surface using tunnel current
feedback
H ¨
O ¨
Ozer
1,2,5, A Norris
2, A Oral
3, P M Hoffmann
4and J B Pethica
1,21Department of Materials, Parks Road, Oxford OX1 3PH, UK
2SFI Trinity Nanoscience Laboratory, Trinity College Dublin, Dublin 2, Republic of Ireland 3Department of Physics, Bilkent University, Ankara, 06800, Turkey
4Department of Physics, Wayne State University, Detroit, MI 48201, USA
E-mail: [email protected]
Received 8 September 2003, in final form 30 October 2003 Published 3 December 2003
Online at stacks.iop.org/Nano/15/S5 (DOI: 10.1088/0957-4484/15/2/002)
Abstract
The large corrugation amplitudes in scanning tunnelling microscope (STM) images of metal surfaces have been commonly attributed to the action of forces between the tip and the sample. We have investigated the Cu(100) surface using a high-resolution non-contact atomic force
microscope/scanning tunnelling microscope (nc-AFM/STM) in UHV. Force gradient and STM topography images were acquired simultaneously using constant tunnelling current feedback. Force gradient images showed atomic resolution whereas STM scans exhibited almost no contrast, corresponding to a flat tip trajectory during scans. The corrugation height in force gradient images was found to increase as the set tunnelling current was increased. Force gradient and tunnel current were directly measured as a function of separation, to determine the operating conditions during imaging. The STM operation regime is found to lie between the minimum of the stiffness curve and the start of repulsive force.
1. Introduction
The standard model for STM contrast formation [1] predicts that the contrast corrugations in images of close-packed metal surfaces should be very small, reflecting their almost flat surface LDOS. This is indeed observed in some reports [2]. However, STM images of close-packed metal surfaces often also reveal unexpectedly large corrugation amplitudes [3, 4]. These have commonly been attributed to the presence of tip induced effects [5]. It has been suggested that large corrugations have to be explained by either resonant tunnelling or elastic deformation due to force interactions [6].
D¨urig et al [7] reported the influence of forces between tip and sample during tunnelling. They used an Ag coated cantilever beam as the sample and measured force/force gradient interaction between the Ag sample and W tip using the tunnel current as the deflection sensor. Throughout a set of experiments with different STM settings, the force 5 Author to whom any correspondence should be addressed.
gradients measured were always positive, which suggested a relatively small tip–sample separation in contrast with the expected larger separations during STM imaging of metals. Clarke et al [8] pointed out the influence of forces in STM imaging of the Cu(100) surface. They gave a comparison of experimental data and molecular dynamics calculations, which supports the above suggestions. More recently Loppacher
et al [9] studied the distance dependence of the tip–sample
interaction in STM and AFM scans of the (100) and (111) surfaces of copper. They concluded that a close relationship exists between metallic adhesion force and tunnelling down to distances where true atomic resolution is achieved. Hofer et al [10] made simulations to calculate absolute distances during STM scans, accounting for the relaxation of the tip and sample atoms due to forces between them. For a W tip and Au(111) surface, a significant reduction of the tip–sample separation (2 Å in total) occurs when a separation of about 4.5 Å between the tip apex and top site on the surface is set. This reduction results in a considerable mismatch between the measured displacement of the sample piezo and the actual movement of
H ¨O ¨Ozer et al
(a) (b)
Figure 1. Simultaneous force gradient (a) and STM (b) images of
Cu(100). Image size is 28× 28 Å2. V
tip= 20 mV, IT = 9.1 nA, A0= 0.25 Å and k0= 55 N m−1. The black to white scale
corresponds to 59.5 N m−1(force gradient) and 1.72 Å (STM). The STM corrugation amplitude is<0.1 Å.
the tip, which in turn affects the STM measurement. They also calculated the force in the W–Cu system to have an attractive maximum of about 3 nN. In summary, although there is little corrugation in the LDOS and so the STM contours should be flat, it is found that for certain tip structures interaction forces can induce significant relaxations and greatly enhanced image corrugations. It is therefore desirable to measure the forces and their variation during STM imaging.
In the present work, we report force gradient images of the Cu(100) surface acquired with the tunnelling feedback to investigate STM imaging of metal surfaces. Atomic resolution is obtained in force gradient images where there is no contrast in STM topography. Force gradient and tunnel current versus distance curves are also presented to explain the mechanisms of imaging.
2. Experiments and results
The experiments were performed using a high-force-resolution nc-AFM/STM operating in UHV with sub-ångstr¨om oscillation amplitudes [11]. The microscope employs a Fabry– Perot fibre interferometer for deflection detection with high sensitivity. The lever is oscillated with ultra-small amplitudes
(0.25 Åp) at a frequency well below its resonance. Rastering across the surface at constant tunnel current, the changes in the oscillation amplitude due to force interaction are recorded using a lock-in amplifier. In the case of very small oscillation amplitudes applied at frequencies far below resonance the force gradient interaction between tip and sample can simply be expressed as
d F/dz = k0(1 − A0/A), (1)
where k0, A0and A, are the stiffness, free oscillation amplitude and measured amplitude of the cantilever, respectively. The amplitude changes are converted into the force gradient, for images and force spectroscopy. Compared to large-amplitude resonance enhancement techniques, the oscillation amplitude data directly give quantitative force gradient information without need of deconvolution. It is straightforward to calculate the force gradients at each pixel point of an image. Hence, not only the F–d curves, but also the force gradient images, give quantitative information. Furthermore, the energy input to the interacting tip–sample system is very low, and the perturbation is minimal in probing the interactions.
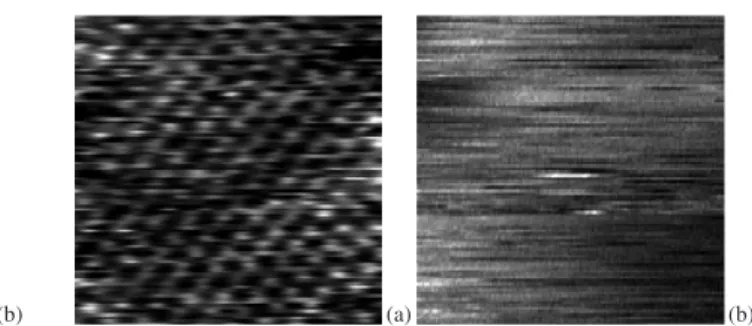
(a) (b)
Figure 2. Simultaneous force gradient (a) and STM (b) images of
Cu(100). The image size is 32× 32 Å2. V
tip= 20 mV,
IT = 15.9 nA, A0= 0.25 Å and k0= 55 N m−1. The black to white
scale corresponds to 541.2 N m−1(force gradient) and 1.53 Å (STM).
Home-made tungsten cantilevers with spring constants of 50–200 N m−1were used in the experiments. The preparation and calibration of the cantilevers are reported elsewhere [11]. A Cu(100) sample in the shape of a 10 mm diameter disc with 3 mm thickness was cleaned by repeated cycles of Ar ion bombardment at 1 kV for 30 min followed by an anneal for 30 min at∼600◦C. The (1× 1) structure of the clean surface was verified independently by LEED investigation prior to AFM experiments.
Figure 1 shows examples of such a scan taken with an average tunnel current of about 9.1 nA. The force gradient scan reveals atomic resolution, whereas the STM topography exhibits an extremely low contrast, even though the imaging parameters were similar to the work of Clarke et al [8] where they reported atomic resolution. In fact, the height difference among the regions of interest in STM image was measured to be less than 0.1 Å. This is quite reasonable in LDOS terms and suggests that there is minimal tip perturbation. The lack of contrast in the STM topography scans means we have essentially a flat tip trajectory during the scans, which makes it easier to work out the separation dependence of the force gradient. Over a series of images, the set tunnelling current was altered in order to study the dependence of the corrugations in both scans on the tip–sample separation. The tip bias voltage and free oscillation amplitude were kept constant for all of the experiments at 20 mV and 0.25 Å, respectively.
AFM/STM images were acquired as the set tunnelling current was varied from 4 to 16 nA. Just like the pair shown in figure 1, none of the STM images show an atomic contrast, whereas the force gradient images revealed atomic resolution with corrugation heights increasing with the average tunnelling current during imaging. Figure 2 shows a pair of scans taken with 15.9 nA average tunnelling current. The force gradient image clearly shows the (1 × 1) structure of the Cu(100) surface. On the other hand, there is no atomic scale contrast in the STM image. Figure 3 shows the line profiles measured across the atomic positions on force gradient images at different tunnelling current set points. The dependence of the force gradient corrugation on average tip–sample separation was found to be strong. An average tunnelling current of 4.1 nA resulted in corrugation of about 5.5 N m−1 and the stiffness was always negative during the scan. When we increased the current to about 9 nA, the corrugation increased up to 15 N m−1, with the stiffness varying around zero. S6
Figure 3. Line profiles showing the atomic corrugations in force
gradient images acquired at different average tunnelling currents. Note the break on the y-axis.
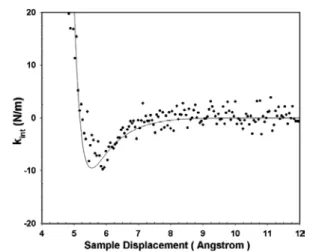
Figure 4. Measured total interaction stiffness (dashed curve) and
tunnelling current (dotted curve) versus sample displacement.
A0= 0.25 Å and k0= 55 N m−1. The force curve (circles)
calculated by integrating the measured force gradient and the van der Waals fit (solid curve) to the long-range part of the force gradient are also shown. Arrows indicate the approximate operating points for the sets of images taken at different tunnelling currents.
As we proceeded with imaging at even higher currents, the force gradient corrugation increased at a steep rate, and at 15.9 nA average current we measured about 60 N m−1.
We also made force–distance and current–distance measurements. During the measurements, the feedback loop was switched off and the sample was approached towards the tip while simultaneously recording the oscillation amplitude of the cantilever and the tunnel current. Figure 4 shows the total interaction stiffness and the tunnel current as a function of the sample piezo displacement. The total interaction stiffness, which is a sum of long- and short-range components, was calculated from the measured oscillation amplitude data using equation (1). In order to study the short-range behaviour it is crucial to subtract the long-range contributions such as van der Waals (vdW) forces [12]. We found that a fourth-order power law dependence fits well with our data, with the assumption of a truncated cone geometry for the tip [12]. The vdW fit to the long-range part of the stiffness curve shown in figure 4 yielded a vdW radius of 25 Å. Once the
Figure 5. Short-range contribution to the interaction stiffness (dots)
upon van der Waals subtraction from total interaction stiffness. The solid curve shows the Rose fit. See the text for the details of the fit.
vdW component is subtracted we end up with the interaction stiffness due to short-range interactions, which are known to be responsible for atomic-resolution nc-AFM imaging of various surfaces [9, 12, 13].
The short-range stiffness component shown in figure 5 is fitted to the simple model introduced by Rose et al [14], which is known to fit a wide range of atomic interactions with a suitable scaling of parameters. The tip–sample interaction energy can be written as
E(z) = −|Eb|(1 + a + 0.05a3)e−a
where Ebis the minimum of the interaction potential, and a is the normalized distance given by
a= z− z0
λ .
Here z0 is a distance offset which results from the fact that the true zero of the distance axis is unknown, and λ is the characteristic length scale. We differentiated this universal energy curve twice to get kint [12], and fitted the measured interaction stiffness in figure 5 to that expression. The fit shown by the solid curve gives a value of 0.87 eV for Eb, and 0.40 Å forλ. In the recent theoretical work of Stich et al [15] on a Cu(100) surface interacting with a Si tip it was reported that the minimum energy was about 1.75 and 2 eV for on-top and hollow sites, respectively. The smaller values we observe can result from the metallic tip used in this work in contrast to the more reactive Si tip considered in their simulation work. Rose
et al reported aλ value of 0.55 Å for Cu. We also integrated the
short-range stiffness data in the region of interest to obtain a force curve (figure 3), which gave a value of about 0.75 nN for the maximum attractive force. Integration once more gives us the energy curve as well. The minimum of the energy (0.7 eV) is also smaller than the value reported in [15].
In this work, we find that changes in the force gradient interaction occur before the tunnelling current is detected, as is shown in figure 2. This is unlike previous observations made on Si(111) and Si(100) where we found that tips that provided atomic resolution also provided an onset of tunnelling current well before the detection of a change in interaction
H ¨O ¨Ozer et al
stiffness [12, 16, 17]. Blunter tips with larger cone angle and vdW radius, which gave earlier force onset, would not resolve the short-range interactions, due to domination of long-range forces. We also note that the particular lever/tip used in this work was also tested with a Si(111) sample and it was found to be sufficiently sharp to resolve short-range interactions without a significant long-range contribution.
Figure 4 shows the stiffness values which correspond to specific tunnelling current settings while scanning. The lowest setting of tunnel current (4.1 nA) results in a stiffness between the minimum and the zero intercept of the stiffness curve. An increase of current to about 9.1 nA brings the stiffness values to higher values, varying around the zero intercept. Upon further increase of the current, the stiffness values measured are always positive and exhibit a very steep rate of increase with displacement. The point of operation of STM at these values also corresponds to approximately the zero intercept of the force curve, i.e. the onset of repulsive interactions. The force gradient/tunnel current versus displacement curves are consistent with the corrugation measurements and observations in imaging of the surface.
Another interesting observation is that in most experi-ments the oscillation amplitude during imaging was usually lower than the free oscillation amplitude. In some other exper-iments it was found to vary around the free oscillation ampli-tude, but was very rarely larger than the free amplitude. This again shows that the tip–sample separation is already beyond the minimum of the stiffness (force gradient) curve and that the force gradient was positive most of the time. Similar observa-tions were reported by D¨urig et al [7], which they attributed to an oxide layer possibly present in the junction resulting in smaller in tip–sample separations at the desired tunnel current. However, in our case this observation was valid for a set of ex-periments where the Cu(100) surface was atomically resolved. This suggests that in our case the presence of an oxide layer is not suitable to explain the positive force gradients during tunnelling between the metal tip and the sample.
3. Conclusion
In summary, we obtained force gradient atomic-resolution images of Cu(100) surface using extremely small oscillation amplitudes. The lack of contrast in STM scans corresponds to a flat tip trajectory during the scans, and indicates normal STM operation. Hence the force gradient images of the surface show a true force gradient map. The corrugation in the force gradient image is found to depend strongly on the tip–sample distance, with the dependence being monotonic. Further imaging to obtain more data points for separation dependence is necessary
to see its exact functional dependence. The operating regime for STM is found to be between the minimum of the stiffness curve and the start of the repulsive force. This position, and onset of repulsion, explains the very rapid change of corrugation with tip–surface separation. We do not exclude the possible dependence of the imaging conditions on the physical and chemical structure of the tip. However, within the presented set of data, there is a good quantitative agreement between the images and spectroscopy curves. Furthermore, the atomic-resolution force gradient images suggest a sufficiently sharp tip, which would be expected to provide an atomic-scale contrast in STM images.
Acknowledgments
We gratefully acknowledge the financial support by the Royal Society Paul Fund, EPSRC (UK), and Science Foundation Ireland.
References
[1] Tersoff J and Hamann D R 1985 Phys. Rev. B 31 805 [2] Crommie M F, Lutz C P and Eigler D M 1993 Phys. Rev. B 48
2851
[3] Hallmark V M, Chian S, Rabolt J F, Swalen S D and Wilson R J 1987 Phys. Rev. Lett. 59 2879
[4] Wintterlin J, Wiechers J, Brune H, Gritsch T, H¨ofer H and Behm R J 1989 Phys. Rev. Lett. 62 59
[5] Ciraci S, Tekman E, Baratoff A and Batra I P 1992 Phys. Rev. B 46 10411
[6] Doyen G, Koetter E, Vigneron J P and Scheffler M 1990 Appl.
Phys. A 51 281
[7] D¨urig U, Gimzewski J K and Pohl D W 1986 Phys. Rev. Lett.
57 2403
[8] Clarke A R H, Pethica J B, Nieminen J A, Besenbacher F, Lægsgaard E and Stensgaard I 1996 Phys. Rev. Lett. 76 1276
[9] Loppacher Ch, Bammerlin M, Guggisberg M, Sch¨ar S, Bennewitz R, Baratoff A, Meyer E and
G¨untherodt H-J 2000 Phys. Rev. B 62 16944
[10] Hofer W A, Fisher A J, Wolkow R A and Gr¨utter P 2001 Phys.
Rev. Lett. 87 236104
[11] Oral A, Grimble R, ¨Ozer H ¨O and Pethica J B 2003 Rev. Sci.
Instrum. 74 3656
[12] Hoffmann P M, Grimble R A, Jeffery S, Pethica J B, Oral A and ¨Ozer H ¨O 2001 Proc. R. Soc. A 457 1161 [13] Perez R, Stich I, Payne M C and Terakura K 1998 Phys. Rev. B
58 10835
[14] Rose J H, Smith J R and Ferrante J 1983 Phys. Rev. B 28 1835 [15] Stich I, Dieska P and Perez R 2002 Appl. Surf. Sci. 188 325 [16] Oral A, Grimble R A, ¨Ozer H ¨O, Hoffmann P M and
Pethica J B 2001 Appl. Phys. Lett. 79 1915
[17] ¨Ozer H ¨O, Atabak M, Ellialtio ˘glu R M and Oral A 2002 Appl.
Surf. Sci. 188 301