The Use of Educational Technology at Tertiary Level
Eğitim Teknolojisinin Üniversitede Kullanımı
Vehbi TÜREL*
ABSTRACT: This study examined the use of educational technology at tertiary level at one of the newly
established (i.e. 2007) universities in the eastern part of Turkey in the spring of 2012. The study examined the tertiary teaching staffs‟ (a) personal and computer related characteristics, (b) their computer self-efficacy perceptions, (c) their computer-using level in certain software, (d) their frequency of computer use for teaching, administrative and communication objectives, and (e) their use of educational technology preferences for preparation and teaching purposes. In this study, all teaching staffs were given the questionnaires to complete. 194 participants (n= 194) completed and returned them. The study was mostly quantitative and partly qualitative. The quantitative results were analysed with SPSS (i.e. mean, Std. Deviation, frequency, percentage, ANOVA). The qualitative data was analysed with examining the participants‟ responses gathered from the open-ended questions and focussing on the shared themes among the responses. The results reveal that the participants have high computer self-efficacy perceptions, their level in certain programs is good, and they often use computers for a wide range of purposes. There are also statistical differences between (a) their computer self-efficacy perceptions, (b) frequency of computer use for certain purposes, and (c) computer level in certain programs in terms of different independent variables.
Keywords: educational technology, information and communication technology (ICT), tertiary level, teaching
staff, computer self-efficacy perceptions
ÖZ: Bu çalışma, 2012 yılının İlkbaharında Türkiye‟nin doğusunda 2007 yılında kurulan bir üniversitede
eğitim teknolojisinin kullanımı üzerine yapıldı. Çalışma, (a) öğretim elemanlarının kişisel ve bilgisayar ile ilgili karakterlerini, (b) bilgisayar öz-yeterlilik algılarını, (c) belirli programları kullanma seviyelerini, (d) Öğretme, idari ve iletişim amaçlar için bilgisayar kullanma sıklıkları ve (e) ders notlarını hazırlama ve dersi öğretme için teknoloji kullanma tercihlerini araştırmayı amaçlamıştır. Bu çalışmada, üniversite de devamlı ve tam zamanlı olarak çalışan tüm öğretim elemanlarına tamamlamaları için bütün anketler verilmiştir. Sadece 194 öğretim elemanı anketleri cevaplandırmış ve geri vermiştir. Çalışma çoğunlukla nicel ve kısmen nitel yöntemleri kullanmıştır. Nicel sonuçlar SPSS (ortalama, Standart sapma, frekans, yüzde, Varyans analizi) ile analiz edilmiştir. Nitel çalışma sonucu ise, veriden çıkan kategori ve sıklıklarına göre analiz edilmiştir. Sonuçlar, katılımcıların öz-yeterlilik algısının genelde yüksek olduğu, belirli programlardaki kullanma seviyelerinin iyi olduğunu ve bilgisayarı sık sık değişik amaçlar için kullandıklarını göstermektedir. Aynı zamanda, istatistiksel olarak, katılımcıların (a) öz-yeterlilik algıları, (b) belirli maksatlar için bilgisayar kullanma sıklıkları ve (c) belirli programları kullanma seviyeleri ile değişik bağımsız değişkenler (bilgisayar kullanma süreleri, bilgisayar kullanma sıklıkları, bilgisayara erişimleri ve yaş grupları) arasında bir farklılık tespit edilmiştir.
Anahtar sözcükler: bilişim teknolojisi, bilgi ve iletişim teknolojisi (BİT), üniversite seviyesi, öğretim
elemanları, bilgisayar öz-yeterlilik algısı
1. INTRODUCTION
Educational technology can be in a wide range of diverse forms such as PowerPoint, Microsoft World, Databases; the Internet, intranet, e-mail; video, overhead projectors, computer projectors, scanners, cassette players, interactive whiteboards or any type of digital resources. To this end, different studies on different aspects of education technology such as the use of digital resources (Maher et al. 2012), the use of interactive whiteboards (Turel & Johnson 2012), the difficulties teaching staff face with in using educational technology (Buchanan et al., 2013; Seferoglu 2007; Usluel & Seferoglu 2004), the design of digital materials (Turel & McKenna 2013; Turel 2012, 2011, 2010), human-educational technology interaction and health (Bilge 2012; Altun & Cakan, 2006; Keser 2005; Odabası 2005; Ozden et al. 2004) and many more were conducted.
*
Educational technology has become integral to teaching and learning since the use of computers, the internet and digital resources in as well as out of the classrooms. While computers and the internet have been used at universities in Turkey in the last two decades, in some other countries educational technology has been used in the last five decades (Romeo 2006; Sırakaya, & Seferoglu 2013). To make use of educational technology more widely and efficiently, tremendous investment and effort were made in some countries (Romeo et al., 2012; Balasubramanian et.al. 2009; Becta 2009). Although the use, the efficient use and the frequency use of educational technology at tertiary level can show significant differences not only among different countries (Maher et al., 2012; Yeung 2012; Kregor et al. 2012; Kennedy et al. 2009), but also among different tertiary institutions in the same country, it would not be wrong to claim that educational technology is today used at all tertiary institutions in all developed and developing countries. Even more and more tertiary institutions are using educational technology to develop as well as to deliver course materials (Hong & Lai 2011). In fact, tertiary institutions no longer have a choice whether to use educational technology or not, they have to use it in order to be competitive in this age. Moreover, today‟s tertiary students, who are in general digitally fluent and competitive, expect educational technology to be used more widely in teaching and learning (Duncan-Howell 2012). Therefore, it is said that teaching at tertiary should respond to such learning demands and differences to accommodate the digital-literate, wise and efficient learning style preferences (Duncan-Howell 2012; Prensky 2001). Although the use of educational technology at tertiary level is important, the use of the right digital resources and their efficient use are more vital. Only physically having educational technology or solely using educational technology in itself is no longer enough. Educational technology has to be used selectively, efficiently and effectively. For example, Yanpar (2011) emphasizes that the selection of educational software is an essential part of efficient teaching and learning. The successful use of educational technology at tertiary level is fully in the hands of the teaching staffs as well as their students. If both groups use it efficiently, educational technology, as a tool, has the potential of enabling them to achieve the main goal, which is providing students with the required competitive 21st century knowledge, skills and competencies, then it can be said that educational technology is used in true-sense.
Although computers and the internet have been available in higher education in Turkey in the last two decades; it is not known to what extent the teaching staffs at the university in the eastern part of the country have computer self-efficacy perceptions as well as have been taking the advantage of the potential benefits that educational technology can afford at universities. Therefore, five major research questions were investigated:
1. How do the teaching staffs perceive their general self-efficacy in regard to the use of computers?
2. What is their level in using certain software?
3. How often do they use computers for teaching, administrative and communication? 4. What are their educational technology preferences for preparation and teaching purposes? 5. Are their certain perceptions associated with their (a) computer access at the University,
(b) computer using period and (c) age-groups?
2. THE STUDY
2.1. The Aim of the Study
Although the general research aim studied before (Kucuk et al. 2013; Goktas et al. 2012; Usluel-Koçak & Seferoğlu 2004; Usluel & Seferoğlu 2004), this research focuses on the “the eastern part of the country”, therefore it could provide some useful information.
Most of the studies about this subject are conducted in big cities (Istanbul, Ankara, etc.). On the other hand, eastern part of the country has not been researched in detail yet. Therefore, from this point of view this study can be said as significant to contribute.
This study gathered empirical data to find out 194 teaching staffs‟ (a) personal and computer related characteristics, (b) their computer self-efficacy beliefs, (c) their computer-using level in certain programs, (d) their frequency of computer use for teaching, administrative and communication purposes, (e) their use of technology preferences for preparation and teaching purposes and (f) whether there is any association between their perceptions and certain independent variables, as indicated above.
2.2. The Participants
The participants were 194 (N= 194) full-time permanent teaching staff (83% male, 17% female). The potential participant pool was approximately 216. The participants represented a response rate of 89.8%. 30.9% were research assistants, 5.2% were tutors, 23.2% were associate lecturers, and 40.7% were lecturers.
They were working at different faculties or colleges of the university: 39.2% were at Faculty of Science and Art, 9.8% were at Faculty of Agriculture, 5.7% were at Faculty of Engineering, 5.7% were at Faculty of Economics, 8.2% were at Faculty of Theology, and 31.4% were at different colleges (i.e. two-year degree programs / Higher National Diploma programs) of the university. Their age spread varied, being 21-30 (37.6%), 31-40 (36.1%), 41-50 (20.1%), 51-60 (4.6%) and 61 and above (1.5%).
According to the participants‟ personal and computer related characteristics questionnaire, they were computer literate and had either a PC or a laptop. All had 24/7 access to the Internet as well as e-mail at the university. While 14.9% of them had access to the computers only at the university, 84.5% had access to the computers both at the university and home. They learnt how to use computers in a wide range of ways: by themselves (67.5%), at work (9.3%), at a private course (6.7%), at an institutional course (11.9%), or at a combination of the mentioned places (4.5%).
In terms of how long they used information and communication technology (ICT), and the results were ranked as follow: 1-5 years (6.2%), 6-10 (27.8%), 11-15 (40.2%), and 16 and above years (25.8%). In terms of how often they use ICT, the results were: very often every day (44.3%), a few hours every day (49%), a few days weekly (3.6%) and a few hours or less weekly (3%). This shows that the participants self-rated themselves to be regular ICT users.
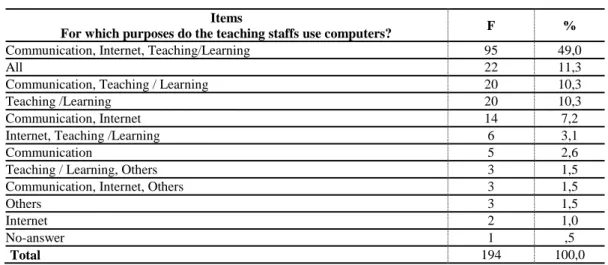
Table 1: The Teaching Staffs’ Use of Computer Purposes
Items
For which purposes do the teaching staffs use computers? F %
Communication, Internet, Teaching/Learning 95 49,0
All 22 11,3
Communication, Teaching / Learning 20 10,3
Teaching /Learning 20 10,3
Communication, Internet 14 7,2
Internet, Teaching /Learning 6 3,1
Communication 5 2,6
Teaching / Learning, Others 3 1,5
Communication, Internet, Others 3 1,5
Others 3 1,5
Internet 2 1,0
No-answer 1 ,5
When the teaching staffs were asked for which purposes they used computers (they could choose more than one option), 49% stated that they used computers for „communication + internet and teaching / learning‟ (Table 1). 11.3% used computers for all options, 10.3% used computers only for teaching / learning. All over, around 95% revealed that they used computers for „communication + internet and teaching / learning‟.
2.3. Methodology
Although the study was mostly quantitative, qualitative data was also collected. To be able to use data collection tools consistent with the purpose of the study, the pertinent current studies were examined (Maher et al. 2012; Askar and Umay 2001; Turel & Johnson 2012; Usluel & Seferoglu 2004; Albion 2001; Bandura 1997). Accordingly, some of the existing questionnaires and open-ended questions were used and some new ones were added.
The participants‟ personal and computer related characteristics questionnaire was designed and created by the researcher. It consisted of 11 diverse items. It aimed to collect broad demographic information. The source of computer self-efficacy perceptions questionnaire was Askar & Umay‟s data collecting procedures (2001). The questionnaire (α = .87) included 18 Likert scale items from never to always (items 1-18). The participants‟ computer-using level in certain programs questionnaire (items 19-28) and their frequency of computer use for teaching, administrative and communication purposes questionnaire (items 29-34) were taken from Usluel and Seferoglu (2004). The former (α = .85) included 10 Likert scale items from very poor to advanced and the latter (α = .84) included 6 Likert scale items from never to always. The participants‟ use of technology preferences for preparation and teaching purposes questionnaire was designed and created by the researcher. It consisted of two diverse items. The participants were also requested to answer three open-ended questions, which aimed to further support the quantitative data.
3. FINDINGS
The findings are presented in five parts, corresponding to the five research questions. The analysis of the quantitative data was conducted with SPSS (i.e. mean, Std. Deviation, frequency, percentage, ANOVA). The analysis of the qualitative data was conducted with examining the participants‟ responses gathered from the open-ended questions. It focused on the shared themes among the responses.
3.1. Their Computer Self-efficacy Perceptions
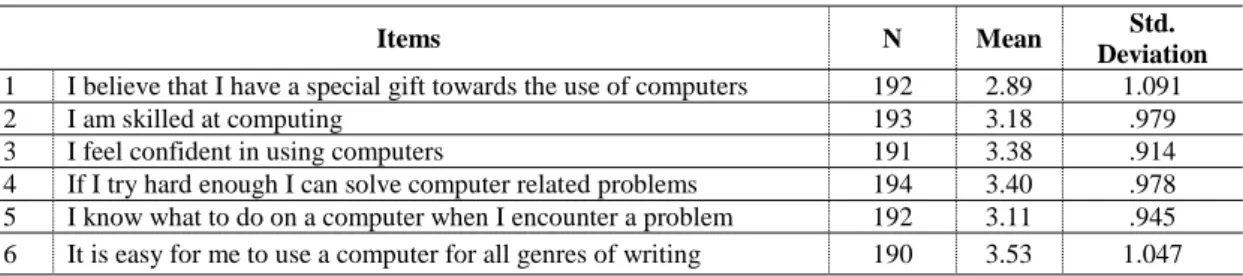
The analyzed results indicated that that the participants‟ computer self-efficacy perceptions were very positive (Table 2). The participants believe that they (a) have a special gift towards the use of computers (M = 2.89), (b) are skilled at computing (M = 3.18), (c) feel confident in using computers (M = 3.38), (d) can solve computer related problems if they try hard (M = 3.40), (e) know what to do on a computer when they encounter a problem (M = 3.11), and (f) believe that it is easy for them to use a computer for all genres of writing (M = 3.53).
Table 2: The Teaching Staffs’ Computer Self-efficacy Perceptions
Items N Mean Std.
Deviation
1 I believe that I have a special gift towards the use of computers 192 2.89 1.091
2 I am skilled at computing 193 3.18 .979
3 I feel confident in using computers 191 3.38 .914
4 If I try hard enough I can solve computer related problems 194 3.40 .978 5 I know what to do on a computer when I encounter a problem 192 3.11 .945 6 It is easy for me to use a computer for all genres of writing 190 3.53 1.047
Never 1 Seldom 2 Sometimes 3 Often 4 Always 5
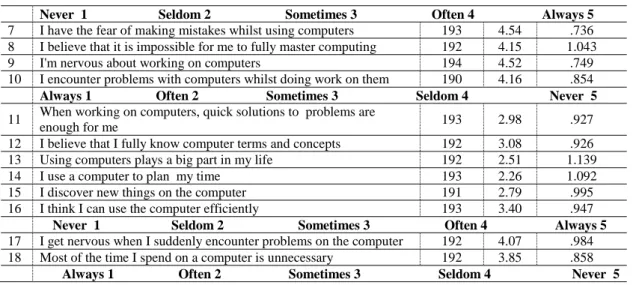
7 I have the fear of making mistakes whilst using computers 193 4.54 .736 8 I believe that it is impossible for me to fully master computing 192 4.15 1.043
9 I'm nervous about working on computers 194 4.52 .749
10 I encounter problems with computers whilst doing work on them 190 4.16 .854
Always 1 Often 2 Sometimes 3 Seldom 4 Never 5
11 When working on computers, quick solutions to problems are
enough for me 193 2.98 .927
12 I believe that I fully know computer terms and concepts 192 3.08 .926 13 Using computers plays a big part in my life 192 2.51 1.139
14 I use a computer to plan my time 193 2.26 1.092
15 I discover new things on the computer 191 2.79 .995
16 I think I can use the computer efficiently 193 3.40 .947
Never 1 Seldom 2 Sometimes 3 Often 4 Always 5
17 I get nervous when I suddenly encounter problems on the computer 192 4.07 .984 18 Most of the time I spend on a computer is unnecessary 192 3.85 .858
Always 1 Often 2 Sometimes 3 Seldom 4 Never 5 When they were asked the negative statements about their computer self-efficacy perceptions, the results revealed that their computer self-efficacy perceptions were very positive. They do not have the fear of making mistakes while using computers (M = 4.54). They believe that it is possible for them to fully master computing (M = 4.15). They are not nervous about working on computers (M = 4.52). They do not encounter problems with computers whist doing work on them (M = 4.16). In the same way, they do not get nervous when they suddenly encounter problems on the computer (M = 4.07) and they think that most of the time they spend on a computer is necessary (M = 3.85).
They believe that they fully know computer terms and concepts (M = 3.08) and can use computer efficiently (M = 3.40). They also think that when working on computers, quick solutions to problems are enough for them (M = 2.98), computer plays a big part in their life (M = 2.51) and they discover new things on the computer (M = 2.79). However, most of them do not use computer to plan their time (M = 2.26).
3.2. Their Level in Using Certain Software
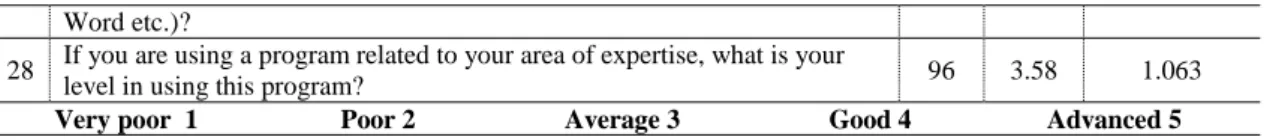
The analyzed results in Table 3 reveal that they are very good in using e-mail (M = 4.16) and the Internet (M = 4.15). They think that they are good in Word Processors (i.e. Microsoft Word) (M = 3.92), Presentation Programs (i.e. Microsoft PowerPoint) (M = 3.68), using a program related to their area of expertise (M = 3.58), Spreadsheet (i.e. Excel) (M = 3.26), Desktop publishing (M = 3.01) and in using scanners (M = 3.01). They are average in using Statistics programs (M = 2.54) and are below average in using a Database Program (i.e. Microsoft Access) (M = 2.37).
Table 3: The Teaching Staffs’ Level in Using Certain Programs
İtems N Mean Std.
Deviation
19 What is your level in using the Word Processor (i.e. Microsoft Word)? 191 3.92 .753 20 What is your level in using the Spreadsheet (i.e. Microsoft Excel)? 191 3.26 1.001 21 What is your level in using Presentation Programs (i.e. Microsoft Power
Point)? 191 3.68 1.005
22 What is your level in using the Database Program (i.e. Microsoft Access)? 188 2.37 1.132 23 What is your level in using e-mail (i.e. Yahoo mail, Hotmail, Gmail, MS
Outlook etc.)? 190 4.16 .763
24 What is your level in using the Internet / WWW? 188 4.15 .807 25 What is your level in using Statistics Programs (i.e. Excel, SPSS etc.)? 189 2.54 1.196
26 What is your level in using scanners? 188 3.38 1.143
Word etc.)?
28 If you are using a program related to your area of expertise, what is your
level in using this program? 96 3.58 1.063
Very poor 1 Poor 2 Average 3 Good 4 Advanced 5
3.3. Their Frequency and Purpose of Computer Use
They use computers mostly for browsing the Internet (M = 4.31) and for communication (i.e. email, chat etc.) (M = 4.04). This is followed by using computers in preparing lecture notes (M = 3.83), for administrative purposes (M = 3.57), in evaluation and measurement of students‟ work (M = 3.28) and in teaching their lessons in the class (M = 3.18). It appears that communication applications (i.e. the internet, e-mail) are the most popular and most commonly used by the teaching staffs.
Table 4: The Teaching Staffs’ Frequency and Purpose of Computer Use
İtems N Mean Std.
Deviation
29 I use computers in preparing lecture notes 187 3.83 1.007 30 I use computers in teaching my lessons in the class 183 3.18 1.198 31 I use computers in evaluation and measurement of students' work 180 3.28 1.211 32 I use computers for administrative purposes 181 3.57 1.146 33 I use the computer to browse the Internet / WWW 191 4.31 .722 34 I use the computer / internet for communication (i.e. email, chat etc.) 190 4.04 .975
3.4. Their Educational Technology Preferences for Preparation and Teaching Purposes
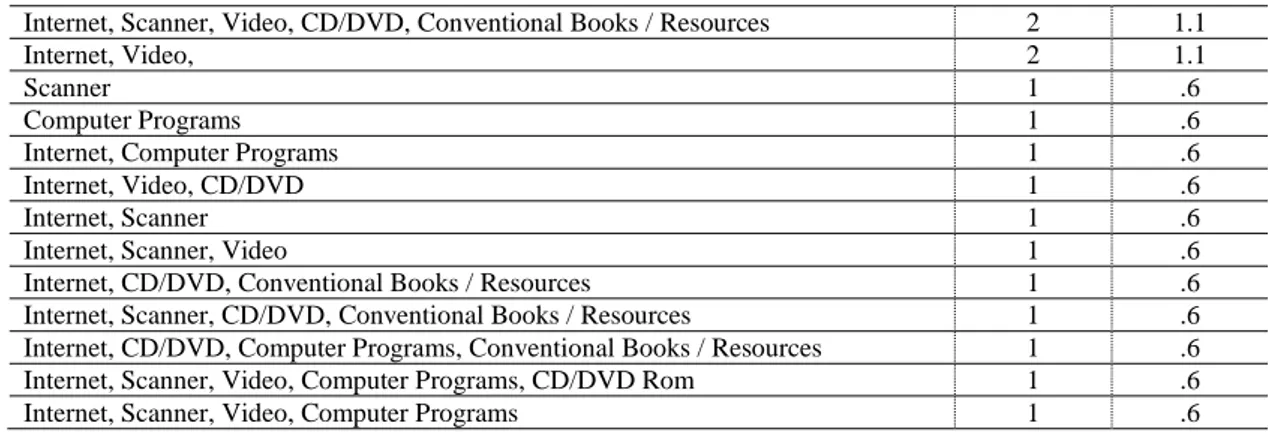
The big percentage of the teaching staffs uses the Internet and conventional books in preparing lecture notes (21 %). This is followed by the Internet + computer programs + conventional books (14.4 %), the Internet + scanner + conventional books (10.6 %), the Internet + scanner + computer programs + conventional books (9.4 %) and the Internet + video + computer programs + conventional books (6.1 %). The majority of the teaching staffs use a combination of wide range of educational technology, as shown in Table 5, while a very small percentage uses only one technology or tool such as scanner (.6 %), the internet (1.7 %) and conventional books (5.0 %).
Table 5: The Teaching Staffs’ Educational Technology Preferences for Preparation
Which ones do the teaching staffs use in preparing lecture notes?
(might tick more than one choice) Frequency Percent
Internet, Conventional Books 38 21.1
Internet, Computer Programs, Conventional Books / Resources 26 14.4
Internet, Scanner, Conventional Books / Resources 19 10.6
Internet, Scanner, Computer Programs, Conventional Books / Resources 17 9.4 Internet, Video, Computer Programs, Conventional Books / Resources 11 6.1
Conventional Books / Resources 9 5.0
All 8 4.4
Internet, Scanner, Video, Conventional Books / Resources 8 4.4
Internet, Video, Conventional Books / Resources 8 4.4
Internet, Scanner, Video, Computer Programs, Conventional Books / Resources 7 3.9
Internet 3 1.7
Scanner, Conventional Books / Resources 3 1.7
Computer Programs, Conventional Books / Resources 3 1.7
Internet, Scanner, Computer Programs, 3 1.7
Internet, Scanner, Video, CD/DVD, Conventional Books / Resources 2 1.1
Internet, Video, 2 1.1
Scanner 1 .6
Computer Programs 1 .6
Internet, Computer Programs 1 .6
Internet, Video, CD/DVD 1 .6
Internet, Scanner 1 .6
Internet, Scanner, Video 1 .6
Internet, CD/DVD, Conventional Books / Resources 1 .6
Internet, Scanner, CD/DVD, Conventional Books / Resources 1 .6 Internet, CD/DVD, Computer Programs, Conventional Books / Resources 1 .6 Internet, Scanner, Video, Computer Programs, CD/DVD Rom 1 .6
Internet, Scanner, Video, Computer Programs 1 .6
In terms of teaching purposes, the big percentage of the teaching staffs uses a combination of a projector and a black/white board (34.3 %). This is followed by black/white board (21.1%), projector + video + black/white board (13.1%), and a projector (4.6%). The majority of the teaching staffs use a combination of wide range of educational technology for teaching their lessons, as shown in Table 6, while a very small percentage uses only one technology or tool such as video (.6%) and a projector (4.6 %).
Table 6: The Teaching Staffs’ Educational Technology Preferences for Teaching Purposes
Which ones do the teaching staffs use in teaching their lessons?
(might tick more than one choice) Frequency Percent
Projector, Conventional Black / White Board 60 34.3
Black / White Board 37 21.1
Projector, Video, Black / White Board 23 13.1
Projector 8 4.6
Projector, Video, IWB, Black / White Board 6 3.4
Projector, IWB, Black / White Board 6 3.4
Projector, Video 5 2.9
Overhead projector, Black/White Board 4 2.3
Projector, Overhead projector ,Video, IWB, B/W B 3 1.7
Projector, Interactive White Board 3 1.7
Projector, Overhead projector, Black / White Board 3 1.7
Projector, Overhead Projector, Video, IWB, 3 1.7
Projector, Overhead projector, Video, 3 1.7
Projector, Overhead projector, IWB, Black / White Board 2 1.1
Projector, Overhead projector 2 1.1
Overhead projector 1 .6
Video 1 .6
IWB, Black / White Board 1 .6
Projector, Overhead projector, IWB 1 .6
Overhead projector, IWB, Black/White Board 1 .6
Video, Black / White Board 1 .6
Projector, Overhead projector, Video, Black/White Board 1 .6
To further investigate the factors affecting the teaching staffs‟ use of educational technologies (i.e. for preparation and teaching purposes), the participants were also requested to answer three open-ended questions. 148 (out of 194) participants answered the three open ended questions and their answers are presented below.
The participants‟ answers to the first open-ended questions (Table 7) reveal that the teaching staffs think that the university does not have enough (a) computer and computer projectors, (b) IWBs, (c) static desktop computers and pertinent digital resources, and other relevant educational technology (i.e. video, printers, cinema archive etc.). Not having full access
to the Internet (in and/or out of the classroom) also seems to be considered a factor affecting their use of educational technology at tertiary level.
Table 7: The Factors Preventing the Teaching staffs’ Use of Educational Technology
What do the teaching staffs think prevent them using educational technology (at their department / program)?
Number of mentions
Not enough computer and computer projectors (in classrooms / labs) 45
Not having Interactive Whiteboards (IWB) 27
Lack of desktop computers in all classrooms for use of the teaching staff and the pertinent digital
resources 24
Not having full access to the internet (in and / or out of classroom) 23 Not enough educational technology (i.e. video, printers, cinema archive) 21 Not having pertinent software and anti-virus programmes 11
Not having wireless system 11
Not having pertinent digital resources 10
Not knowing how to use educational technology in teaching (i.e. computer programs) 10
No / not enough head projectors (in classrooms / labs) 9
Shortage of power supply 8
Not enough access to journal databases and e-libraries 7
Not having networks / servers in the classrooms / labs 6
Not enough ICT technician to sort out ICT teething problems when we need their help 6
Not having access to the Internet in the classrooms 5
Not enough budget to buy ICT equipment and resources 4
Not giving computer to research assistants 3
Students are not taught how to use ICT efficiently in the early years of their education (at the
university) 3
More ICT hours in the curriculum at the early stages of the students‟ education (at the university) 2 Not having a team of experts who can prepare multi-media programs for teaching (taught)
modules 2
Students do not have computers or access to computers 1
Table 8: The Factors Enabling the Teaching Staffs’ Use of Educational Technology
What can be done to enable the use of educational technology more at your department / program?
Number of mentions
(Static) Computer and computer projectors should be available in all classrooms 40
IWB should be available in all classroom and / or labs 32
More computers / computer labs are needed 30
Access to the Internet should be available in classrooms, as well 26
Providing pertinent digital resources 21
Efficient ICT courses regarding the use of ICT for teaching / learning and the use of data journals
and e-libraries should be provided 21
Access to ICT Labs should be available for all students 17
Wireless system should be available 15
Efficient ICT courses regarding how to prepare digital resources 14 Efficient ICT courses regarding the use of the Internet efficiently 14 Computer-assisted education / teaching should be encouraged 7 Providing access to more journal databases and e-libraries 6
Providing computer networks / servers in all labs 5
Giving specific computers, scanner, printer, software etc. to departments 5
Encouraging students to make use of ICT 3
Employing qualified and digitally fluent, wise and competitive teaching staff 2
Giving computers to research assistants 2
ITC technicians need to be deployed more efficiently 2
We should have access to photocopy machines whenever needed 2
Encouraging teaching staff to make use of ICT 1
The use of White / Blackboard should be banned 1
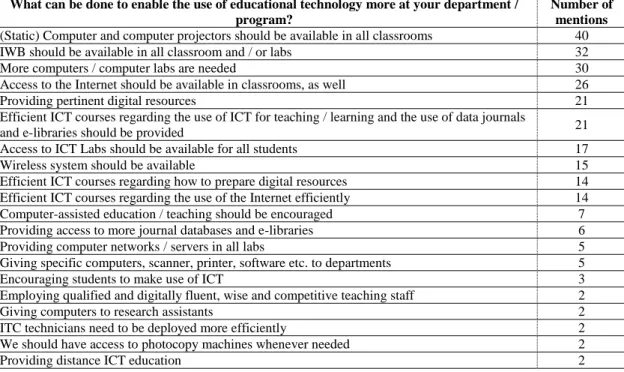
The participants‟ answers to the second open-ended questions (Table 8) reveal that providing (a) static computer and computer projectors, (b) IWBs, (c) more computer and computer labs, (d) access to the Internet in the classrooms, (e) pertinent digital resources and (f) efficient ICT courses regarding the use of ICT for teaching/learning and the use of data journals and e-libraries can further enable the use of educational technology at their departments.
Table 9: The Factors Further Enabling the Teaching Staffs’ Use of Educational Technology
Is there anything else you would like to add regarding the use of educational technology at your department / program?
Number of mentions
Wireless system should be available at all departments as well as at the university campus both
for staff and students 63
Full-access to the Internet (i.e. such as access to You Tube, downloading etc. so that we can use
available resources for teaching) 45
Efficient ICT courses regarding common programs such as Excel, PowerPoint, the Internet,
SPSS, the use of data journals etc. should be available for members of staff 19 Efficient ICT coursed regarding common programs such as Excel, PowerPoint, SPSS, the
internet etc. should be available for students 13
Efficient ICT coursed regarding the use of ICT in teaching / learning 11
More efficient / fast technology / Internet 5
Access to more journal databases and e-libraries should be made available 5
Pertinent digital resources should be provided 5
Access to the Internet and Intranet should also be available at staff accommodation 4 Computers should be given to the research assistants, as well 3
Efficient anti-virus programs should be provided 2
Printers connected to the networks / servers should be provided. 2 Setting up a team of experts who can prepare multi-media programs for teaching (taught)
modules 2
Access to certain things such as Facebook should be limited 1
The participants‟ also think that providing (a) wireless system at the university both for staff and students, (b) full-access to the Internet, (c) efficient ICT courses for staff and students can further enable them to make use of educational technology at tertiary level (Table 9).
3.5. Differences between their Perceptions in terms of Some Independent Variables
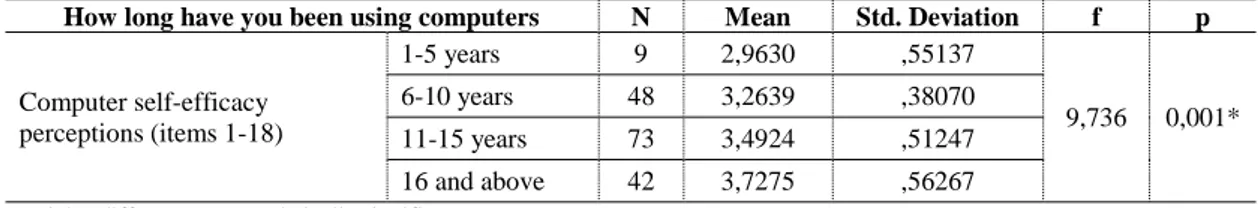
Analysis of variance (ANOVA) was administered to examine whether there were any differences between the participants‟ computer self-efficacy perceptions (items 1-18) in terms of how long they have been using computers (Table 10).
Table 10: Analysis of Variance (ANOVA) for Computer Self-efficacy Perceptions in terms of How Long they have been Using Computers
How long have you been using computers N Mean Std. Deviation f p
Computer self-efficacy perceptions (items 1-18) 1-5 years 9 2,9630 ,55137 9,736 0,001* 6-10 years 48 3,2639 ,38070 11-15 years 73 3,4924 ,51247 16 and above 42 3,7275 ,56267
The difference between year-groups was statistically significant in terms of computer self-efficacy perceptions score (items 1-18). The participants who have been using computers for the longest period of time seem to have the highest computer self-efficacy perceptions scores. The shorter the period of time, the lower computer self-efficacy perceptions score they have.
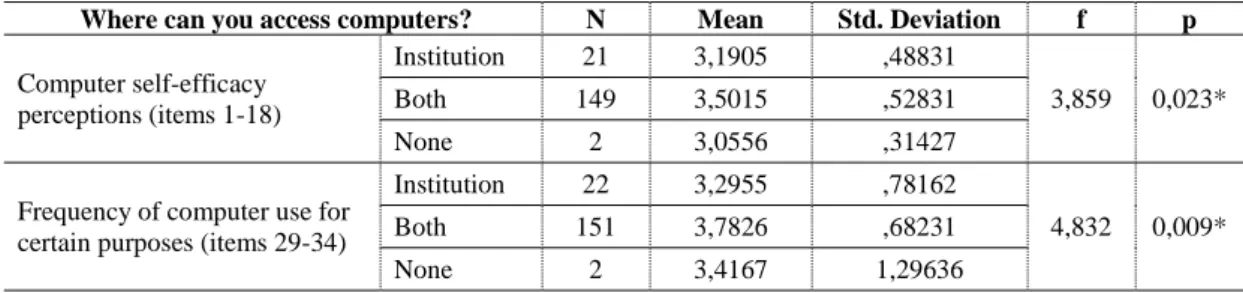
In the same way, Analysis of Variance (ANOVA) was administered to examine whether there were any differences between the participants‟ computer self-efficacy perceptions (items 1-18) and frequency of computer use for certain purposes in terms of where they can access computers (items 29-34; Table 11). The difference between where they can access computers was statistically significant in terms of computer self-efficacy perceptions score (items 1-18) and frequency of computer use for certain purposes score (items 29-34).
Table 11: Analysis of Variance (ANOVA) for Computer Self-efficacy Perceptions and Frequency of Computer Use for Certain Purposes in terms of Where They can Access Computers
Where can you access computers? N Mean Std. Deviation f p
Computer self-efficacy perceptions (items 1-18) Institution 21 3,1905 ,48831 3,859 0,023* Both 149 3,5015 ,52831 None 2 3,0556 ,31427
Frequency of computer use for certain purposes (items 29-34)
Institution 22 3,2955 ,78162
4,832 0,009*
Both 151 3,7826 ,68231
None 2 3,4167 1,29636
* α = 0.05; differences are statistically significant
The participants who have access to computers both at institution and home seem to have the highest computer self-efficacy perceptions scores. Those who do not have access to computers seem to have the lowest computer self-efficacy perceptions score. This means that the more access they have to computers, the higher computer self-efficacy perceptions score they have.
Table 12: Analysis of Variance (ANOVA) for Computer Using Level in Certain Programs, Computer self-efficacy Perceptions, and Frequency of Computer Use for Certain Purposes in terms of How Often They Use Computers
How often do you use computers N Mean Std. Dev. f p
Computer using level in certain programs (items 19-28)
A few hours monthly 2 3,1500 1,20208
4,746 0,004* A few days weekly 3 3,4000 1,50997
A few hours every day 40 3,2575 ,69573 Very often every day 48 3,7854 ,57204
Computer self-efficacy perceptions (items 1-18)
A few hours monthly 3 3,1852 ,08486
7,212 0,001* A few hours weekly 2 2,9167 ,58926
A few days weekly 5 2,8222 ,15416 A few hours every day 85 3,3366 ,43923 Very often every day 76 3,6586 ,57081
Frequency of computer use for certain purposes (items 29-34)
A few hours monthly 3 3,8889 ,48113
6,398 0,001* A few hours weekly 2 2,2500 ,11785
A few days weekly 7 3,3571 ,44544 A few hours every day 81 3,5556 ,68769 Very often every day 81 3,9465 ,68558
* α = 0.05; differences are statistically significant
The difference between how often they use computers was statistically significant in terms of computer using level in certain programs score (items 19-28), computer self-efficacy
perceptions score (items 1-18) and frequency of computer use for certain purposes score (items 29-34, Table 12). The participants who use computers most often seem to have the highest computer using level in certain programs score, computer self-efficacy perceptions scores and frequency of computer use for certain purposes score.
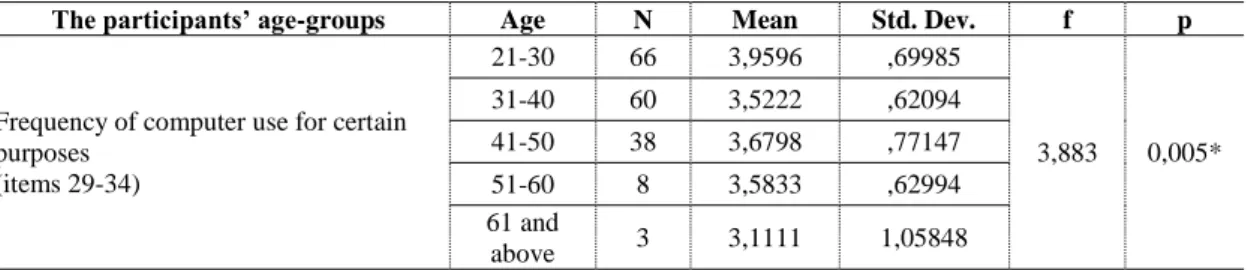
Table 13: Analysis of Variance (ANOVA) for Frequency of Computer Use for Certain Purposes in terms of Age-groups
The participants’ age-groups Age N Mean Std. Dev. f p
Frequency of computer use for certain purposes (items 29-34) 21-30 66 3,9596 ,69985 3,883 0,005* 31-40 60 3,5222 ,62094 41-50 38 3,6798 ,77147 51-60 8 3,5833 ,62994 61 and above 3 3,1111 1,05848
* α = 0.05; differences are statistically significant
The difference between age-groups was statistically significant in terms of frequency of computer use for certain purposes score (items 29-34, Table 13). The youngest age group (i.e. 21-30) seems to use computers most frequently for certain purposes. The older the age-group, the less frequently they use computers for certain purposes.
4. DISCUSSION and IMPLICATIONS
The results match with the existing findings of similar results in that the teaching staffs in general have high computer self-efficacy perceptions, their level in certain programs is good, and they often use computers for a wide range of purposes. They also think that the provision of efficient ICT courses and structural factors (i.e. pertinent hard- and soft-ware and technical support) can further enable them to make efficient use of ICT at tertiary level (Buchanan 2013; Goktas, Yildirim, & Yildirim, 2009; Usluel & Seferoglu, 2004; Akkoyunlu, 2002; Yigit et al., 2002). In terms of computer self-efficacy perceptions, the only issue about which the members of the teaching staffs do not seem to have high self-efficacy is the use of computers to plan their time. This also matches the existing findings of similar results (Usluel & Seferoglu, 2004; Green 1996).
The results also indicate that computer self-efficacy is positively associated with higher level of educational technology use, which matches the existing findings (Buchanan, 2013; Ajjan & Hartshorne, 2008; Hsu & Chiu, 2004; Cassidy & Eachus, 1995). Since the participants who have used computers for the longest period of time have the highest computer self-efficacy perceptions, the implication is that the use of ICT should be encouraged for learning and teaching from the early years and all teaching staffs should be provided with full structural factors and efficient ICT courses from the very beginning.
Computer self-efficacy and frequency of computer use for certain purposes are also positively associated with where they can access and how often they use computers. Likewise, computer using level in certain programs is also positively associated with how often they use computers. Similarly, frequency of computer use for certain purposes is positively associated with age-groups. These results show that both individual and contextual factors play a significant part in computer self-efficacy, frequency of computer use for certain purposes and computer using level in certain programs. Therefore, the implication is to provide 24/7 full access to ICT and pertinent digital resources for the teaching staffs (as well as for students) from the possible
earliest stages at all places where they are likely to make use of them such as classrooms, labs, libraries, student unions/centers, study rooms, students‟ tea houses etc.
Moreover, while providing efficient ICT courses is considered a positive factor in efficient use of educational technology by the teaching staffs - whether they are in the form of e-Learning or online-learning both in courses taught on campus and in distance learning -, the lack of structural factors (i.e. lack of pertinent hard- and software and technical support) is considered negative factors which affect their optimal use of educational technology at tertiary level. Therefore, the implication is to provide the members of the teaching staffs with efficient ICT courses pertinent to the use of all required digital resources and programs, as well as to equip them with what they need for learning/teaching not only in the classroom, but also outside of it.
It appears that at the target university, not only are the teaching staffs not provided fully with the necessary educational technology, but they are also not fully supported by presentational technology, lecture notes and reading materials that are archived electronically for flexible access, although these are only surface uses of digital technologies, as emphasized by some researchers (Kwok-Wing, 2011; Rossiter, 2007). As a result, it will not be wrong to claim that the target university has been slow in taking the fullest advantage of the potential benefits that educational technology can offer at tertiary level.
Last, but not least, these findings are practical recommendations not only for the target university, but also for all Higher Education Institutions in Turkey as well as in other countries, which do not currently have structural factors as well as do not make efficient use of educational technology at university level. In sum, the implication is not only to provide technical infrastructure / structural factors for both staff and students, but it is also to enable efficient and effective use of the pertinent educational technology for the targeted goals through providing technology plans, in-service training, technical support, role models, efficient digital resources for the targeted objectives, as some of which were emphasized in this study as well as by others (Buchanan, 2013; Goktas, Yildirim, & Yildirim, 2009; Usluel & Seferoglu, 2004).
5. REFERENCES
Ajjan, H., & Hartshorne, R. (2008). Investigating faculty decisions to adopt Web 2.0 technologies: Theory and empirical tests. The Internet and Higher Education, 11(2), 71–80.
Akkoyunlu, B. (2002). Öğretmenlerin internet kullanımı ve bu konudaki öğretmen görüşleri. Hacettepe Üniversitesi
Eğitim Fakültesi Dergisi [Hacettepe University Journal of Education], 22, 1-8.
Albion, P. (2001). Some factors in the development of self-efficacy beliefs for computer use among teacher education students. Journal of Technology & Teacher Education, 9(3), 321-48.
Altun, A., & Çakan, M. (2006) Undergraduate students' academic achievement, field dependent/independent cognitive styles and attitude toward computers. Educational Technology & Society, 9(1), 289-297.
Askar, P., & Umay, A. (2001). İlköğretim Matematik öğretmenliği öğrencilerinin bilgisayarla ilgili öz-yeterlilik algısı.
Hacettepe Üniversitesi Eğitim Fakültesi Dergisi [Hacettepe University Journal of Education], 21, 1-8.
Balasubramanian, K., Clark-Okah, W., Daniel, J., Fereira, F., Kanwar, A., Kwan, A., et.al. (2009). ICTs for higher
education: Background paper from the Commonwealth of Learning. Paris: UNESCO. [Available online at: http://unesdoc.unesco.org/images/0018/001832/183207e.pdf], Retrieved on 30 Oct. 2012.
Bandura, A. (1997). Self-efficacy: The exercise of control. New York: Freeman.
Becta (2009). Harnessing technology for next generation learning: Children, schools and families implementation plan
2009–2012. [Available online at:
http://webarchive.nationalarchives.gov.uk/20101102103654/http://publications.becta.org.uk/download.cfm?resID =39547], Retrieved on 15 Oct. 2012.
Bilge, F. (2012). Bir grup ilköğretim öğrencisinde bilgisayara yönelik bağımlılık eğilimi değerlendirmesi. Hacettepe
Üniversitesi Eğitim Fakültesi Dergisi [Hacettepe University Journal of Education], 43, 96-105.
Buchanan, T., Sainter, P., & Saunders, G. (2013). Factors affecting faculty use of learning technologies: implications for models of technology adoption. Journal of Computing in Higher Education, 25, 1–11.
Cassidy, S., & Eachus, P. (2002). Developing the computer user self-efficacy (CUSE) scale: Investigating the relationship between computer self-efficacy, gender and experience with computers. Journal of Educational
Computing Research, 26(2), 133-53,
Duncan-Howell, J. (2012). Digital mismatch: Expectations and realities of digital competency amongst pre-service education students. Australasian Journal of Educational Technology, 28(5), 827-840. [Available online at: http://www.ascilite.org.au/ajet/ajet28/duncan-howell.html], Retrieved on 30 Oct. 2012.
Goktas, Y., Kucuk, S., Aydemir, M., Telli, E., Arpacik, O., Yildirim, G., & Reisoglu, I. (2012). Educational technology research trends in Turkey: A content analysis of the 2000-2009 decade. Educational Sciences: Theory & Practice, 12(1), 177–199.
Goktas, Y., Yildirim, S., & Yildirim, Z. (2009). Main Barriers and Possible Enablers of ICTs Integration into Pre-service Teacher Education Programs. Educational Technology & Society, 12(1), 193–204.
Green, K. C. (1996). Campus computing 1995: The sixth national survey of desktop computing in higher education. Encino, CA: Campus Computing
Hong, K.-S., & K.-W. Lai. (2011). ICT for accessible, effective and efficient higher education: Experiences of Southeast Asia, Australasian Journal of Educational Technology, 27(8), Editorial: Preface to the Special issue. Hsu, M.-H., & Chiu, C.-M. (2004). Internet self-efficacy and electronic service acceptance. Decision Support Systems,
38(3), 369–381.
Kennedy, G., B. Dalgarno, S., Bennett, K., Gray, J., Waycott, T., Judd, A., et al. (2009). Educating the net generation:
A handbook of findings for practice and policy. The University of Melbourne. [Available online at: http://www.netgen.unimelb.edu.au/outcomes/handbook.html], Retrieved on 30 Oct. 2012.
Keser, H. (2005). İnsan bilgisayar etkileşimi ve sağlığa etkisi. Nobel Yayınevi. Ankara.
Kregor, G., Breslin, M., & Fountain, W. (2012). Experience and beliefs of technology users at an Australian university: Keys to maximising e-learning potential. Australasian Journal of Educational Technology, 28(8), 1382-1404. Kucuk, S., Aydemir, M., Yildirim, G., Arpacik, O., & Goktas, Y. (2013). Educational technology research trends in
Turkey from 1990 to 2011. Computers & Education 68, 42–50.
Kwok-Wing, L. (2011). Digital technology and the culture of teaching and learning in higher education. Australasian
Journal of Educational Technology, 27(8), 1263-1275.
Maher, D., Phelps, R., Urane, N., & Lee, M. (2012). Primary school teachers‟ use of digital resources with interactive whiteboards: The Australian context. Australasian Journal of Educational Technology, 28(1), 138-158. [Available online at: http://www.ascilite.org.au/ajet/ajet28/maher.html], Retrieved on 30 Oct. 2012.
Odabası, F. (2005). Parent‟s views on the Internet use. TOJET, 4(1). 38-45.
Ozden, M. Y., Erturk, I., & Sanlı, R. (2004). Students‟ Perceptions about online assessment: A case study, Journal of
Distance Education, 19(2), 77-92.
Prensky, M. (2001). Digital natives, digital immigrants. On the Horizon, 9(5). NCB University Press. [Available online at:
http://http://www.marcprensky.com/writing/Prensky%20-%20Digital%20Natives,%20Digital%20Immigrants%20-%20Part1.pdf], Retrieved on 25 Oct. 2012.
Romeo, G. I. (2006). Engage, empower, enable: Developing a shared vision for technology in education. In D. Hung & M. S. Khine (Eds), Engaged learning with emerging technologies (pp. 149-175), Dordrecht, The Netherlands: Springer.
Romeo, G., Lloyd, M., & Downes, T. (2012). Teaching Teachers for the Future (TTF): Building the ICT in education capacity of the next generation of teachers in Australia. In C. P. Lim & C. S. Chai (Eds), Building the ICT capacity of the next generation of teachers in Asia. Australasian Journal of Educational Technology, 28 (Special issue, 6), 949-964. [Available online at: http://www.ascilite.org.au/ajet/ajet28/romeo.html], Retrieved on 15 Oct. 2012.
Rossiter, D. (2007). Whither e-learning? Conceptions of change and innovation in higher education. Journal of
Organisational Transformation and Social Change, 4(1), 93-107.
Sırakaya, M. ve Seferoglu, S. S. (2013). Öğretmen adaylarının problemli internet kullanımlarının incelenmesi.
Hacettepe Üniversitesi Eğitim Fakültesi Dergisi [Hacettepe University Journal of Education], 28(1), 356-368.
Seferoglu, S. S. (2007). İlköğretim bilgisayar dersi öğretim programı: Eleştirel bir bakış ve uygulamada yaşanan sorunlar. Eğitim Araştırmaları-Eurasian Journal of Educational Research, 29, 99-111.
Turel, Y. K., & Johnson, T. E. (2012). Teachers' Belief and Use of Interactive Whiteboards for Teaching and Learning.
Educational Technology & Society, 15(1), 381–394.
Turel, V., & P. McKenna. (2013). Design of Language Learning Software. In Bin Zou et al. (Eds.). Computer-Assisted
Foreign Language Teaching and Learning: Technological Advances (pp. 188-209). USA, Hershey: IGI-Global.
Turel, V. (2012). Design of Feedback in Interactive Multimedia Language Learning Environments. Linguistik Online,
Turel, V. (2011). Learners' Attitudes to Repetitious Exposure in Multimedia Listening Software. EUROCALL Review,
19 (September), 57-83. [Available online at: http://eurocall-languages.org/review/index.html], Retrieved on 12
Oct. 2012.
Turel, V. (2010). Advanced Turkish. ReCALL, 22(3), 396-401.
Usluel, Y. K., & Seferoglu, S. S. (2004). Öğretim elemanlarının bilgi teknolojilerini kullanmada karşılaştıkları engeller, çözüm önerileri ve öz-yeterlilik algıları. Eğitim Bilimleri ve Uygulama, 3(6), 143-57.
Usluel-Koçak, Y., & Seferoğlu, S. S. (2004). The perceptions of academic staff members in faculties of education regarding their self-efficacy in relation to computer use, their use of IT, and their perceptions of obstacles in the use of IT, and solutions they propose for those problems (in Turkish). Educational Sciences and Practice (Eğitim
Bilimleri ve Uygulama), 6(3), pp. 143-157.
Yanpar, Y. T. (2011). Öğretim teknolojileri ve materyal tasarımı (2nd ed.). Ankara: Anı Yayıncılık.
Yeung, A. S., K. M. Lim., E. G. Tay., Lam-Chiang, A. C., & C. Hui. (2012). Relating use of digital technology by pre-service teachers to confidence: A Singapore survey. Australasian Journal of Educational Technology, 28(8), 1317-1332.
Yigit, Y. G., Zaim, N., & Yıldırım., S. (2002). Yükseköğretimde öğretim amaçlı teknoloji kullanımı: Bir durum saptaması. Eğitim ve Bilim, 27(124), 42-51.
Uzun Özet
Bu çalışma, 2012 yılının İlkbaharında Türkiye‟nin doğuşunda 2007 yılında kurulan bir üniversitede eğitim teknolojisinin kullanımı üzerine yapıldı. Çalışma, (a) üniversitede tam zamanlı çalışan öğretim elemanlarının kişisel ve bilgisayar ile ilgili karakterlerini, (b) bilgisayar öz-yeterlilik algılarını, (c) belirli bilgisayar programlarını kullanma seviyelerini, (d) Öğretme, idari ve iletişim amaçlar için bilgisayar kullanma sıklıkları ve (e) ders notlarını hazırlama ve dersi öğretme için eğitim teknolojisi kullanma tercihlerini araştırdı. Çalışma çoğunlukla nicel idi ve kısmen nitel idi. Nicel çalışma sonuçları SPSS (mean, Std. Deviation, frequency, percentage, ANOVA) ile analiz edildi. Nitel çalışma sonucu ise, veriden çıkan konu kategorileri ve sıklıklarına göre analiz edildi.
Çalışmada, üniversite de devamlı ve tam zamanlı olarak çalışan tüm öğretim elemanlarına tamamlamaları için bütün anketler verildi. 216 öğretim elemanından sadece 194 öğretim elemanı (% 83 bay, % 17 bayan) anketleri cevaplandırdı ve geri verdi. Katılımcıların % 30,9‟u araştırma görevlisi, % 5,2‟si okutman, % 23,2‟si öğretim görevlisi ve % 40,7‟si ise öğretim üyelerinden oluştu. Öğretim elemanların hepsi bilgisayar kullanmasını biliyor ve hepsinin bir masaüstü veya dizüstü bilgisayarı var. Hepsi 24/7 gün internet ve e-postayı kullanabiliyor. Katılımcıların % 84,5‟inin hem üniversite de hem de evde bilgisayara erişimi var. % 14.9‟nın ise sadece üniversite de bilgisayara erişimi var. Katılımcılar değişik yöntemlerle bilgisayar kullanmayı öğrenmişler: % 67,5 kendi başına, % 9,3‟ü işte, % 6,7‟si özel kursta ve % 11,9‟u bir kurum kursunda ve % 4,5 ise birden fazla değişik yerde bilgisayar kullanmayı öğrendiklerini ifade etti. Katılımcıların bilgisayar kullanım süreleri ise, % 6,2‟si 1-5 yıl, % 27,8‟i 6-10 yıl, % 40,2‟si 11-15 yıl ve % 25,8 ise 16 ve daha fazla yıl bilgisayar kullanmakta olduklarını ifade etti. Sıklık açısından ise, % 44,3‟ü her gün sık sık, % 49‟u her gün birkaç saat, % 3,6‟sı haftada birkaç gün ve % 3‟ü ise haftada birkaç saat veya daha az bilgisayar kullandıklarını ifade etti. Bu kullanıcıların bilgisayarı düzenli olarak kullandıklarını göstermektedir.
Sonuçlar, katılımcıların öz-yeterlilik algısının genelde bütün maddelerde yüksek olduğunu göstermektedir. Buda bilgisayarın belirli ölçülerde öğretim elemanlarının hayatına girdiğini göstermektedir. Bu konudaki tek istisna, “Günümü / zamanımı planlarken bilgisayarı kullanırım” maddesidir (M= 2.26). Bu, öğretim elemanlarının zamanlarını planlarken bilgisayarı fazla kullanmadıklarını göstermektedir. Bu sonuç, daha önce bu alanda yapılan benzer çalışmalara uymaktadır. Belirli bilgisayar programlardaki kullanma seviyelerine gelince, katılımcılar genelde belirli programlardaki kullanma seviyelerinin iyi olduğunu ifade etmektedir. Göze çarpan şey, katılımcıların en çok iletişim teknolojisinde (e-posta ve internet; M= 4,16 ve M= 4,15) kendilerine güvendiklerini göstermektedir. Bilgisayarı sık sık değişik amaçlar için kullanma konusuna gelince, katılımcılar bu konuda da bilgisayarı interneti taramak, iletişim, ders notlarını hazırlamak, öğrenci sınav kâğıtlarını değerlendirmek, idari maksatlar ve dersleri vermek için bilgisayarı kullandıklarını ifade etmektedirler. Bu konuda da göze ilk çarpan şey, katılımcıların daha çok iletişim teknolojisi (e-posta ve internet) için bilgisayarı sık sık kullandıkları görünmektedir. Ders notlarını hazırlamada, öğretim elemanlarının daha çok internet ve geleneksel kitaplar kullandıkları görünmektedir. Bunu, sırası ile, internet + bilgisayar programları + geleneksel kitaplar; internet + tarayıcı + + geleneksel
kitaplar; internet + tarayıcı + bilgisayar programları + geleneksel kitaplar; ve internet + video + bilgisayar programları + geleneksel kitaplar takip etmektedir. Dersi vermeye gelince, öğretim elemanlarının en çok bilgisayar projektörü ve siyah/beyaz tahta kullandıkları görünmektedir. Bunu, sırası ile, siyah/beyaz tahta; projektör + video + siyah/beyaz tahta ve projektör takip etmektedir.
Aynı zamanda, istatistiksel olarak, katılımcıların (a) öz-yeterlilik algıları, (b) belirli maksatlar için bilgisayar kullanma sıklıkları ve (c) belirli programları kullanma seviyeleri ile değişik bağımsız değişkenler (bilgisayar kullanma süreleri, bilgisayar kullanma sıklıkları, bilgisayara erişimleri ve yaş grupları) arasında bir farklılık tespit edildi. Örneğin, yıl olarak en uzun süre bilgisayar kullanan öğretim elemanları en fazla bilgisayar öz-yeterlilik algısına sahipler. Kullanım süresi düştükçe, bilgisayar öz-yeterlilik algıları da düşmektedir. Aynı şekilde, hem üniversitede hem de evde bilgisayara erişimi olanlar en fazla bilgisayar öz-yeterlilik algısına sahipler. Benzer şekilde, bilgisayarı sık sık kullanan öğretim elemanların belirli bilgisayar programları kullanmada en yüksek seviyede oldukları istatistiksel olarak ispat edildi. İstatiksel olarak, bunların aynı zamanda en yüksek bilgisayar öz-yeterlilik algılarına sahip oldukları ve değişik maksatlar için bilgisayarı en çok kullananlar oldukları da ispatlandı. İlave olarak, en genç yaş grubuna giren öğretim elemanlarının (21-30 yaş grubu) bilgisayarı belirli maksatlar için en fazla kullandıkları istatiksel olarak ispatlandı. Bundan başka, etkili kursları düzenlemenin eğitim teknolojileri kullanmada çok faydalı ve gerekli olduğu öğretim elemanları tarafından düşünülürken, yetersiz fiziksel koşullar ve bilişim teknolojileri altyapı eksikliğinin ise eğitim teknolojilerini kullanmalarını çok olumsuz şekilde etkilediği ifade edildi.
Bu sonuçlar, hem araştırma konusu olan üniversite için, hem de henüz fiziksel koşulları ve bilişim teknolojisi altyapısı tamam olmayan Türkiye‟deki ve dünyadaki bütün Yüksek Öğretim Kurumları için pratik tavsiyelerdir. Başka değişle, bu durumda olan bütün Yüksek Öğretim Kurumlarında hem öğretim elemanları hem de öğrenciler için fiziksel koşullar ve bilişim teknolojisi altyapısı en kısa zamanda tamamlanmalıdır ve ilgili bilişim teknolojisinin üniversitelerde etkili ve maksadına uygun olarak kullanılabilmesi için bu amaca yönelik etkili kurslar verilmelidir.
Citation Information:
Türel, V. (2013). The use of educational technology at tertiary level. Hacettepe Üniversitesi Eğitim Fakültesi Dergisi