GLYCOSYLATION: A TOOL FOR ENGINEERING PROTEIN
BASED MATERIALS
A DISSERTATION SUBMITTED TO
THE GRADUATE SCHOOL OF ENGINEERING AND SCIENCE
OF BILKENT UNIVERSITY
IN PARTIAL FULFILLMENT OF THE REQUIREMENTS FOR
THE DEGREE OF
MASTER OF SCIENCE
IN
MATERIALS SCIENCE AND NANOTECHNOLOGY
By
MUSA EFE IŞILAK
SEPTEMBER 2019
ABSTRACT
GLYCOSYLATION: A TOOL FOR ENGINEERING PROTEIN
BASED MATERIALS
Musa Efe IŞILAK
M.Sc. in Materials Science and Nanotechnology
Advisor: Urartu Özgür Şafak Şeker
September, 2019
Biofilms are bacterial communities formed by adhesion of cells to each other via extracellular matrix. Proteins, one of the components of biofilm matrix, can form fibers and have properties enabling their use as materials. Bacillus subtilis biofilm major protein TasA is a fiber forming non-amyloidogenic protein providing biofilm rigidity. Glycosylation is a post-translational modification observed in all domains of life where sugar groups are added on proteins covalently. Campylobacter jejuni glycosylation is the first bacterial N-linked glycosylation discovered and the most studied system where a heptasaccharide is attached to protein. C. jejuni glycosylation has variety of functions among adhesion, protease resistance and thermal stability. Glycosylation may become an additional method for engineering biofilm proteins as materials with unique properties. For this purpose, we examined effect of
glycosylation on structure of natively non-glycosylated proteins by glycosylating alkaline phosphatase enzyme (ALP) at different locations on the protein.
Interestingly, phosphatase activity assay showed slight increase in ALP activity on pure proteins glycosylated at the C-terminus. Next, TasA protein was glycosylated at the C-terminus. Glycosylation had no significant effect on fibrillation of TasA in vitro. Secondary structure analysis using circular dichroism data revealed shift from antiparallel to helix structure with glycosylation. Quartz crystal microbalance
experiments indicated increased adhesive properties on glycosylated TasA protein on gold. Its application possibility as cell adhesive was assessed by visualizing surface coverage of polystyrene cell culture plate under scanning electron microscope. As a consequence, glycosylation was used as an engineering method for protein-based material development for the first time.
ÖZET
GLİKOZİLASYON: PROTEİN TABANLI MALZEME
GELİŞTİRMEDE YENİ BİR ARAÇ
Musa Efe IŞILAK
Malzeme Bilimi ve Nanoteknoloji, Yüksek Lisans
Tez Danışmanı: Urartu Özgür Şafak Şeker
Eylül, 2019
Biyofilmler bakterilerin kendi ürettikleri ekstrasellüler matriks sayesinde birbirlerine yapışmalarıyla oluşturdukları bakteriyel topluluklardır. Biyofilm matiksini oluşturan ana bileşenlerden olan proteinler fiber oluşturma yetisine sahip olmalarının yanında malzeme olarak kullanılabilirliğini sağlayan özelliklere sahiptir. Bacillus subtilis biyofilminin temel protein bileşeni olan TasA, amiloid olmayan fiber oluşturabilen ve biyofilmin sertliğini sağlayan bir proteindir. Proteinlere kovalent bağ ile şeker grupları eklenen glikozilasyon, yaşamın her alanında gözlenebilen bir
posttranslasyonel modifikasyondur. Campylobacter jejuni glikozilasyon sistemi bakterilerde keşfedilen ilk N-bağlı glikozilasyon olmak ile birlikte üzerinde en çok araştırma yapılan sistemdir. C. jejuni glikozilasyonu adezyon, proteaz kormuası ve termal stabiliteyi de içeren çeşitli bir görev listesine sahiptir. Glikozilasyon, biyofilm proteinlerinin malzeme olarak kullanılmak üzere geliştirilirken onlara benzersiz özellikler kazandırmada kullanılabilecek bir araç haline getirilebilir. Bu amaçla, glikozilasyonun doğal halinde glikozile olmayan proteinlerin yapısı üzerindeki
edilmiştir. Beklenmeyen bir şekilde C-terminalinden glikozile edilen ALP fosfataz aktivitesi testinde daha yüksek aktivite göstermiştir. Sonrasında, TasA proteini C-terminalinden glikozile edilmiştir. Glikozilasyonun in vitro TasA fibrilasyonu üzerinde anlamlı bir etkisi olmamıştır. Dairesel dikroizm spektroskopi verilerinden elde edilen ikincil yapı analizi, glikozilasyonun antiparalel beta levhalardan
sarmallara geçişe neden olduğunu göstermiştir. Kuvars kristal mikrobalans deneyleri glikozile TasA proteininin altın üzerinde daha yüksek yapışkanlığa sahip olduğunu göstermiştir. Hücre yapışkanı olarak kullanılması ihtimalinin irdelenmesi için
polistren hücre kültürü plakalarının yüzeyini kaplaması taramalı elektron mikroskopu ile görüntülenmiştir. Sonuç olarak glikozilasyon ilk defa protein tabanlı malzeme geliştirme amacıyla kullanılmıştır.
ACKNOWLEDGEMENTS
Initially, I would like to express my gratitude to Dr. Urartu Özgür Şafak Şeker for being my advisor. He is the most wise, clever, honest, fair and patient person I have ever known. I will always remember him and his teachings both in science and life. I also thank Dr. Esra Yüca for helping me finding my way when I didn’t know what to do.
I manifest my sincere gratefulness to jury members Dr. Özlen Konu and Dr. Ayşe Gül Gözen for their time reviewing this work. I would like to thank Dr. Özlen Konu specially since she was the one who started my scientific career and she is still here at the end.
I thank Dr. Raffaele Mezzenga and Dr. Jozef Adamcik for their help and kindness for letting us use their facility and helping with AFM data acquisition and procession.
I cannot thank Ebru Kehribar, my friend, my mentor, enough. She helped me with purification, dialysis and western blots. When I failed AFM miserably, she went to Switzerland to learn and perform AFM properly. She analyzed all the AFM data. She performed the CD and QCM experiments after I leave to become a farmer. I thank Büşra Merve Kırpat for helping me with biofilm protein clonings.
I thank all current and past Synthetic Biosystems Laboratory members, Behide Saltepe, Büşra Merve Kırpat, Cemile Elif Özçelik, Çisil Köksaldı, Dr. Ebuzer Kalyoncu, Dr. Elif Duman, Gökçe Özkul, Julian Ostaku, Merve Erden, Merve Yavuz, Nedim Hacıosmanoğlu, Özge Beğli, Recep Erdem Ahan, Sıla Köse, Side Selin Su Saraylı, Dr. Tolga Tarkan Ölmez and Zafer Koşar.
I also thank all UNAM personnel but especially Zeynep Erdoğan for not only for helping with HPLC, CD, ITC etc. but also being a friend, an older sister. I thank the management staff of UNAM who made my time in UNAM a fun experience. Especially Ayşegül Torun and Duygu Kazancı.
I cannot thank my family enough for supporting me. I am so grateful to have my mom Arzu Dinçer and step-father Hasan Dinçer, step-mother Gülten Işılak and father İbrahim Işılak, my sisters Meltem Deniz Dinçer and Miyase Dinçer and my brother Doruk Ege Işılak. I don’t think I could have any better family.
I feel so lucky to have my best friends who helped me discover myself Cenk Ecir and Burak Can Burul. I will never forget the fun experiences we had. I am so happy to know the kindest and the most thoughtful person Özge Beğli who was my emotional support in UNAM. I thank Fatma Elçin Kınıklı to be my friend. I am so grateful for the times we spent together having fun and fights.
Finally, I am sincerely happy and thankful to know the people who I shared the best times of my life and made our student house our “The Nest”, Meltem Deniz Dinçer and Mertcan Babacan. They were always there when I needed. They tolerated all my bad behaviors and made them disappear, partially. I am sure they will always have a special place in my life.
This work was made possible by the funding from TÜBİTAK project number 216M127.
TABLE OF CONTENTS
CHAPTER 1 ... 1
INTRODUCTION ... 1
1.1 Protein Component of Biofilms ... 1
1.2 Bacillus subtilis Biofilm Major Protein TasA ... 3
1.3 Bacterial Glycosylation ... 5
1.4 Campylobacter jejuni N-linked Glycosylation ... 6
1.5 The Aim: Engineering TasA using glycosylation for material applications 13 CHAPTER 2 ... 16
MATERIALS AND METHODS ... 16
2.1 Cloning and Transformation ... 16
2.2 Protein Expression ... 18
2.3 Protein Extraction from Periplasmic Space ... 19
2.4 SDS-PAGE, Coomassie Blue Staining, Western Blot and Lectin Blot ... 19
2.5 Alkaline Phosphatase Activity Assay ... 21
2.6 Immobilized Metal Affinity Chromatography Purification and Size Exclusion Chromatography ... 21
2.7 Transmission Electron Microscopy ... 22
2.9 Circular Dichroism ... 23
2.10 Quartz Crystal Microbalance ... 23
2.11 Scanning Electron Microscopy ... 24
CHAPTER 3 ... 25
RESULTS AND DISCUSSION ... 25
3.1 Assessment of Structural Effects of Glycosylation Location on an Enzyme, ALP 25 3.1.1 Design and Cloning of the Constructs... 25
3.1.2 Expression, Purification and Activity Assay of ALP... 32
3.2 Assessment of Effects of Glycosylation Biofilm Protein, TasA Characteristics ... 40
3.2.1 Design and Cloning of the Constructs... 40
3.2.2 Expression and Purification of Glycosylated TasA ... 43
3.2.3 Assessment of Effects of Glycosylation on TasA Fibrillation ... 48
3.2.4 Assessment of Effects of Glycosylation on TasA Secondary Structure 57 3.2.5 Assessment of Effects of Glycosylation on TasA Adhesiveness ... 62
3.2.6 Assessment of Glycosylation as a Modification Method for Protein Based Materials ... 63
CHAPTER 4 ... 66
CONCLUSION ... 66
4.1 REFERENCES ... 68
4.2.1 DNA sequences of genes ... 77 4.3 APPENDIX B ... 84 4.3.1 List of primers ... 84 4.4 APPENDIX C ... 86 4.4.1 Plasmid maps ... 86 4.5 APPENDIX D ... 90
4.5.1 Sanger sequencing results ... 90
4.6 APPENDIX E ... 92
LIST OF TABLES
Table A1. Nucleotide sequences of phoA-DQNAT, DQNAT-phoA and
tasA-DQNAT genes. ... 77
Table B1. Sequences of the primers used for cloning ALP-DQNAT, DQNAT-ALP and TasA-DQNAT ... 84
Table E1. Amino acid sequences of ALP-DQNAT, DQNAT-ALP and
LIST OF FIGURES
Figure 1: Illustration of biofilm... 2 Figure 2: Illustration of protein glycosylation. ... 6 Figure 3: Illustration of C. jejuni pgl glycosylation machinery. (Li et al., 2017;
Linton et al., 2005; Tan et al., 2015) ... 8 Figure 4: Illustration of the study workflow. ... 15 Figure 5: Schematic representation of the designed constructs of phoA genes. ... 26 Figure 6: Agarose gel electrophoresis image of ALP-DQNAT PCR for cloning. .... 27 Figure 7: Agarose gel electrophoresis image of ALP-DQNAT and pET-22b(+) DNA fragments double digested with XbaI and XhoI. ... 28 Figure 8: Alignment result of ALP-DQNAT Sanger sequencing. ... 28 Figure 9: Agarose gel electrophoresis image of first DQNAT-ALP PCR for cloning. ... 29 Figure 10: Agarose gel electrophoresis image of second DQNAT-ALP PCR for cloning. ... 30 Figure 11: Agarose gel electrophoresis image of DQNAT-ALP and pET-22b(+) DNA fragments double digested with XbaI and XhoI. ... 31 Figure 12: Alignment result of ALP-DQNAT Sanger sequencing. ... 31 Figure 13: SDS-PAGE Coomassie blue staining of proteins extracted from DQNAT-ALP and DQNAT-ALP-DQNAT expressing cells’ periplasm in the presence and absence of pgl-pACYC. ... 33 Figure 14: Western blot of proteins extracted from DQNAT-ALP and ALP-DQNAT expressing cells’ periplasm in the presence and absence of pgl-pACYC. ... 34
Figure 15: SBA lectin blot of proteins extracted from DQNAT-ALP and
ALP-DQNAT expressing cells’ periplasm in the presence and absence of pgl-pACYC. .. 35 Figure 16: pNPP assay result of proteins extracted from DQNAT-ALP and ALP-DQNAT expressing cells’ periplasm in the presence and absence of pgl-pACYC. .. 36 Figure 17: SDS-PAGE Coomassie blue staining image of protein fractions (1-6) from IMAC and SEC purification of DQNAT-ALP and ALP-DQNAT expressing cells in the presence and absence of pgl-pACYC. ... 37 Figure 18: SBA lectin blot image of protein fractions (1-6) from IMAC and SEC purification of DQNAT-ALP and ALP-DQNAT expressing cells in the presence and absence of pgl-pACYC. ... 38 Figure 19: pNPP activity assay of protein fractions from IMAC and SEC purification of DQNAT-ALP and ALP-DQNAT expressing cells in the presence and absence of pgl-pACYC. ... 39 Figure 20: Schematic representation of the designed constructs of tasA gene. ... 41 Figure 21: Agarose gel electrophoresis image of pET-22b(+) PCR for cloning. ... 41 Figure 22: Agarose gel electrophoresis image of TasA-DQNAT PCR for cloning... 42 Figure 23: Alignment result of ALP-DQNAT Sanger sequencing. ... 43 Figure 24: SDS-PAGE Coomassie blue staining image of whole cell extracts
expressing TasA-DQNAT in the absence (-Gly) and presence (+Gly) of pgl-pACYC. ... 44 Figure 25: Western blot image of whole cell extracts expressing TasA (WT), TasA-DQNAT in the absence (-Gly) and presence (+Gly) of pgl-pACYC. ... 45 Figure 26: SBA lectin blot image of whole cell extracts expressing TasA-DQNAT in the absence (-Gly) and presence (+Gly) of pgl-pACYC. ... 46
Figure 27: SDS-PAGE Coomassie blue staining and SBA lectin blot images of wild type TasA (WT), TasA-DQNAT expressed in the absence of pgl-pACYC (-Gly) and TasA-DQNAT expressed in the presence of pgl-pACYC (+Gly) proteins at different purity states. ... 48 Figure 28: TEM images of fibers formed by IMAC purified wild type TasA in vitro ... 49 Figure 29: AFM images of fibers formed by IMAC and SEC purified wild type TasA, non-glycosylated and glycosylated TasA-DQNAT proteins in vitro. Scale bar: 500nm ... 50 Figure 30: Quantification of height of fibers formed by IMAC and SEC purified wild type TasA, non-glycosylated and glycosylated TasA-DQNAT proteins in vitro ... 51 Figure 31: Distribution of fiber height formed by IMAC and SEC purified wild type TasA, non-glycosylated and glycosylated TasA-DQNAT proteins in vitro... 52 Figure 32: Quantification of length of fibers formed by IMAC and SEC purified wild type TasA, non-glycosylated and glycosylated TasA-DQNAT proteins in vitro ... 53 Figure 33: Distribution of fiber length formed by IMAC and SEC purified wild type TasA, non-glycosylated and glycosylated TasA-DQNAT proteins in vitro... 54 Figure 34: AFM images of fibers formed by IMAC purified non-glycosylated and glycosylated TasA-DQNAT proteins in vitro. Scale bar: 500nm ... 55 Figure 35: Quantification of height of fibers formed by IMAC purified
non-glycosylated and non-glycosylated TasA-DQNAT proteins in vitro ... 56 Figure 36: Quantification of length of fibers formed by IMAC purified
non-glycosylated and non-glycosylated TasA-DQNAT proteins in vitro ... 57 Figure 37: CD spectroscopy data and secondary structure analysis of IMAC purified wild type TasA with different incubation times. ... 58
Figure 38: CD spectroscopy data and secondary structure analysis of IMAC purified
non-glycosylated TasA-DQNAT with different incubation times. ... 59
Figure 39: CD spectroscopy data and secondary structure analysis of IMAC purified glycosylated TasA-DQNAT with different incubation times. ... 61
Figure 40: KD values of IMAC purified 30-days incubated wild type TasA, non-glycosylated and non-glycosylated TasA-DQNAT on gold coated QCM sensors ... 63
Figure 42: SEM images and EDS analysis of IMAC purified wild type TasA (A), non-glycosylated (B) and glycosylated (C) TasA-DQNAT coated on silica surface. 64 Figure 43: SEM images and EDS analysis of IMAC purified wild type TasA (A), non-glycosylated (B) and glycosylated (C) TasA-DQNAT coated on polystyrene cell culture plate surface. ... 65
Figure C1. Schematic representation of ALP-DQNAT-pET22b(+). ... 86
Figure C2. Schematic representation of DQNAT-ALP-pET22b(+) plasmid. ... 87
Figure C3. Schematic representation of TasA-DQNAT-pET22b(+) plasmid. ... 88
Figure C4. Schematic representation of pgl-pACYC plasmid... 89
Figure D 1. Sequencing result of ALP-DQNAT-pET22b(+) ... 90
Figure D 2. Sequencing result of DQNAT-ALP-pET22b(+) ... 91
CHAPTER 1
INTRODUCTION
1.1 Protein Component of Biofilms
Under certain circumstances, almost any bacteria have ability to switch into biofilm mode where multiple aggregated microorganisms live together in an extracellular matrix. (Figure 1) The multicellular lifestyle enables bacteria to form their own habitat where organisms have higher interaction and environmental resistance. Depending on the species of the bacteria forming the biofilm, it can adhere to different surfaces such as metal, epithelia, liquid surface or plant roots. Biofilm extracellular matrix is mostly comprised of protein, polysaccharide, DNA and lipids.(Flemming et al., 2016)
Protein component of the biofilm mainly exists as fibers called functional amyloid fibers and forms the biofilm matrix scaffolds.(Taglialegna, Lasa, & Valle, 2016) The scaffold bestows stability and rigidity to the biofilm. Moreover, in order the proteins to form fibers, certain environmental criteria must be met so that structurally stable biofilm formation can start. Having proteins as the structural scaffold results in another regulatory checkpoint.
Figure 1: Illustration of biofilm.
Traditionally, amyloid fibers are disease causing insoluble fibers with cross-ß structure. These fibers are usually resistant to heat, SDS, pH and proteases. Cross-ß structure which facilitates the resistivity, is formed by ß-sheets stack on top of each other vertically along the fiber. Both Van der Waals interactions between the ß-sheets and hydrogen bonds formed by amide and carboxyl groups of the side chain are responsible for the exceptional stability of the amyloid fibers. Functional amyloid fiber term in biofilm matrix is broadened to include different fiber forming protein structures.(Erskine, MacPhee, & Stanley-Wall, 2018)
Fiber forming amyloid and non-amyloid proteins and peptides can be used as
materials. These proteins can be further functionalized both genetically a chemically so that fibers with endless array of characteristics can be produced resulting in their potential application in any field imaginable. Currently, the most promising fields for using functional amyloid fibers as advanced materials appear to be tissue
1.2 Bacillus subtilis Biofilm Major Protein TasA
Differentiation of motile Non-pathogenic gram-positive bacteria Bacillus subtilis cells into adhering matrix producing cells initiates the biofilm where
heterophenotypic cells with different responsibilities live. (Vlamakis, Chai,
Beauregard, Losick, & Kolter, 2013) The extracellular matrix produced by producer cells is majorly composed of exopolysaccharide (EPS) and TasA. The major protein component of the functional amyloid fibers of B. subtilis biofilm is TasA. Deletion of TasA does not result in complete loss of biofilm, rather eliminates the signature wrinkled phenotype. (Dragoš et al., 2018)
B. subtilis biofilm functional amyloid fibers contain occasional TapA as the minor component. It is shown that TapA accelerates fibrillation of TasA in vivo and in vitro.(Diego Romero, Vlamakis, Losick, & Kolter, 2014) Additionally, TasA is connected to cell via cell wall located TapA protein. Enabling cells to be released with less energy in case of biofilm dispersal since amyloid structure is highly stable. (Gras & Claessen, 2014) Although EPS and TasA production can occur at
phenotypically differentiated cells in the biofilm, TasA and TapA has to be expressed in the same cell for TasA to function properly in biofilm.(Diego Romero, Vlamakis, Losick, & Kolter, 2011)
Structural determination of protein complexes requires multiple methods for inferring the results as close to the truth as possible. Using direct dyes for basic structural prediction can be the initial step due to relative straightforwardness and inexpensiveness. TasA fibers in low pH can be stained with amyloid structure suggesting dyes Thioflavin T and Congo red.(Hobley, Harkins, MacPhee, & Stanley-Wall, 2015) Unlike most common functional amyloid fiber forming proteins, 26 kDa
TasA monomer is globular, water soluble and structured. The protein undergoes conformational changes as it forms ß-sheet rich fibers in acidic conditions.(Diehl et al., 2018) Stable monomeric form of TasA enables self-healing properties which rise its fascination.
TasA fibers classified as functional amyloid fibers due to amyloid structure formation in acidic conditions. However, TasA fiber can also form in native
conditions. Recombinant TasA production allowed more insights into its structure. It revealed that TasA forms non-amyloidogenic fibers contrary to the previous belief increasing its appeal to study.(Erskine, MacPhee, et al., 2018; Erskine, Morris, et al., 2018)
Since TasA has stable monomer form in vitro studies show that recombinant and native TasA purified from B. subtilis biofilm forms fibers in vitro.(Diehl et al., 2018; D. Romero, Aguilar, Losick, & Kolter, 2010) Fibers formed by pure proteins require significantly long time for fibrillation. Additionally, in vitro fibrillation does not result in complete fibers. That is, multiple structural forms of TasA exists as
oligomeric and polymeric state compared to homogeneous fibers observed in native biofilms. Therefore, it is suggested that additional proteins, most likely TapA, and systems may mediate neat fiber formation.(Diego Romero et al., 2014)
B. subtilis biofilm has its signature wrinkled morphology.(Branda, González-Pastor, Ben-Yehuda, Losick, & Kolter, 2001) Wrinkles are caused by rigidity of the biofilm and localized cell deaths.(Asally et al., 2012) The major role of TasA in Bacillus subtilis biofilm is structural integrity by forming rigid fiber networks.(D. Romero et al., 2010) Knock-out experiments of TasA result in less rigid B. subtilis biofilm without wrinkles. Additionally, TasA has antimicrobial activity as its name, translocation-dependent antimicrobial spore component, suggests.(Hobley et al.,
2015; Stöver & Driks, 1999) TasA interacts differently with bacterial and eukaryotic membrane so that bacterial membrane causes TasA to form disordered aggregates which may explain its antimicrobial activity.(Malishev, Abbasi, Jelinek, & Chai, 2018)
Biofilms are emerging as promising materials due to self-healing properties and relatively easier functionalization via genetic engineering. 3D printing technology enables B. subtilis biofilm as functional living material with specific 3D
shape.(Huang et al., 2019) Another highly desired property of biofilm is its adherence. Therefore, increasing adhesive capacity of biofilm can be achieved genetically functionalized biofilm proteins. Fusion of intrinsically highly adhesive protein domains such as mussel foot protein to biofilm proteins show significantly increased adhesive properties even under water. (Zhang et al., 2019; Zhong et al., 2014)
1.3 Bacterial Glycosylation
Protein glycosylation is the most common form of post-translational modifications cells where saccharide groups are covalently attached to polypeptides. (Figure 2) Protein glycosylation is divided into subgroups based on the amino acid glycans attach to. N-linked glycosylation, carbohydrates are bonded via nitrogen of asparagine, and O-linked glycosylation, glycan is attached via oxygen of serine or threonine, are the most usual protein glycosylation types. All domains of life - Archaea, Bacteria and Eukarya – has protein glycosylation mechanism. Protein glycosylation in prokaryotes is more prevalent than anticipated and not restricted to pathogenic organisms.(Nothaft & Szymanski, 2010; Schäffer & Messner, 2017)
Recently, N-glycosylation in gram-positive bacteria is discovered stretching the boundaries of bacterial glycosylation.(Birhanu et al., 2019) With development of new high-throughput techniques, an increased rate of protein glycosylation discovery in different organisms is expected.(Scott, 2019)
Figure 2: Illustration of protein glycosylation.
Campylobacter jejuni is a helical shaped gram-negative bacteria naturally colonized in bird digestive tract commensally but contaminated poultry is the biggest cause of food related gastroenteritis.(Alemka, Nothaft, Zheng, & Szymanski, 2013) C. jejuni is the first bacteria discovered with N-linked glycosylation.(Szymanski, Yao, Ewing, Trust, & Guerry, 1999; Wacker, 2002) Therefore, together with transfer of C. jejuni protein glycosylation (pgl) operon into Escherichia coli, C. jejuni protein
glycosylation system resulted in being the most extensively studied bacterial glycosylation mechanism.
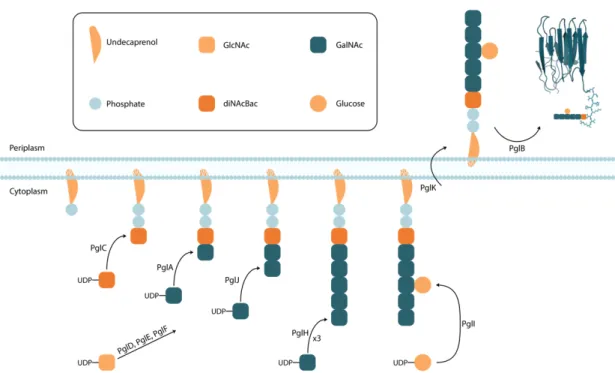
C. jejuni protein N-linked glycosylation pathway is encoded by 17kb long pgl operon containing 12 genes. Synthesis of C. jejuni glycan starts with synthesis of the first sugar donor UDP-N,N'-diacetylbacillosamine (UDP-diNAcBac). For this purpose, PglF dehydratase converts UDP- N-acetylglucosamine (UDP-GlcNAc) to UDP-2-acetamido-2,6-dideoxy- α-D-xylo-4-hexulose followed by PglE aminotransferase transferring an amino group creating UDP-4-amino-4,6-dideoxy-α-D-GlcNAc and finally PglD acetyl transferase completes the reaction creating UDP-diNAcBac. PglC initiates the sequential addition of sugars by transferring UDP-diNAcBac onto undecaprenyl pyrophosphate (Und-P) lipid carrier on the cytoplasm side of inner cell membrane. The addition continues with glycosyltransferases PglA, PglJ and PglH adding one, one and three UDP-N-acetylgalactosamines (UDP-GalNAc) on
respectively. PglH has ability to count GalNAc units so that it transfers exactly three GalNAc.(Ramirez et al., 2018) Addition of sugars is finalized by PglI adding UDP-Glucose onto the first GalNAc added by PglH resulting in a branching. PglK flippase flips the formed Und-P anchored glycan to periplasm. PglB oligosaccharyltransferase (OST) finalizes the protein glycosylation by transferring the glycan en bloc on the nitrogen of asparagine in available D/E-X1-N-X2-S/T (X1 and X2 can be any amino
acid except proline) motif.(Li et al., 2017; Linton et al., 2005; Tan, Tang, & Exley, 2015) (Figure 3)
Figure 3: Illustration of C. jejuni pgl glycosylation machinery. (Li et al., 2017; Linton et al., 2005; Tan et al., 2015)
Eukaryotic and bacterial glycosylation has similarities and differences. In both glycosylation types, lipid-linked oligosaccharides are sequentially assembled in cytoplasm but in eukaryotes assembly and disassembly of glycans continue in endoplasmic reticulum (ER) and Golgi after transfer on protein. The most obvious difference is location of glycosylation where glycans are transferred to proteins, in ER and Golgi of eukaryotic organism compared to periplasm. Although, pglB has sequence similarity with eukaryotic OSTs and all OSTs have conserved mechanism, PglB recognizes D/E-X1-N-X2-S/T motif compared to eukaryotic N-X3-S/T
glycosylation recognition motif (X1, X2 and X3 can be any amino acid except
It is known that OSTs transfer the glycan onto proteins co-translationally while proteins are entering the ER lumen resulting in glycosylation to have effect on the protein folding. On the other hand, it is shown that PglB is effective on the
glycosylation recognition motives on surface exposed flexible sites of acceptor protein suggesting the glycosylation in C. jejuni occurs after protein folding.
However, some native glycosylated C. jejuni proteins have glycosylation sites on the structured sites. PglB competes with protein folding and diffusion for glycosylation of structured sites. Similar to eukaryotic glycosylation, PglB interacts with Sec subunits in C. jejuni to overcome the competition by co-translational
glycosylation.(Silverman & Imperiali, 2016)
Prokaryotic glycosylation appears to be primitive version of eukaryotic glycosylation considering the similarities and differences. Protein glycosylation has similar and different functions in Bacteria and Archaea than Eukarya. Prokaryotic glycosylation has effect on virulence while eukaryotic glycosylation is responsible on recognition. Eukaryotic organisms use glycosylation for subcellular localization which has no purpose for a prokaryote that has no compartmentalization. Proper protein folding and quality control is another responsibility of eukaryotic glycosylation. Recently, C. jejuni glycosylation is revealed to be related with protein quality control machinery increasing functional similarities between prokaryotic and eukaryotic
glycosylation.(Abouelhadid, North, et al., 2019) Moreover, glycosylation is required for appropriate protein function in both eukaryotic and prokaryotic organisms. (Eichler & Koomey, 2017)
C. jejuni protein glycosylation is associated with multiple phenotypes and functions. The most pronounced effect of glycosylation loss is inability of C. jejuni to colonize gut. There are several possible reasons presented for the result. C. jejuni
glycosylation is suggested to enable adherence to epithelial cells as glycosylation deficient cells show hindered adhesion and invasion.(Szymanski, Burr, & Guerry, 2002; Zamora et al., 2018) Additionally, glycosylation increases immune evasion by using glycans as “invisibility cloak”.(Tan et al., 2015) Additionally, C. jejuni
glycosylation is found to protect glycoproteins from gut proteases.(Alemka et al., 2013) Among direct consequences of C. jejuni glycosylation on chicken
colonization and virulence, indirect effects show more fundamental requirement for glycosylation in the physiology. Loss of glycosylation causes stress on the organism resulting in upregulation of stress-related ClpB, GroEL, GroES, GrpE and DnaK proteins suggesting the metabolic need. On the other hand, glycosylation deficient C. jejuni has lower survival capabilities as biofilm is altered, thermal and osmotic resistance is impaired. In addition to altered anaerobic respiration, transport and chemotaxis behavior, specifically activity of Nap nitrate reductase NapAB is lost without the functioning glycosylation mechanism. (Cain et al., 2019) Comparable to eukaryotic glycosylation, C. jejuni glycosylation contributes to formation of secure protein complex and higher thermal stability of multidrug efflux pump.(Abouelhadid, Raynes, Bui, Cuccui, & Wren, 2019)
Adhesive proteins such as mussed foot proteins, spider silk and so on are all heavily glycosylated. It is known that glycosylation is critical for adhesiveness of proteins. Similarly, important adhesion proteins of pathogenic and commensal bacteria are glycosylated.(Latousakis & Juge, 2018) Glycosylation of C. jejuni flagellin mediates autoagglutination which causes cells to adhere to each other and epithelia. C. jejuni flagellin is more heavily glycosylated compared to other proteins. Although, glycosylation of flagellin proteins is the specifically responsible for the
attachment of pseudaminic acid via O-linked glycosylation. (Guerry, 2007; Guerry et al., 2006)
Serine rich repeat proteins (SRRPs) are crucial in adherence and are heavily O-glycosylated. SRRPs form fimbriae-like structures that facilitate adhesion for Gram-positive bacteria. SRRPs are anchored to cell wall at the C-terminus. The
fundamental requirement for SRRPs is having two serine repeat regions constituting most of the protein. Serine repeat regions are the domains where serine amino acid is repeated after every other amino acid mostly threonine, alanine and valine. Adhesion is mediated by non-repeat domains near N-terminus that are species
specific.(Lizcano, Sanchez, & Orihuela, 2012) O-linked glycosylation of SRRPs is required for proper biofilm formation and non-glycosylated SRRPs loose adhesive properties.(Zhu et al., 2016)
Transfer of C. jejuni glycosylation pathway into E. coli initiated engineering and utilization of bacterial glycosylation.(Wacker, 2002) It is possible to cook huge variety of dishes from limited ingredients but diversity in pantry is amplified at the miscellany on the table. Similarly, N-glycosylation enabled a new ingredient in pantry of synthetic biology. That is, it facilitates more ways to engineer organisms and molecules by including saccharides to the repertoire of building blocks next to DNA, RNA and amino acids.(Nothaft & Szymanski, 2019)
Harnessing the bacterial glycosylation machinery has gained significant interest since recombinant glycoconjugate vaccines are highly desired due to high cost difficulty of traditional glycoconjugate vaccine production. Glycoconjugate vaccines show
exceptional effectiveness and safety. C. jejuni glycosylation can be exploited for recombinant glycoconjugate vaccine development and production. As a start, vaccine against C. jejuni is developed since recombinant protein is glycosylated with native
machinery. (Kay, Cuccui, & Wren, 2019; Nothaft et al., 2016) Study on engineering pgl pathway for protein glycosylation with different glycans than C. jejuni. PglB can be engineered to use different glycans for transfer on the target protein. It is proven possible that oligosaccharyltransferase PglB can be engineered to use Salmonella enterica and Staphylococcus aureus glycans for attachment on the acceptor protein.(Ihssen Julian et al., n.d.)
The next highly desired step at engineering pgl for different purposes is eukaryotic glycoprotein especially mammalian glycoprotein production in bacteria. Majority of therapeutic proteins for humans are glycosylated such as antibodies and enzymes. Producing these mammalian therapeutic glycoproteins recombinantly in bacterial cells is most likely to result in easier, less expensive high yield production. (Pandhal & Wright, 2010) Studies show that mammalian like glycosylation can be achieved by including eukaryotic enzymes in bacterial glycosylation. Additionally, PglB can be engineered in order to recognize different, especially mammalian, glycosylation sites for production of eukaryotic glycoprotein production in bacteria.(Clausen, Wandall, Steentoft, Stanley, & Schnaar, 2015)
The opportunity of producing high valued molecules derives the need for efficient production. Production of glycoproteins recombinantly creates another bottleneck which is the glycosylation. Efforts for increasing the efficiency of glycosylation are being conducted on use of different strains and growth conditions as the initial step as in any recombinant protein production. The aim is to stimulate the system to glycosylate the acceptor protein with higher efficiency by increasing availability of required components while eliminating the elements that may interfere with the process.(Caillava et al., 2019; Ding et al., 2019) The next step is to create a special strain for the purpose in line with the considerations for increased flux towards
protein production and glycosylation. Integration of pgl into E. coli genome for decreasing metabolic burden and removing undesired native genes interfering with the pathway resulted in higher glycosylation yield as expected.(Yates et al., 2019) C. jejuni glycosylation efficiency in E. coli for recombinant glycoprotein production can be increased by engineering central carbon metabolism pathways so that more
substrate can be available for pgl system.(Strutton et al., 2019)
More complex approach for increasing efficiency is metabolic engineering where flow of substrates and products are finely tuned in the process similar to a factory. Biology uses same molecules for different purposes resulting in accumulation of certain intermediate molecules in a pathway assembled in another organism resulting in lowered efficiency. Additionally, regulation is crucial in a native metabolic
process but may result in decreased yield for production. Therefore, optimization of glycosylation pathway demands both acceleration and deceleration of the reaction rates of specific steps.(Natarajan, Jaroentomeechai, Li, Glasscock, & DeLisa, 2018) Cell-free glycosylation enabled researches to observe the process without cross-talk so that optimization can be performed with better understanding.(Jaroentomeechai et al., 2018)
1.5 The Aim: Engineering TasA using glycosylation for material
applications
The ability of protein glycosylation affecting protein structure and function dramatically, as well as, depending on non-linear glycan sequence may enable a toolbox box with virtually infinite possibilities for protein engineering. Additionally,
for engineering proteins for material applications. Since biofilms proteins form adhesive fibers with structural rigidity and robustness, their de novo glycosylation may increase its adhesiveness and change its properties so that feasibility TasA protein to be used as a material may rise especially in cell culture and tissue engineering applications.
To test this hypothesis, we followed the workflow next. First, proteins were expressed in the E. coli cells containing the pgl pathway which we expected to results in glycosylation of the proteins. Then we purified the proteins and covered the surface for its final application, a cell adhesive in this instance. (Figure 4)
CHAPTER 2
MATERIALS AND METHODS
2.1 Cloning and Transformation
Plasmids to be constructed were designed and visualized using online Benchling tool. Using the same tool, restriction digestion sites were found and primers were designed.
DNA parts were amplified using Q5 High-Fidelity DNA polymerase (New England Biolabs Inc.) with following the company's protocol. Primers utilized in the reactions can be found in Table B2. The reactions were performed in BioRad Thermocycler with reaction conditions recommended by manufacturer of the enzyme. Annealing temperatures of each primer (Table B2) was calculated using New England Biolabs Tm calculator tool ignoring the overhang sequence.
PCR products combined with 6X Purple loading dye (New England Biolabs Inc.) were loaded on 1% agarose gels produced by heating 1% (w/v) of agarose in 1X TAE buffer and dyed with SYBR Safe (Life Technologies Corporation) and cast on agarose gel electrophoresis tanks. Agarose gel electrophoresis was executed by running gels on 140V until sufficient separation of dye was observed, approximately 30 minutes. 2-log or 50kb DNA ladders (New England Biolabs Inc.) were used as the ladder.
Desired bands were excised while visualizing on blue LED light. DNA was isolated from the gel using NucleoSpin Gel and PCR Clean-up (Macherey-Nagel GmbH & Co.) kit and manufacturer’s protocol was followed. Purity and concentration of the extracted DNA was checked using Nanodrop spectrophotometer (Thermo Fisher). Products were kept at -20°C.
Restriction digestion was performed as manufacturer New England Biolabs
recommended. Digested DNA fragments were run on agarose gel and obtained from the gel using NucleoSpin Gel and PCR Clean-up (Macherey-Nagel GmbH & Co.) if the clipping were longer than 50bps, otherwise NucleoSpin Gel and PCR Clean-up (Macherey-Nagel GmbH & Co.) was used without agarose gel electrophoresis as suggested by the manufacturer. Purity and concentration of the extracted DNA was tested using Nanodrop spectrophotometer (Thermo Fisher). Products were kept at -20°C.
Digested DNA pieces with compatible sticky ends were ligated using T4 DNA ligase (New England Biolabs Inc.) following the producer's recommendations. All of the ligation reaction was used in transformation of chemically component E. coli DH5a PRO cells.
The competent cells were prepared by growing cells from frozen glycerol stocks overnight in LB at 37°C with shaking. Then, cells were 1/100 diluted in fresh LB and incubated at 37°C with shaking until OD600 was between 0.4 and 0.6. Then cells
were centrifuged at 10,000 g for 10 minutes at 4°C and resuspended in ice cold TSS buffer with volume 10-fold less than the initial LB. The competent cells were aliquoted and stored at -80°C.
Transformation of chemically competent cells were started by thawing the cells on ice followed by addition of DNA. Cells incubated on ice for 30 minutes and heat
shocked by incubating at 42°C for 90 seconds followed by incubation on ice for 2 minutes. 1mL of LB at room temperature was added and incubated at 37°C for 1 hour. If the selective antibiotic was ampicillin, this incubation step was ignored. Then cells were centrifuged at 13,000g for 30 seconds and most of the supernatant was discarded. Cells were resuspended back in remaining liquid and spread on LB-agar plate with appropriate antibiotic. Plates incubated at 37°C overnight.
Random four colonies were selected for testing the success of cloning using colony PCR. Two colonies showing expected results were grown overnight at 37°C with shaking. Next day cells were harvested and miniprep was executed using Genejet plasmid miniprep kit (Thermo Scientific) following the manufacturer’s instructions. Plasmids were sent to Genewiz for Sanger sequencing. Sequencing results were visualized and alignment was performed using Benchling.
2.2 Protein Expression
Sequence verified plasmids were transformed into chemically competent E. coli BL21 (DE3) cells containing pgl-pACYC plasmid or cells not containing the plasmids. Then, a random colony was selected and grown overnight in LB at 37°C with shaking. The grown culture was mixed with 1:1 50% glycerol to store the cells at -80°C. A micropipette tip was dipped into the glycerol stock of cell desired and dropped in ZYM-5052 autoinduction medium prepared by following the instructions of Studier. (Studier, 2005) Cells were auto-induced in ZYM-5052 for 24 hours in 37°C with shaking.
2.3 Protein Extraction from Periplasmic Space
100mL of induced cells were resuspended in 5mL of 30mM Tris (pH 7.5) at 4°C after harvesting. Centrifuged at 6,000g for 15 minutes at 4°C. Supernatant was removed and pellet was resuspended in 30mM Tris (pH 7.5) with 20% sucrose. Incubated in room temperature for 15 minutes and centrifuged at 6,000g for for 20 minutes at 4°C. Supernatant was collected as the extract from periplasmic space.
2.4 SDS-PAGE, Coomassie Blue Staining, Western Blot and Lectin
Blot
Sodium Dodecyl Sulfate – Polyacrylamide Gel Electrophoresis (SDS-PAGE) was accomplished by loading protein samples mixed with 6X gel loading die containing dtt loading on polyacrylamide gel formed by 4% stacking and 15% separating
polyacrylamide gels. If the samples were in native conditions, samples were boiled at 95°C for 10 minutes and loaded on gel and ran at 120V until samples reached
separating gel and 160V until the dye reached the bottom of the gel. Samples in denaturing conditions, that is, containing 6M guanidine were diluted 1:10 with 6x loading dye containing water just before loading on the gel. Then gel was run at 120V until the samples passed through the wells. The run was stopped and wells were washed vigorously with SDS-PAGE running buffer. Rest of the run was performed as usual.
The gel was dropped into the Coomassie blue staining solution and heated in microwave without boiling. The gel was incubated for 1 hour with shaking and transferred into an empty container. Excess dye was washed with water and
destaining solution was added. Gel was incubated until gel and destaining solution became the same color and the solution was replaced with fresh until the background of the solution lost all its color. Then, gel was washed with water and visualized in Chemidoc (Biorad) using Coomassie blue staining settings.
After SDS-PAGE gel was transferred into PVDF membrane using Trans Blot Turbo (Biorad) following the manufacturer’s instructions. The membrane was blocked with 5% milk in TBS-T for 1 hour in room temperature with rocking. Then the membrane was placed in 5% milk in TBS-T containing 1:5000 primary anti-his mouse antibody (Thermo Scientific) and incubated at 4°C overnight with rocking. Next, membrane was washed 5 times with TBS-T for 5 minutes each with shaking. The membrane was placed in 5% milk in TBS-T containing 1:5000 anti-mouse horse-radish
peroxidase conjugated secondary antibody (Abcam) and incubated for 1 hour at room temperature. The membrane was washed 5 times with TBS-T for 5 minutes each with shaking and incubated in ECL substrate (Biorad) following the manufacturer’s protocol. The membrane was visualized using Chemidoc (Biorad) with appropriate settings.
Soy Bean Agglutinin lectin blot was performed as following. After SDS-PAGE gel was transferred into PVDF membrane using Trans Blot Turbo (Biorad) following the manufacturer’s instructions. The membrane was blocked with 5% bovine serum albumin (BSA) in TBS-T for 2 hours with rocking at room temperature. The membrane was transferred into 5% BSA in TBS-T containing 1:2500 horse radish peroxidase conjugated SBA and incubated for 1 hour at room temperature with rocking. The membrane was washed 5 times with TBS-T for 5 minutes each with shaking and incubated in ECL substrate (Biorad) following the manufacturer’s
protocol. The membrane was visualized using Chemidoc (Biorad) with appropriate settings.
2.5 Alkaline Phosphatase Activity Assay
Concentration of protein samples were measured using Pierce bicinchoninic acid (BCA) assay (Thermo Scientific) following the instructions provided by the manufacturer. Each sample was diluted to have equal concentration of proteins. 50µL of sample was mixed with 50µL of 5µM para-Nitrophenylphosphate and immediately started measuring OD405 at 37°C every minute for 20 minutes.
Absorbance versus time graph was drawn and slope of the lines were calculated after fitting the data. Then, ratio of the slopes with the native ALP was compared. T test was used to check for the significance. In case of SEC separated samples, the concentration of each fraction was determined roughly using imageJ on Coomassie blue staining of SDS-PAGE and the data obtained from activity assay was
normalized using the values.
2.6 Immobilized Metal Affinity Chromatography Purification and
Size Exclusion Chromatography
In case of ALP, proteins extracted from periplasmic space was affinity purified using Co-NTA coated HisPur cobal resin (Thermo Scientific) following the manufacturer’s recommended protocol for purification in native conditions. For TasA purifications, auto-induced harvested cells were resuspended in 1X PBS containing 6M guanidine hydrochloride and 20mM imidazole. Then, Tween-20 was added to obtain 0.2%
on 20 seconds off cycle. Samples were centrifuged at 13.000g for 1 hour and supernatant was collected followed by filtration with 0.45µm filter. Filtered lysate was loaded on pre-equilibrated HisTrap nickel colum (GE life sciences) and washed until absorbance at 280nm wavelength of light was stabilized. Finally, eluted with 5 volumes of 1X PBS containing 6M guanidine hydrochloride and 500mM imidazole. Samples were stored at room temperature until dialysis.
Size exclusion chromatography was performed with pre-equilibrated HiPrep 16/60 Sephacryl S-200 HR SEC column (GE lifesciences) on HPLC following the
manufacturer’s guidelines. Fractions with higher absorbance at 280nm and expected time were collected. The mobile phase was selected as the buffer proteins resided in without imidazole, that is, 20 mM sodium phosphate, 0.5 M NaCl, pH 7.4 for ALP while 1X PBS containing 6M guanidine hydrochloride for TasA.
2.7 Transmission Electron Microscopy
Pure TasA proteins were incubated at room temperature for one week and labelled with Ni-NTA coated gold nanoparticles as described previously. (Chen et al., 2014) Carbon coated nickel TEM grids with 200 mesh were placed coated side down on 20µL of sample for minutes. Grids moved to 30µL of water droplet then selective binding buffer (1X PBS 0.487M NaCl, 80mM imidazole and 0.2% Tween-20) and moved to 60µL of selective binding buffer containing 10nM 5nm Ni-NTA-AuNP droplet. Covered with petri dish and inoculated at room temperature for 90 minutes. Grids washed with selective binding buffer for 5 times and twice with PBS and twice with water. Then grids were placed on 2% uranyl acetate for 15-30 seconds for
staining. Uranyl acetate was cleaned using lint-free tissue and grids were air dried. The samples were visualized using TEM (FEI Tecnai) at 200kV power setting.
2.8 Atomic Force Microscopy
100 µl of pure protein samples incubated for the said amount of time were incubated for 3 minutes on freshly cleaved mica surface. Treated mica was rinsed with ddH2O, then dried with nitrogen stream. The AFM was operated at tapping mode using silica tip.
The acquired images are used for height and length analysis of selected fibers with open source software FiberApp. The software was used as described previously. (Usov & Mezzenga, 2015)
2.9 Circular Dichroism
200µL of pure proteins were added in 0.1cm rectangular CD cells. The CD spectra of each sample was measured from 300nm to 190nm of wavelength light 5 times and average was calculated (Jasco J-815). Obtained data was analyzed using Bestsel online tool for secondary structure analysis. (Micsonai et al., 2018, 2015)
2.10 Quartz Crystal Microbalance
Pure proteins were diluted into 1µM, 2µM, 5µM and 10µM samples and sonicated at sonic bath just before use. QCM sensor was equilibrated with thee buffer proteins were residing in. F1, F3, F5, F7, F9, F11 and F13 harmonics were collected during the experiments on QSense explorer QCM device with gold coated sensor (Biolin
sample cycles with increasing concentration of proteins at 27µL/minute flow rate. The sensor was cleaned with basic piranha solution (1:3 Hydrogen peroxide : Ammonia) at 70°C before each different protein. The data was modelled using Qsense Dfind program (Biolin scientific) following the guidelines. The model with the best fit was chosen.
2.11 Scanning Electron Microscopy
Small pieces from silica wafer and polystyrene cell culture plate was cut. The pieces were washed vigorously with isopropanol, ethanol and water. 20µL of protein
samples were placed on the pieces mounted on SEM stubs and incubated overnight at room temperature and let dry. Pieces were washed 3 times with water air dried. Samples were sputtered to cover with 5nm of gold palladium alloy and visualized under environmental scanning electron microscopy (FEI Quanta 200 FEG) with varying voltages from 5 to 10kV. Energy dispersion X-ray spectroscopy was performed at 10kV with EDS (EDAX) accessory on the SEM.
CHAPTER 3
RESULTS AND DISCUSSION
3.1 Assessment of Structural Effects of Glycosylation Location on
an Enzyme, ALP
3.1.1 Design and Cloning of the Constructs
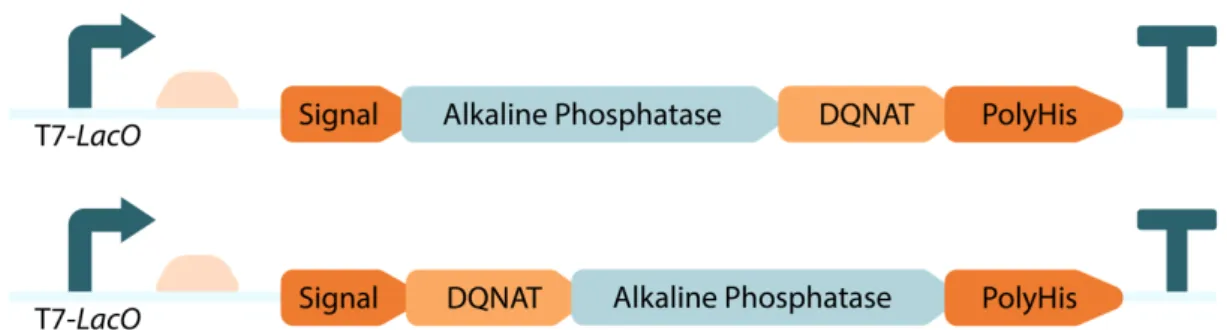
Our laboratory had E. coli DH10B cells containing pgl-pACYC kindly gifted by Markus Aebi. Since, DH10B cells are not as efficient as BL21 (DE3) cells at protein production, we planned to transform the pgl-pACYC plasmid into E. coli BL21 (DE3) cells. Initially, we tried chemical transformation without any success due to its large size. Transformation of the plasmid via electrotransformation was effective. In order to get familiar with and optimize the glycosylation process, we selected E. coli alkaline phosphatase (ALP) reporter enzyme as the “playground”. The phoA gene expressing ALP was designed to include glycosylation motif (DQNAT) at different locations to determine the possible effects of glycosylation at different sites. (Figure 5) Designed constructs included phoA gene expressed under T7-LacO
promoter on pET-22b (+) plasmid. Native periplasmic localization signal of phoA was located at the N-terminus of the gene and a polyhistidine-tag was located at the
purification and detection via western blot using anti-6xhis antibodies. DQNAT motif was genetically included into one of the engineered enzyme designs at N-terminus after the localization signal and in the other design at the C-N-terminus before the polyhistidine-tag which we will refer as DQNAT-ALP and ALP-DQNAT
respectively.
Figure 5: Schematic representation of the designed constructs of phoA genes.
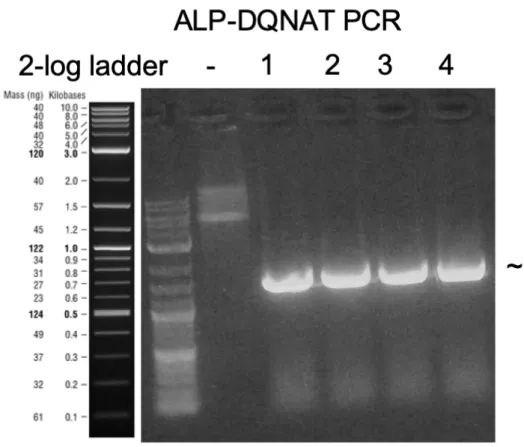
We added DQNAT motif of the ALP-DQNAT by polymerase chain reaction (PCR) on native phoA gene using primers with overhangs containing the DQNAT sequence. (Figure 6) PCR fragments with expected size were extracted from agarose gel.
Figure 6: Agarose gel electrophoresis image of ALP-DQNAT PCR for cloning.
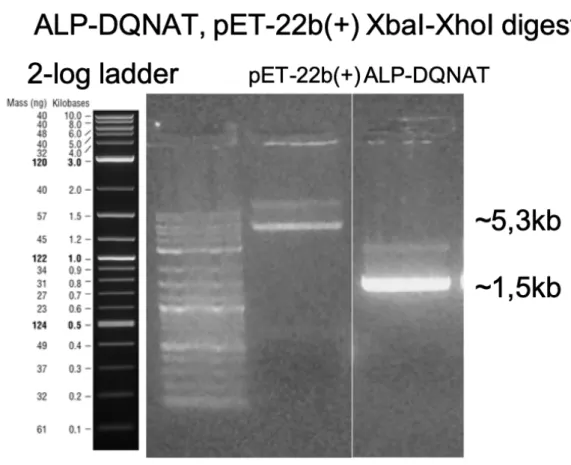
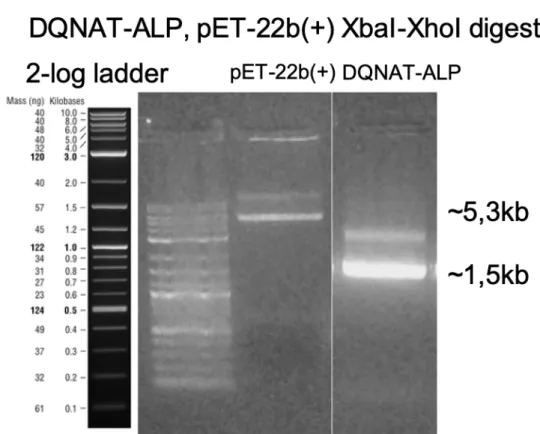
We double digested pET22b (+) plasmid and ALP-DQNAT PCR fragments with XbaI and XhoI restriction endonucleases. (Figure 7) We ran digested DNA
fragments on agarose gel electrophoresis and extracted the fragments with expected sizes.
Figure 7: Agarose gel electrophoresis image of ALP-DQNAT and pET-22b(+) DNA fragments double digested with XbaI and XhoI.
We ligated purified DNA fragments with compatible sticky ends together using T4 DNA ligase. As a result, ALP-DQNAT-pET22b (+) plasmid was constructed. We checked the plasmid via Sanger sequencing from T7 terminator region so that DQNAT motif at the 3’ end of phoA gene can be sequenced. The result showed successful addition of DQNAT motif to ALP at the C-terminus. (Figure 8)
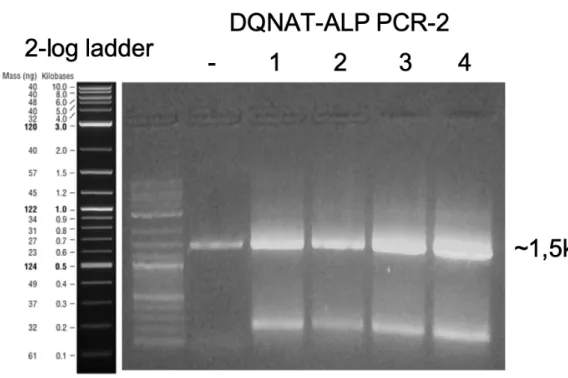
Similarly, we added DQNAT motif of DQNAT-ALP on phoA using PCR with forward primer having DQNAT containing overhang. (Figure 9) We performed agarose gel electrophoresis on the PCR products and extracted the DNA fragments with desired length from the gel.
Figure 9: Agarose gel electrophoresis image of first DQNAT-ALP PCR for cloning.
Since the motif was towards 3’ end to the native localization signal of ALP, another PCR reaction for adding the signal at the 5’ of the fragment was required. We purified the fragments with desired length following PCR and agarose gel
electrophoresis for restriction digestion. (Figure 10) We could add both DQNAT and signal sequence with only one PCR but the length of required forward primer would exceed 100bps.
Figure 10: Agarose gel electrophoresis image of second DQNAT-ALP PCR for cloning.
Same as ALP-DQNAT cloning, we double digested the purified fragments with XbaI and XhoI. Next, we ran the DNA fragments on agarose gel and extracted for next steps. (Figure 11)
Figure 11: Agarose gel electrophoresis image of DQNAT-ALP and pET-22b(+) DNA fragments double digested with XbaI and XhoI.
We ligated digested fragments with compatible sticky ends together using T4 DNA ligase. The expected plasmid to be constructed is DQNAT-ALP-pET22b (+) which expresses ALP with DQNAT at the N-terminus. We checked the plasmid with Sanger sequencing to observe correct addition of DQNAT using T7 promoter primer. (Figure 12)
3.1.2 Expression, Purification and Activity Assay of ALP
The next step after successfully cloning the constructs is to examine for their
functionality. With this purpose, we transformed the sequence verified plasmids into E. coli BL21 (DE3) cells and pgl-pACYC plasmid containing E. coli BL21 (DE3) cells. The cells were auto-induced overnight in ZYM-5052 medium for ALP
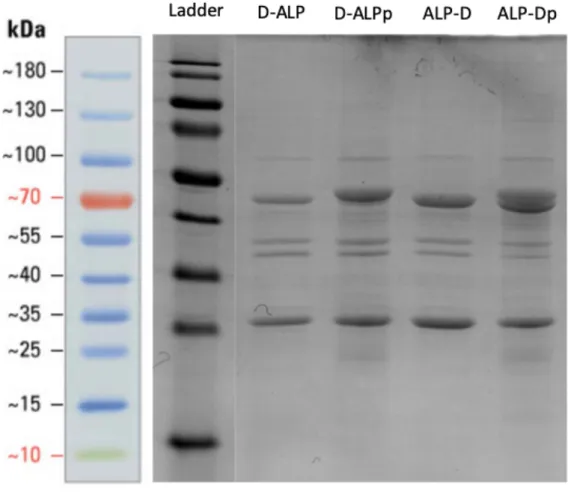
expression. We extracted proteins in periplasmic space using sucrose and performed Coomassie blue staining on the samples after running on SDS-PAGE. (Figure 13) Samples with ALP expressed in the presence of pgl glycosylation pathway had slightly shifted bands with approximately 50kDa suggesting molecular weight increase in a protein which might be caused by the glycosylation.
Figure 13: SDS-PAGE Coomassie blue staining of proteins extracted from DQNAT-ALP and ALP-DQNAT expressing cells’ periplasm in the presence and absence of pgl-pACYC.
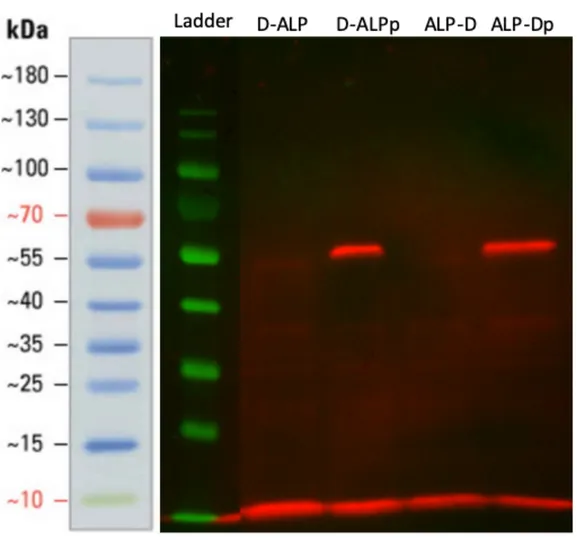
To further investigate the expression of ALP, we performed Western blot using antibodies against polyhistidine tag of ALP. (Figure 14) The result showed
successful expression of DQNAT-ALP and ALP-DQNAT in both with and without presence of pgl pathway. Since the bands present in the western blot were specific to recombinantly expressed ALP with DQNAT, band shift had higher probability to be caused by ALP glycosylation.
Figure 14: Western blot of proteins extracted from DQNAT-ALP and ALP-DQNAT expressing cells’ periplasm in the presence and absence of pgl-pACYC.
After observing the successful expression of ALP with high certainty, we inspected glycosylation status of the proteins using lectin blot. Different from Western blot, lectins, which are proteins with affinity to specific sugar moieties, are used as probes instead of antibodies in lectin blot. In this case, we used soybean agglutinin (SBA) with affinity to terminal GalNAc of C. jejuni glycan for detection of glycosylation. (Figure 15) Visualized PVDF membrane showed successful glycosylation of E. coli alkaline phosphatase enzyme at the N or C terminus with C. jejuni pgl protein glycosylation pathway.
Figure 15: SBA lectin blot of proteins extracted from DQNAT-ALP and ALP-DQNAT expressing cells’ periplasm in the presence and absence of pgl-pACYC.
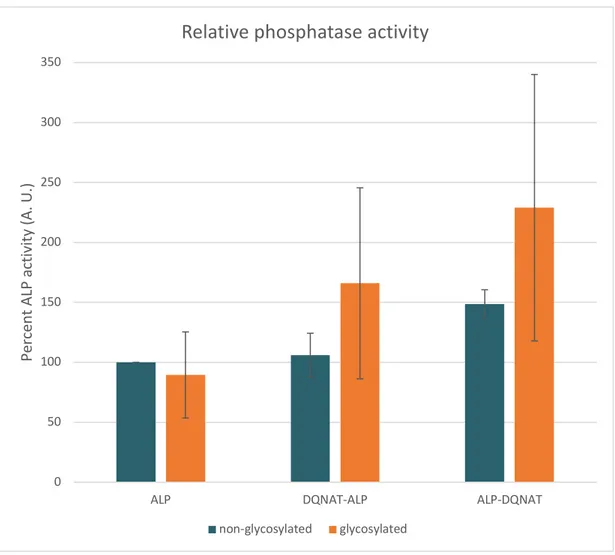
One of the reasons for using an enzyme as target for exploring glycosylation was to be able to directly observe potential detrimental effects of glycosylation on protein structure. Para-Nitrophenylphosphate (pNPP) is substrate of ALP which results in color change due to ALP activity. Therefore, we assessed effect of glycosylation on the protein structure roughly with alkaline phosphatase activity assay. (Figure 16) Data suggested no destructive effect of DQNAT addition or glycosylation at the N and C terminus of ALP or existence of pgl pathway on ALP activity compared to wild type ALP. Surprisingly, DQNAT addition at the C-terminus of ALP increased enzymatic activity.
Figure 16: pNPP assay result of proteins extracted from DQNAT-ALP and ALP-DQNAT expressing cells’ periplasm in the presence and absence of pgl-pACYC.
Coomassie blue staining and Western blot experiments revealed double bands at ALP samples expressed in presence of pgl compared to samples expressed in cells without the glycosylation pathway. As expected, this data hinted incomplete glycosylation, that is, there were non-glycosylated proteins together with
glycosylated proteins. In order to further investigate the unexpected result of higher activity of ALP-DQNAT, we decided to separate the glycosylated and
non-glycosylated proteins as a pure form in the next step. In that regard, we purified 0 50 100 150 200 250 300 350
ALP DQNAT-ALP ALP-DQNAT
Per cen t AL P act ivi ty (A. U. )
Relative phosphatase activity
ALP-DQNAT with IMAC technique initially. Since both glycosylated and non-glycosylated proteins had polyhistidine tag, we further processed IMAC purified samples with size exclusion chromatography (SEC) to separate larger glycosylated ALP from non-glycosylated proteins. We visualize fractions obtained from SEC using Coomassie blue staining following SDS-PAGE revealing a gradual decrease in glycosylated to non-glycosylated protein ratio in each fragment. (Figure 17)
Figure 17: SDS-PAGE Coomassie blue staining image of protein fractions (1-6) from IMAC and SEC purification of DQNAT-ALP and ALP-DQNAT
expressing cells in the presence and absence of pgl-pACYC.
We determined the glycosylation status of each fragment with SBA lectin blot to be certain that one of the double bands purified with IMAC and SEC was indeed the
glycosylated protein. Visualized result verified that one of the bands, most probably the top one, was glycosylated with a glycan containing terminal GalNAc. (Figure 18)
Figure 18: SBA lectin blot image of protein fractions (1-6) from IMAC and SEC purification of DQNAT-ALP and ALP-DQNAT expressing cells in the presence and absence of pgl-pACYC.
We hypothesized that effect of glycosylation on ALP activity should be observed by change in phosphatase activity with changing glycosylated to non-glycosylated ALP ratio in samples. We measured relative ALP activity of each fragment with pNPP assay. (Figure 19) The data showed a positive correlation with glycosylated to non-glycosylated ALP-DQNAT ratio and phosphatase activity with exception of fraction 6.
Although this study is the first and only study glycosylating a recombinant enzyme which is not glycosylated natively with C. jejuni glycosylation machinery, other studies in literature suggest possible thermal stabilizing and protease resistance
functions of the C. jejuni glycosylation which may explain the activity increase of glycosylated ALP. Protease resistance and thermal stability gained potentially by glycosylation may keep more enzymatically active ALP molecules in the sample after long and harsh purification process resulting in higher overall activity in sample even in case the glycosylation may distort the structure and decrease activity of ALP. Further investigation should be conducted to determine the exact cause of the activity increase.
Figure 19: pNPP activity assay of protein fractions from IMAC and SEC
purification of DQNAT-ALP and ALP-DQNAT expressing cells in the presence and absence of pgl-pACYC.
Additionally, we created a construct which had ALP with DQNAT motif at an external loop after amino acid 216. Unfortunately, alteration of the sequence resulted in complete loss of ALP activity. Moreover, proteins did not show any glycosylation.
0 2 4 6 8 10 12 1 2 3 4 5 6 Re la tiv e AL P act ivi ty (A . U .) Fractions 0 0,1 0,2 0,3 0,4 0,5 0,6 0,7 0,8 1 2 3 4 5 6 +G ly: -Gl y Ra tio
(data not shown) Therefore, we did not conduct more experiments using the construct with DQNAT at the middle.
3.2 Assessment of Effects of Glycosylation Biofilm Protein, TasA
Characteristics
3.2.1 Design and Cloning of the Constructs
With the experience gained through glycosylation of ALP, we shifted our focus towards glycosylating biofilm proteins. Since there was no significant advantage or disadvantage of glycosylation at the N or C terminus structurally or in terms of glycosylation, we decided to continue with designs of biofilm proteins having DQNAT at the C-terminus due to relatively easier cloning process. We chose, TasA for being a major biofilm protein and its ability to exist in globular state which may enable easier access by PglB for glycosylation. Construct design of TasA-DQNAT was similar to ALP-DQNAT. (Figure 20) Instead of phoA gene, we used tasA gene and we changed phoA native periplasmic space localization signal into pelB signal sequence as used in pET-22b (+) plasmid. Due to concerns regarding accessibility of DQNAT, we moved DQNAT further at the C terminus after polyhistidine tag so that possibility of DQNAT motif glycosylation to be obstructed by a relatively stiff protein is decreased.
Figure 20: Schematic representation of the designed constructs of tasA gene.
The strategy towards constructing the design was to first create a pET-22b (+) plasmid with pgl glycosylation recognition site after polyhistidine tag. Hence, we added DQNAT motif to pET-22b (+) plasmid via PCR using forward primers with DQNAT at the overhang region. (Figure 21) We ran the PCR product on agarose gel and extracted the bands with desired size.
Figure 21: Agarose gel electrophoresis image of pET-22b(+) PCR for cloning.
After preparing the plasmid backbone, we amplified tasA insert for cloning using PCR. (Figure 22) The template already had polyhistidine tag but restriction
endonuclease recognition site was changed into AvrII for compatibility with the backbone. Agarose gel electrophoresis after the reaction revealed DNA fragments with expected size and we used the bands in DNA purification.
Figure 22: Agarose gel electrophoresis image of TasA-DQNAT PCR for cloning.
We double digested the extracted pET-22b (+) and tasA DNA fragments with SacI and AvrII. After digestion, we removed restriction endonucleases and clippings from the solution using PCR clean-up kit since undesired DNA fragments were shorter than 50bps. We cloned the digested insert and backbone with compatible sticky ends together using T4 DNA ligase. We evaluated the generated plasmids for their
acceptability with Sanger sequencing using T7 terminator primers. (Figure 23) Sequenced construct had expected TasA-DQNAT sequence required for the next experiments.
Figure 23: Alignment result of ALP-DQNAT Sanger sequencing.
3.2.2 Expression and Purification of Glycosylated TasA
We transformed sequence verified plasmids into E. coli BL21 (DE3) cells with or without pgl-pACYC plasmid expressing the C. jejuni glycosylation pathway. Transformed cells were grown overnight in autoinduction medium for expression of TasA-DQNAT. We loaded whole cells on polyacrylamide gel and performed SDS-PAGE. (Figure 24) Coomassie blue staining of the gels revealed no overexpression of the proteins since TasA can form aggregates and toxic fibers.
Figure 24: SDS-PAGE Coomassie blue staining image of whole cell extracts expressing TasA-DQNAT in the absence (-Gly) and presence (+Gly) of pgl-pACYC.
Western blotting the same samples using antibodies against polyhistidine tag revealed slightly messy result. (Figure 25) Number of cells used for SDS-PAGE being excessive and TasA being a fiber forming protein contributed in the smeary result. Nevertheless, obtained result was enough for inferring successful TasA-DQNAT expression in the presence and absence of pgl pathway.
Figure 25: Western blot image of whole cell extracts expressing TasA (WT), TasA-DQNAT in the absence (-Gly) and presence (+Gly) of pgl-pACYC.
After obtaining the smudgy Western blot confirming the expression, we checked the glycosylation status of the protein using SBA lectin blot with fewer cells. (Figure 26) Image of the visualized membrane showed successful glycosylation of
TasA-DQNAT. Interestingly, multiple proteins were glycosylated. We suspected that the multiple bands were shorter fragments of the TasA protein where translation started
from other methionine amino acids since these bands were not observed at any other constructs such as DQNAT-ALP and ALP-DQNAT.
Figure 26: SBA lectin blot image of whole cell extracts expressing TasA-DQNAT in the absence (-Gly) and presence (+Gly) of pgl-pACYC.
Determination of the consequences of glycosylation on TasA properties required pure protein to eliminate interference by other molecules on the environment. Therefore, we lysed the cells expressing wild type TasA, TasA-DQNAT in the presence and absence of pgl glycosylation pathway and performed IMAC
purification in denaturing conditions for the purpose of purifying the recombinant TasA proteins containing polyhistidine tag. Coomassie blue staining following SDS-PAGE revealed bands around 30kDa as well as multiple lower bands. (Figure 27) Presence of the same bands observed at SBA blot supported the assumption that these bands were caused by translation initiation from every in-frame AUG codon since expected molecular weight of the translated peptides from each start codon matched and the peptides contained DQNAT and polyhistidine tag which were located at the C-terminus. As an effort to remove the undesired shorter proteins, we performed SEC purification. SDS-PAGE result suggested adequate success. Since during these purifications proteins stayed in room temperature at denaturing
conditions, we performed SBA blot on the pure proteins to ensure glycans were not detached. SBA blot corroborated that the glycosylation was extant.
Figure 27: SDS-PAGE Coomassie blue staining and SBA lectin blot images of wild type TasA (WT), TasA-DQNAT expressed in the absence of pgl-pACYC (-Gly) and TasA-DQNAT expressed in the presence of pgl-pACYC (+(-Gly) proteins at different purity states.
3.2.3 Assessment of Effects of Glycosylation on TasA Fibrillation
Before cloning TasA-DQNAT, we carried out preliminary studies to validate our ability to form recombinant TasA fibers in vitro as shown in literature. The main concern was that the researchers could form fibers from proteins purified in native conditions but we planned to purify TasA in denaturing conditions since it simplified and made the process easier. Hence, wild type TasA purified using IMAC in
denaturing conditions were dialyzed into water and samples were incubated at room temperature for one week. Then, we visualized the samples under transmission electron microscopy (TEM) after labelling with Ni-NTA gold nanoparticles which