arXiv:cond-mat/0504088v2 [cond-mat.str-el] 10 Nov 2005
R. Shaltafa,∗†, E. Meteb, and S¸. Ellialtıo˘glua a
Department of Physics, Middle East Technical University, Ankara 06531, Turkey
b
Physics Department, University of Balıkesir, 10100 Balıkesir, Turkey (Dated: December 22, 2018)
First-principles calculations using density functional theory based on norm-conserving pseudopo-tentials have been performed to investigate the Cs adsorption on the Si(001) surface for 0.5 and 1 ML coverages. We found that the saturation coverage corresponds to 1 ML adsorption with two Cs atoms occupying the double layer model sites. While the energy bands spectra of the 0.5 ML covered surface is of metallic nature, we found that 1 ML Cs adlayer leads to a semiconducting surface. The results for the electronic behavior and surface work function suggest that adsorption of Cs takes place via polarized covalent bonding. The nature of Cs-Si bond shows a hybrid character of s − p type implying a limited charge transfer from the adsorbate to the substrate.
PACS numbers: 68.43.Bc, 68.43.Fg
I. INTRODUCTION
The adsorption of alkali metals on semiconductor sur-faces has been the topic of interest for several decades. The experimental and theoretical studies were moti-vated by various technological applications as in the low-temperature and low-field electron emission sources and as for the catalyzers of silicon dioxide growth on silicon surfaces. In the latter case Cs might be a better choice because the adsorption of Cs atoms on Si surface alters the Si surface structure only a little, which enables them to be desorbed from the Si surface very easily.
First experiments on Cs/Si(001) system were per-formed by Goldstein1 and Levine2 in the early sev-enties. Using low-energy-electron-diffraction (LEED) and Auger-electron-spectroscopy (AES) they proposed a model in which Cs atoms are adsorbed on pedestal sites forming single Cs chains running along the dimer rows, hence the saturation coverage was believed to be 0.5 ML. Based on this model the electronic properties of the cov-ered surface will have a metallic nature as can be pre-dicted from simple electron counting. This model was generally accepted in the proceeding years until the x-ray photoelectron diffraction (XPD) results of Abukawa and Kono3 revealed that at saturation coverage, alkali adsorbent atoms, like K and Cs, will form two sets of arrays (a double layer), with a vertical separation of ∼ 1 ˚
A. Abukawa and Kono proposed a model in which the atoms get adsorbed simultaneously on two different sites, namely hollow and pedestal sites. The electronic prop-erties of Cs/Si(001) as investigated by Enta et al.4 us-ing angle-resolved ultraviolet photoemission spectroscopy (ARUPS) were consistent with the double layer model. Their results for surface state dispersion showed a
semi-∗Corresponding author: e-mail: [email protected] †Present address: Unit´e Physico-Chimie et de Physique des
Mat`eriaux, Universit´e catholique de Louvain, Place Croix du Sud, 1 B-1348 Louvain-la-Neuve, Belgique
conducting surface which agrees with the double layer model. Smith et al.5estimated using medium energy ion scattering in conjunction with AES and LEED a satura-tion coverage of 0.97 ± 0.05, a result which also supports the double layer model.
Even though Abukawa model3 was adopted and sup-ported in many other works6,7,8,9,10,11,12,13, the satura-tion coverage and adsorpsatura-tion sites of Cs/Si(001) still stay as the matter of debate. In a recent experimental work using He Rutherford backscattering, Sherman et al.14 found that saturation can not exceed 0.5 ML supporting the Levine model, they rejected the existence of DML (double monolayer) model. Kim et al.15 also arrived at the same conclusion based on their coaxial impact col-lision ion scattering spectroscopy. Meyerheim et al.,16 however, accepted the saturation coverage being 1 ML, but they suggested that adsorption on bridge (mid-point above the Si dimer) and hollow sites might be more stable than the Abukawa model.
The atomic reconstruction of covered surface, the bonding between the Cs atom and the Si surface, as well as the electronic properties of the covered surface still present a matter of dispute. For instance, it was sug-gested by various experiments16,17 that adsorption of Cs symmetrizes the dimers. However, Chao et al.,9,10,11 ar-gued that the dimer structure is still asymmetric. On the other hand, using ARUPS4, extended x-ray absorption fine structure spectroscopy6,8 (EXAFS), and threshold photoemission spectroscopy12 results it was concluded that the adsorption of Cs atoms on Si(001) surface takes place via covalent bonding, moreover, partially ionic bonding was suggested by synchrotron radiation photoe-mission by Lin et al.,7 and even further, a pure ionic bonding was proposed by the low energy D-scattering results of Souda et al.18
In this work, we employed ab initio total energy-pseudopotential method to study the adsorption of Cs on Si(001) surface at the previously proposed saturation coverages. We investigated the structural and electronic properties as well as the work function of the covered surface to get a better understanding of this system.
II. METHOD
We used pseudopotential method based on density functional theory in the local density approximation. The self consistent norm conserving pseudopotentials of silicon and hydrogen were generated by using the Ham-mann scheme19that is included in the fhi98PP package.20 Nonlinear core corrections were included in the norm-conserving pseudopotential of Cs generated by using the Troullier-Martins scheme.21 In order to solve the Kohn-Sham equations, conjugate gradients minimization method22 was employed as implemented by the ABINIT code.23,24 The exchange-correlation effects were taken into account within the Perdew-Wang scheme25 as pa-rameterized by Ceperley and Alder.26
The surface unit cell (SUC) includes a slab with 8 lay-ers of Si atoms and a vacuum region equal to about 9 ˚A in thickness. Single-particle wave functions were expanded using a plane wave basis up to a kinetic energy cut-off equal to 16 Ry. The Brillouin zone integration was per-formed using 16 special ~k-points that are sampled with the Monkhorst-Pack scheme.27
We used the 2×1 unit cell for the clean Si(001) surface in our calculations, which is obtained by using the above parameters, and having the lowest two layers (out of 8) kept fixed in their ideal bulk positions while all the re-maining substrate atoms were allowed to relax into their minimum energy positions.
b
p
c
h
s
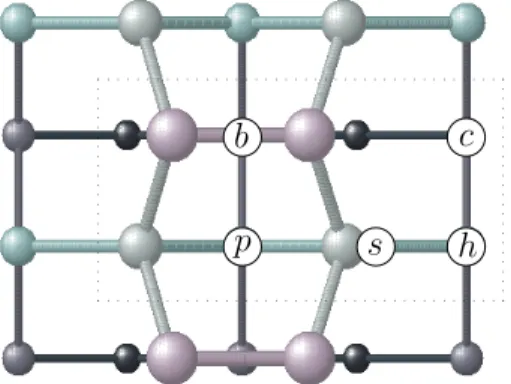
FIG. 1: Schematics of the adsorption sites for Cs atom on Si(001) surface. Surface unit cell is indicated by dashed box. The symbols stand for: b=bridge, p=pedestal, h=hollow, s=shallow and c=cave. (The dimers are shown symmetric here for visual convenience)
The resultant relaxed structure has asymmetric dimers with a dimer length of 2.27 ˚A and a tilt angle of 18.1◦. Our result for clean Si(001) is in agreement with the the-oretical results of Ramstad et al.28 who found a dimer length of 2.26 ˚A with a tilting angle being 18.3◦.
We performed separate self-consistent calculations to determine surface work function and formation energy using a symmetrical slab having a thickness equal to 10 Si layers and being separated from each other with a vacuum region of ∼15 ˚A. After relaxing the clean surface into its minimum energy geometry we froze the 4 Si atoms
which are located in the middle of this slab. We also repeated geometry optimizations using symmetrical slab for some of the coverage models as was done in the case of hydrogenated surface. These calculations produced equivalent results.
III. RESULTS AND DISCUSSION
We have studied the adsorption of Cs atoms on the Si(001) surface for 0.5 ML and 1 ML coverages, starting with the reconstructed (2×1) surface unit cell. We have chosen five different sites for the adsorption, namely, the cave, hollow, pedestal, bridge and the shallow sites. The cave site (c) is located above the fourth layer Si, hollow (h) and pedestal (p) sites are above the third layer Si, shallow site (s) is above the second layer Si between the two Si dimers, and the bridge site (b) is located above the dimer as indicated in Figure 1. The adatom and the substrate were then taken to their minimum energy configurations by performing structural optimization us-ing the Broyden-Fletcher-Goldfarb-Shanno method29 un-til the force on each atom reduces to a value less than 25 meV/˚A.
A. Structural Properties
We have found that adsorption of Cs on h site is the most stable one with an adsorption energy per adatom, Ead, equal to 2.46 eV, which is the negative of the binding energy of the adatom, and defined by the expression
n Ead= (ESi(001)+ n ECs) − ECs/Si(001). (1) Here, ECs/Si(001) is the total energy of the covered sur-face, ESi(001) is the total energy of the clean surface, n is the number of Cs adatoms in a surface unit cell and ECsis the total energy of a single Cs atom with the spin polarization obtained in a separate ab initio calculation using the same pseudopotential and the same kinetic en-ergy cut off, but in a larger unit cell of size ∼26 ˚A.
The adsorption of Cs atom on this site symmetrizes the dimers with resulting dimer lengths equal to 2.34 ˚A. Other configurations of adsorption on p, c and b sites were found less stable with adsorption energies of 2.02, 1.89 and 1.46 eV, respectively, and with dimers still tilted in various angles as listed in Table I. Finally, the adsorption on s site was not found as a well defined local minimum with the adatom migrating into a neighboring h site. Our results suggest that if the saturation coverage would exist then it must contain h site as being the most probable adsorption site. Therefore, Levine’s model appears to be obsolete which assumes the adsorption of Cs atom on a psite. On the other hand, our agreement is merely for the adsorption site with Kim et al.15who found that the saturation coverage corresponds to 0.5 ML with a single Cs atom being adsorbed on h site only. The height of
TABLE I: The structural parameters for most of the stable adsorption sites for two different coverages Θ. The dimer lengths, heights of the adatoms with respect to the second silicon monolayer (all in ˚A) and the adsorption energies (Ead
in eV) for these cases are presented. The quantities in paren-thesis are tilt angles (in degrees) of the corresponding dimers.
Θ Model dimer d⊥ Ead 0.5 h 2.34 (0.8) 2.75 2.46 p 2.39 (8.7) 3.75 2.02 c 2.31 (7.5) 3.15 1.89 b 2.37 (11.1) 4.30 1.46 1 h-p 2.46 2.67 3.86 2.39 h-b 2.46 2.66 4.50 2.18
Cs atom from the second silicon layer is found to be 2.75 ˚
A, which is smaller than their experimental value15 of 3.18 ± 0.05 ˚A. The distance between Cs atom and the nearest Si atom was found to be 3.58 ˚A which is close to their experimental value15of 3.71 ± 0.05 ˚A. Hashizume et al.,30using field ion scanning tunneling microscopy, stud-ied the adsorption at very low coverage, and suggested that adsorption takes place at the off-center hollow site (a non-symmetric site between h and s in our notation). This site has been also accepted by Gorelik et al.31 who made use of local surface photo voltage (SPV), current imaging, and also scanning tunneling microscopy, how-ever, it has been rejected by a recent experimental work by Park et al.,32who found rather the h site as the most stable one. While the off-center site might be stable for low coverages as reported by the references30,31 we did not find any theoretical evidence for this at the cover-ages studied in this work. Our aim being to study the cases close to the previously reported saturation cover-ages, this off-center site was also checked as the starting point for the 0.5 ML adsorption case and was verified that the Cs adatom migrates to the closest h site.
For the full coverage we have considered only the com-binations that included h site as the starting configura-tions. We have four different combinations from which we found that the Abukawa model, with Cs atoms ad-sorbed at the h-p sites, was found as the most stable one with an adsorption energy of 2.39 eV. The heights of the Cs atoms as measured from the second Si ML, were 2.67 ˚
A and 3.86 ˚A for h and p sites, respectively. The double layer height difference corresponds to 1.19 ˚A which is in excellent agreement with the experimental value3 of 1.2 ˚
A. Meyerheim et al.16 using surface x-ray diffraction in-vestigated the atomic structure of Cs/Si(001), and found that the saturation coverage corresponds to the combi-nation of two adsorption sites b and h. According to our results, even though this model was found stable, it is
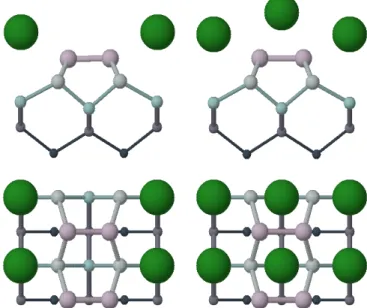
FIG. 2: Cs overlayer adsorbed on Si(001) surface (a) for 0.5 ML coverage on h site and (b) for 1 ML coverage on h-p site. Only the upper part of the slab is shown here.
less stable than the Abukawa model by 0.2 eV per Cs adatom. Figure 2 shows the most stable configurations for each coverage.
TABLE II: The structural parameters (in ˚A) for h-p model versus the previously reported experimental work. The dou-ble layer height differences, ∆⊥, are also presented.
dimer Cs-Si1 Cs-Si2 ∆⊥
This work 2.46 3.41 3.49 1.19 EXAFS8 2.48 ± 0.06 3.57 ± 0.06 Tensor LEED13 2.50 3.72 3.94 0.66 XPD3 – – – 1.2 ± 0.1
In Table II we tabulate our calculated structural pa-rameters for the h-p case along with the experimental val-ues. Our calculated bond lengths for Cs-Si bonds, being 3.41 ˚A and 3.49 ˚A, were in good agreement with 3.57 ˚A obtained from EXAFS8 and somewhat smaller than the tensor LEED values13 of 3.72 ˚A and 3.94 ˚A. We did not find that the adsorption of Cs atoms on the surface leads to significant alteration of the substrate. For the case of double layer adsorption we found that the major changes in the substrate take place in the dimer layer (Si first layer), where the upper atom in dimer gets pushed down by a distance of 0.09 ˚A while the lower atom is pushed up by a distance equal to 0.61 ˚A. In the mean time, both adatoms get displaced along [0¯10] by 0.5 ˚A and 0.2 ˚A, respectively. Reconstruction in deeper silicon layers is not significant and it ranges around 0.01 − 0.06 ˚A only.
This result agrees well with the fact that Cs adatoms do not alter the silicon surface very much as was also suggested by Kim et al.6 The reconstruction of the sur-face leads to symmetric dimers with dimer lengths of 2.46 ˚
A in excellent agreement with the experimental value8of 2.48±0.06 ˚A. The symmetrization of silicon dimers by Cs adsorption was found in agreement with various other ex-perimental results13,16in contrast to the high-resolution core-level spectroscopy and angle-resolved valence-band spectroscopy of Chao et al.9,11 who argued that the Si dimers stay asymmetric. Abukawa et al.17 studied the surface by means of core-level photoemission for the cov-ered surface Si(001)2×1-Cs and found that the surface dimers are symmetric and excluded the results of Chao et al.9,11
B. Electronic Properties 1. Energy Bands
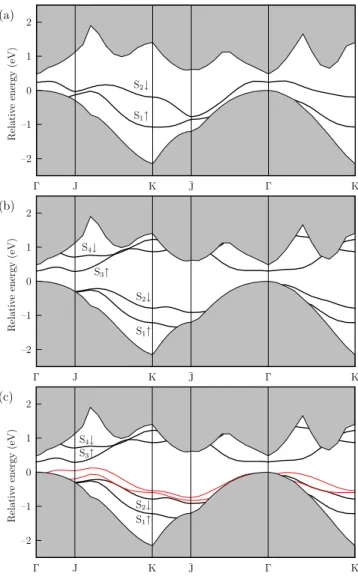
In Figure 3 we show our calculated band configurations for the lowest energy structures of the 0.5 and 1 ML covered Si(001) surface. For the clean surface we have two surface states in the fundamental gap, namely S1 and S2, and the S2state usually appears above the Fermi level. When the Cs atom gets adsorbed on h site for the half ML case, its effect will be the shifting of this state downward towards the valence bands, crossing the Fermi level and causing a metallic behavior due to the partial filling of the S2dangling bond band (Fig. 3(a)).
For the full ML coverage with adsorption of Abukawa type (h-p), the dispersion shows a semiconducting sur-face as expected, and in agreement with ARUPS results of Enta et al.4 We have a direct gap at Γ with a band gap value of 0.30 eV (Fig. 3(b)). This semiconducting nature of the surface might be due to the saturation of the dimer dangling bonds. Benemanskaya et al.12 ex-pected that at 1 ML coverage, the adsorbed surface will be semiconducting with two surface state bands, S3 and S4, appearing in the band gap below the bottom of the conduction band which is in good agreement with our theoretical results.
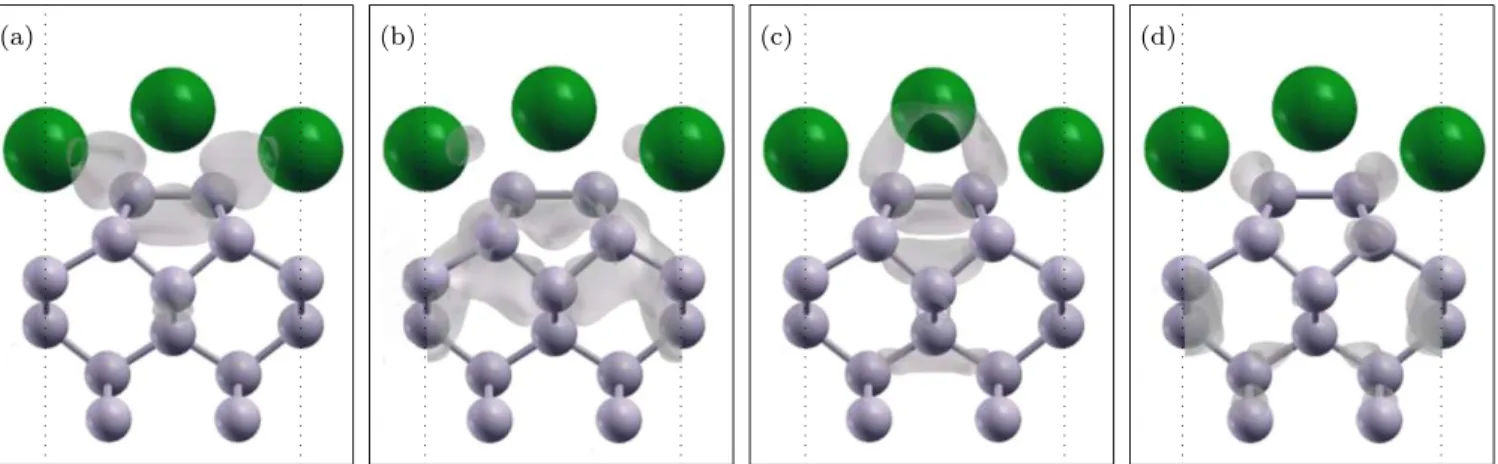
The occupied band S1represents the π-like silicon dan-gling bond surface state, while S2corresponds to the π∗ -like Si dangling bond state, which are shown in Figure 3. In order to study the nature of these states we calculated the 3D charge density distributions for these occupied surface states at 1 ML coverage at the K and J high symmetry SBZ points. These plots are given for the sur-face state S1in Figures 4(a) and 4(c), and for S2 in 4(b) and 4(d) at K and J points, respectively. The electronic character of π and π∗ Si dangling bond surface states show partial contribution from the adsorbed Cs atoms which can readily be seen in the Figures 4(c) and 4(d) at the J point of the SBZ. At J point, in Figure 4(c), the contribution to surface state S1 comes from the up-per Cs adatom while it is vice versa for S2, as seen in
Figure 4(d). At K point the composition of the surface states S1and S2 show more contribution from the lower Cs adatom.
The unoccupied low-lying surface states originate mainly because of the adsorbed Cs atoms. They show a hybrid character as a combination of Cs atomic s-orbital and dimer Si dangling bond orbitals.
–2 –1 0 1 2 Γ J K ¯J Γ K (a) R el at iv e en er gy (eV) S1↑ S2↓ –2 –1 0 1 2 Γ J K ¯J Γ K (b) R el at iv e en er gy (eV) S1↑ S2↓ S3↑ S4↓ –2 –1 0 1 2 Γ J K ¯J Γ K (c) R el at iv e en er gy (eV) S1↑ S2↓ S3↑ S4↓
FIG. 3: Electronic band structure of the Si(001) 2×1 surface for (a) 0.5 ML Cs coverage and (b) 1 ML Abukawa model. Projected bulk continuum is shown by the shaded region. (c) Same substrate as in (b) reconstructed due to adsorption of 1 ML Cs (thick lines), but the Cs adatoms are taken away (thin lines).
The adsorption of Cs atoms causes a substantial shift in the energies of surface states S1 and S2 towards bulk valence band continuum over the whole SBZ as a result of the increase in the binding energies. In the case of 1 ML coverage Figure 3(b) shows maximum change in the dis-persions for S1at J and for S2at K. Other significant de-viations appear at ¯J and J for S1and S2, respectively. At K and ¯J points S1and S2get closer when no Cs present. This implies Cs-Cs electronic interaction is dominant at
(a) (b) (c) (d)
FIG. 4: h-p model 3D charge density distributions for S1and S2bands at high symmetry points K and J in the surface Brillouin
zone. Dashed lines show the SUC boundaries. (a) S1at K, (b) S2 at K, (c) S1 at J and (d) S2 at J.
K and ¯J. At J point, on the other hand, Cs-Si interac-tion seems to be more pronounced. This is because when Cs atoms are removed the electron-electron interaction around dimer Si atoms becomes more repulsive.
The shift in the energy values for the surface states S1 and S2comes mainly from the lowering of kinetic energy rather than potential contribution to eigenenergies for these surface states. Ishida et al.33showed for K/Si(001) system that this lowering of kinetic energy increases with increasing K adsorption. This behavior can be seen as a charge localization in the vicinity of dimer Si and Cs atoms. Our results support the interpretation of Souki-assian et al.35of these shifts as being due to Si 3p–Cs 6s hybridization.
2. Nature of the Cs-Si Bond
Because the charge of Cs atom is much lower than that of Si bulk, the total charge density of the adsorbed surface will show a bare Cs atom, which makes the to-tal charge density not meaningful in studying the charge distribution for the adsorbed surface. Hence we can not decide on the ionicity or covalency from the total charge density picture.33,36 This leads us to investigate the dif-ference in charge distributions instead. Our results for the charge difference are very similar to those obtained previously.33,36In Figure 5(a) and (b), we show 3D plots of the difference in charge distributions for the half and full coverage adsorption, which is defined as
δρ(r) = ρCs/Si(001)(r) − ρSi(001)(r) − ρCs(r) (2) where ρCs/Si(001)(r) corresponds to the total charge den-sity of the covered surface, ρSi(001)(r) is the total charge density of the Si substrate with the same atomic arrange-ment as that of the covered surface, and ρCs(r) is the total charge density of the isolated Cs atom. We notice from Figure 5 that the strongest bonding charge is in the plane which includes the silicon dimers and not in
the plane containing the Cs atoms. We also see that the charge depletion for Cs atoms adsorbed on the surface takes place mostly along [001] direction. Another major depletion takes place in between the dimer atoms. This depletion results in favor of accumulation of the charge between the dimer and Cs atoms. Similarly, the deple-tion of charge around the Cs atom was found to be mainly in the dimer plane rather than in the Cs adlayer. The charge depletion around Cs atom in the vacuum direc-tion is a little bit shrunk for 1 ML coverage which comes as a sign of weaker Cs-Si interaction and a smaller po-larization of the bond. This result suggest that we have polarized covalent bonding as was suggested before by Ishida et al.33 The bond becomes less polarized as Cs coverage increases. Our theoretical Cs-Si bond lengths for the 0.5 and 1 ML cases being 3.58 ˚A and 3.45 ˚A are close to the sum of the Cs (2.35 ˚A) and Si (1.17 ˚A) cova-lent radii, moreover they compare well with the minimum bond length of 3.56 ˚A for the CsSi compound.34The
po-(a) (b)
FIG. 5: Electronic charge density difference 3D plots for 0.5 ML and 1 ML coverages. Blue (bright) and red (dark) re-gions denote charge depleted and charge accumulated zones, respectively.
larized covalent nature of the Cs-Si bonding is also in agreement with the experimental results of Soukiassian et al.35
On the basis of these results we can now interpret the symmetrization of dimers to be as result of saturation of dangling bonds via hybridization. Since the Cs 6s orbital has a largely spread wave function, Cs atom may interact with many neighboring Si atoms resulting in symmetriza-tion of the dimers at low coverages such as 0.5 ML or even smaller, e.g., 0.3 ML as was shown experimentally.8This may also explain the small reconstruction that take place in the substrate which we believe is due to the very lim-ited charge transfer from the Cs atom to the substrate.
C. Work Function
The work function is calculated as the difference be-tween the vacuum level and the Fermi energy, EF. The vacuum level is determined from the self-consistent, plane-averaged potential, Vav, in the middle of the sym-metrical slabs along the direction perpendicular to the surfaces. It can be obtained from the Poisson’s equation,
∂2
∂z2Vav(z) = −4πρav(z) (3) and is given by the relation,
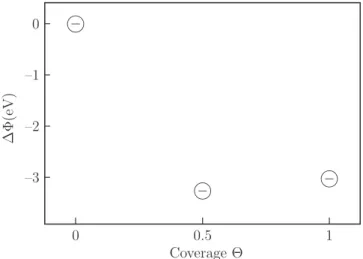
Vav(z) = −4π Z ∞ z ρav(z′) z′dz′+ 4πz Z ∞ z ρav(z′) dz′ (4) where ρav(z) = 1 A ZZ A |ψ(x, y, z)|2dx dy . (5) The work function for clean Si(001)-2×1 surface was reported to be 4.9 eV by Abukawa et al.37 This agrees very well with our theoretical value of 4.9 eV for the clean relaxed surface. In Figure 6 we present our cal-culated values for the work function shifts with respect to the clean surface, which are 3.26 eV and 3.02 eV for half and full coverages, respectively. The lowering in the work function is more rapid between the clean surface and the 0.5 ML coverage before it rises again by 0.24 eV at the saturation coverage. Our calculated value for the lowering of the work function for the full coverage com-pares well with the other experimental values as shown in Table III. This behavior in the work function shift is consistent with experimental results4,38 for Cs/Si(001). It was found in most of the experimental results that work function shifts reach to some maximum value at a smaller coverage than that of saturation coverage be-fore it backs up a little to a value for the 1 ML. Since we found that bonding between Cs atom and the silicon surface is polarized covalent, we can not explain the low-ering in the work function on the basis of the classical Gurney picture39 which is based on the charge transfer and ideal ionic bonding systems. Hence, we found that
TABLE III: Work function change ∆Φ (in eV) at the satura-tion coverage with respect to the clean Si(001) 2 × 1 surface.
∆Φ(eV) Reference Method
–3.02 This work ab initio
–3.11 Ref. [4] ARUPS
–3.4 Ref. [35] VBPS, CLPS
–3.2 Ref. [36] EELS
–2.8 Ref. [37] AES, LEED
the model suggested previously by Ishida et al.33 might be more suitable to our results. In the initial stages of Cs adsorption, the strong modification of charge distri-bution around the Cs atoms will result in a polarized adlayer. Adsorbed Cs atoms, thus, can be considered as dipole moments as a result of charge depletion from the Cs adatom vacuum sides and the charge accumulation between Cs-Si atoms. This signifies a hybridization of Si 3p and Cs 6s which implies the saturation of Si dangling bonds, leading to a rapid drop of the work function. Even if the single dipole moments get weakened as a function of increasing Cs coverage, the number of dipoles on the surface increases making the overall dipole-dipole interac-tion significant. This raises the potential energy barrier for outgoing electrons and results in an increase in the work function by 0.24 eV as the coverage goes from 0.5 ML to 1 ML. ∆ Φ (e V) Coverage Θ –3 –2 –1 0 0 0.5 1
⊖
⊖
⊖
FIG. 6: Calculated shifts in the work function as a function of the coverage with respect to the clean surface
D. Thermodynamic Stability of the Phases The thermodynamic stability for these coverages can be studied by calculating the surface formation energy as a function of chemical potential for each case. This allows one to compare the stability of surface having different
number of Cs adatoms.
The surface formation energy40 at 0 K for a slab con-taining nSiatoms of Si and nCsatoms of Cs adsorbed on its surface can be written as
Ω = ECs/Si(001)− nSiµSi− nCsµCs (6) where µCs and µSi are the chemical potentials of Cs and Si, respectively. ECs/Si(001)is the total energy for the cov-ered surface as obtained by the self-consistent ab initio calculations. In the usual adsorption experiments using gaseous Cs, µCsof gaseous Cs is less than the correspond-ing value of bulk, and it varies with pressure and temper-ature. Thus surface chemical potential µCs of Cs should be considered in some range such that it cannot exceed the µbulk
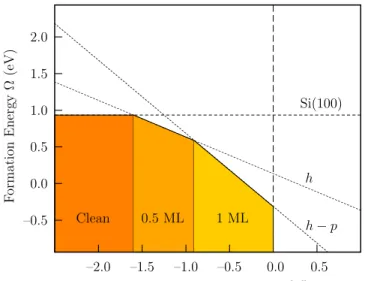
Cs . Taking the origin as the chemical potential of bulk Cs, the calculated formation energies as a function of µCs were presented in Figure 7.
–0.5 0.0 0.5 1.0 1.5 2.0 –2.0 –1.5 –1.0 –0.5 0.0 0.5 F orm ati on En erg y Ω (e V)
Relative Chemical Potential (µCs− µbulkCs ) (eV)
Si(100)
h
h − p
Clean 0.5 ML 1 ML
FIG. 7: The surface formation energy as a function of the relative chemical potential of Cs adsorbed on Si(001) surface per (1 × 1) unit cell.
It was found that for (µCs−µbulkCs ) < −1.60 eV the clean Si(001) surface has a lower formation energy than that with any amount of Cs adsorbed on it. However, in the
range −1.60 eV < (µCs−µbulkCs ) < −0.90 eV, the half cov-erage adsorption with a 2×1 symmetry is found to be the most stable structure. A transition to full coverage with 2×1 surface has occurred when (µCs− µbulkCs ) > −0.90 eV.
Since the half coverage is thermodynamically stable with a work function difference close to that of the satu-rated surface, this might be the reason why some experi-mental results were interpreted as the half ML being the saturation coverage.
Our results show that after the completion of the half coverage with all hollow sites occupied, if extra Cs atoms are added, they will start filling the pedestal sites until a complete 1 ML is formed. Thus, the saturation coverage for Cs/Si(001) system is 1 ML and is in agreement with the experimental results.6,7,8,9,10,11,12,13
E. Conclusion
We have performed an ab initio total energy calcula-tion and geometry optimizacalcula-tion for a clean Si(001) sur-face and that with Cs overlayer for 0.5 and 1 ML cover-ages on it. For the 0.5 ML coverage we have found that Cs occupy the h site between dimer rows. The adsorp-tion sites for 1 ML coverage agree well with the Abukawa model with h-p configuration. While our findings suggest that 0.5 ML is thermodynamically stable, we found that 1 ML coverage is the saturation coverage. The energy band spectra show metallic and semiconducting surfaces for the half and full ML coverages, respectively. The re-sults for difference in charge upon Cs adsorption suggests that the nature of the Cs-Si bonding is polarized cova-lent. Our calculated values for the work function differ-ence agrees well with the existing experimental results.
Acknowledgments
This work was supported by T ¨UB˙ITAK, The Scientific and Technical Research Council of Turkey, Grant No. TBAG-2036 (101T058).
1
Bernard Goldstein, Surf. Sci. 35, 227 (1973).
2
Jules D. Levine, Surf. Sci. 34, 90 (1973).
3
T. Abukawa and S. Kono, Surf. Sci. 214, 141 (1989).
4
Y. Enta, T. Kinoshita, S. Suzuki, and S. Kono, Phys. Rev. B 39, 1125 (1989).
5
A. J. Smith, W. R. Graham, and W. Plummer, Surf. Sci. Lett. 243, L37 (1991).
6
S. T. Kim, P. Soukiassian, L. Barbier, S. Kapoor, and Z. Hurych, Phys. Rev. B 44, 5622 (1991).
7
D.-S. Lin, T. Miller, and T.-C. Chiang, Phys. Rev. B 44, 10719 (1991).
8
P. S. Mangat and P. Soukiassian, Phys. Rev. B 52, 12 020
(1995).
9
Y.-C. Chao, L. S. O. Johansson, and R. I. G. Uhrberg, Phys. Rev. B 54, 5901 (1996).
10
Y.-C. Chao, L. S. O. Johansson, and R. I. G. Uhrberg, Phys. Rev. B 55, 7667 (1997).
11
Y.-C. Chao, L. S. O. Johansson, and R. I. G. Uhrberg, App. Surf. Sci. 123-124, 76 (1998).
12
G. V. Benemanskaya, D. V. Daneka, and F. ´E. Frank-Kamenetskaya, JETP Lett. 65, 729 (1997).
13
H. Hamamatsu, H. W. Yeom, T. Yokoyama, T. Kayama, and T. Ohta, Phys. Rev. B 57, 11883 (1998).
W. B. Sherman, R. Banerjee, N. J. DiNardo, and W. R. Graham, Phys. Rev. B 62, 4545 (2000).
15
J. Y. Kim, J. Y. Park, J. H. Seo, C. N. Whang, H. J. Kang, S. S. Kim, D. S. Choi, and K. H. Chae, Surf. Sci. 531, L340 (2003).
16
H. L. Meyerheim, N. Jedrecy, M. Sauvage-Simkin, and R. Pinchaux, Phys. Rev. B 58, 2118 (1998).
17
T. Abukawa, L. S. O. Johansson, E. L. Bullock, L. Patthey, and S. Kono, J. Electr. Spectrosc. Rel. Phen. 88-91, 539 (1998).
18
R. Souda, W. Hayami, T. Aizawa, and Y. Ishizawa, Phys. Rev. B 47, 9917 (1993).
19
D. R. Hamann, Phys. Rev. B 40, 2980 (1989).
20
Martin Fuchs and Mathias Scheffler, Comp. Phys. Com-mun. 119, 67 (1999).
21
N. Troullier and J. L. Martins, Phys. Rev. B 43, 1993 (1991).
22
M. C. Payne, M. P. Teter, D. C. Allan, T. A. Arias, and J. D. Joannopoulos, Rev. Mod. Phys. 64, 1045 (1992).
23
The ABINIT code is a common project of the Universit´e Catholique de Louvain, Corning Incorporated, and other contributors (URL http://www.abinit.org).
24
X. Gonze, J.-M. Beuken, R. Caracas, F. Detraux, M. Fuchs, G.-M. Rignanese, L. Sindic, M. Verstraete, G. Zerah, F. Jollet, M. Torrent, A. Roy, M. Mikami, Ph. Ghosez, J.-Y. Raty, and D. C. Allan, Comp. Matter. Sci. 25, 478 (2002).
25
J. P. Perdew and Y. Wang, Phys. Rev. B 45, 13244 (1992).
D. M. Ceperley and B. J. Alder, Phys. Rev. Lett. 45, 566 (1980).
27
H. J. Monkhorst and J. D. Pack, Phys. Rev. B 13, 5188 (1976).
28
A. Ramstad, G. Brocks, and P. J. Kelly, Phys. Rev. B 51, 14504 (1995).
29
D. F. Shanno, J. Optim. Theo. Appl. 46, 87 (1985).
30
Tomi Hashizume, I. Sumita, Y. Murata, S. Hyodo, and T. Sakurai, J. Vac. Sci. Technol. B 9, 742 (1991).
31
D. Gorelik, S. Aloni, and G. Haase, Surf. Sci. 432, 265 (1999).
32
J. Y. Park, J. H. Seo, J. Y. Kim, C. N. Whang, S. S. Kim, D. S. Choi, and K. H. Chae, App. Surf. Sci. 240, 305 (2005).
33
H. Ishida and K. Terakura, Phys. Rev. B 40, 11519 (1989).
34
E. Busmann, Z. Anorg. Allg. Chem. 313, 91 (1961).
35
P. Soukiassian, M. H. Bakshi, Z. Hurych, and T. M. Gentle, Surf. Sci. Lett. 221, L759 (1989).
36
K. Kobayashi, Y. Morikawa, K. Terakawa, and S. Bl¨ugel, Phys. Rev. B 45, 3469 (1992).
37
T. Abukawa, Y. Enta, T. Kashiwakura, S. Suzuki, S. Kono, and T. Sakamoto, J. Vac. Sci. Technol. A 8 3205 (1990).
38
J. E. Ortega, E. G. Oellig, J. Ferr´on, and R. Mirand, Phys. Rev. B 36, 6213 (1987).
39
R. W. Gurney, Phys. Rev. 47, 479 (1935).
40
G. X. Qian, R. M. Martin, and D. J. Chadi, Phys. Rev. B 38, 7649 (1988).