FT-IR SPECTROSCOPIC CHARACTERIZATION of
the INTERMEDIATES in the SELECTİVE CATALYTIC REDUCTION
of NO WITH METHANE on Pd/ZrO
2-WO
xCATALYST
A THESIS
SUBMITTED TO THE DEPARTMENT OF CHEMISTRY
THE INSTITUTE OF ENGINEERING AND SCIENCES OF
BILKENT UNIVERSITY
IN PARTIAL FULFILLMENT OF THE REQUIREMENTS
FOR THE DEGREE
OF
MASTER OF SCIENCE
By
İLKNUR ÇAYIRTEPE
I certify that I have read this thesis and in my opinion it is fully adequate, in scope and quality, as a thesis of the degree of Master of Science
———————————————— Assoc. Prof. Margarita Kantcheva (Supervisor)
I certify that I have read this thesis and in my opinion it is fully adequate, in scope and quality, as a thesis of the degree of Master of Science
———————————————— Prof. Dr. Şefik Süzer
I certify that I have read this thesis and in my opinion it is fully adequate, in scope and quality, as a thesis of the degree of Master of Science
———————————————— Assoc. Prof. Ömer Dağ
I certify that I have read this thesis and in my opinion it is fully adequate, in scope and quality, as a thesis of the degree of Master of Science
———————————————— Assoc. Prof. Gürkan Karakaş
I certify that I have read this this thesis and in my opinion it is fully adequate, in scope and quality, as a thesis of the degree of Master of Science
———————————————— Assoc. Prof. Deniz Üner
Approved for the Institute of Engineering and Sciences
———————————————— Prof. Dr. Mehmet Baray
ABSTRACT
FT-IR SPECTROSCOPIC CHARACTERIZATION of
the INTERMEDIATES in the SELECTİVE CATALTIC REDUCTION
of NO WITH METHANE on Pd/ZrO2-WOx CATALYST
İLKNUR ÇAYIRTEPE M.S. in Chemistry
Supervisor: Assoc. Prof. Margarita Kantcheva September 2004
This work involves in situ FT-IR spectroscopic study of the routes of formation, composition and thermal stability of strongly bound NOx complexes on
the surface of Pd/tungstated zirconia, and transformation of the surface NOx
complexes in the presence of methane in order to elucidate the mechanism of selective catalytic reduction of NO with methane. Sol-gel polymer-template synthesis was chosen to obtain high surface area in the preparation of the tungstated zirconia used as support (WO3 nominal content of 18.6 wt %). The
Pd(II) ions (0.1 wt%) have been deposited by impregnation. PXRD characterization shows that the support and the catalyst are tetragonal and contain mesoporous phase.
The adsorption of NO at room temperature on the tungstated zirconia shows presence of coordinatively unsaturated Zr(IV) ions. The spectrum of NO adsorbed on palladium modified on tungstated zirconia reveals the existence of two types of Pd(II) sites. No exposed Zr(IV) ions are observed. The surface NOx
species (N2O3, nitro and nitrito ions) on both samples are produced at room
temperature by oxidation of NO with the W6+=O species. In the case of the Pd/tungstated zirconia, palladium(II) can oxidize NO to NO2 at 623 K.
The adsorption of NO/O2 mixture at room temperature on the samples
studied leads to formation of various kinds of surface nitrates characterized by different modes of coordination. The thermal stability of the nitrate species formed on both samples is comparable: They disappear after dynamic evacuation at 673 K. However, lower concentration of the surface nitrates on the Pd/tungstated zirconia compared to that on the tungstated zirconia indicates that in the former case the nitrates are coordinated to the support.
The experimental results show that methane interacts differently with the NOx-precovered tungstated zirconia and Pd/tungstated zirconia although both
materials are able to activate methane at the same temperature in absence of adsorbed NOx species. In the case of the tungstated zirconia the surface nitrates
suppress the oxidation of methane, whereas the NOx-precovered Pd/tungstated
zirconia catalyzes the formation of nitromethane. The latter compound is considered as a key intermediate in the selective catalytic reduction of NO with methane in excess oxygen. A mechanism, which involves direct activation of methane by the catalyst, leading to the products of the selective reduction (N2,
CO2 and H2O) is proposed.
Keywords: Adsorption of NO and NO/O2; In situ FT-IR spectroscopy; tungstated
zirconia; Pd supported on tungstated zirconia; NO selective catalytic reduction by methane; Mechanism; Nitromethane.
ÖZET
Pd/ZrO2-WOx KATALİZÖR ÜZERİNDE METHANE
ile SEÇİCİ KATALİTİK İNDİRGENMEDE OLUŞAN ARA ÜRÜNLERİN FT-IR SPEKTROSKOPİK KARAKTERİZASYONU
İLKNUR ÇAYIRTEPE Kimya Bölümü Yüksek Lisans
Tez Yöneticisi: Assoc. Prof. Margarita Kantcheva September 2004
Bu çalışma metan ile NO’nun seçici katalitik indirgenme mekanizmasını açıklamak için Pd/tungstenlenmiş zirkonyum yüzeyinde kuvvetlice bağlanmış NOx komplekslerinin methane varlığında oluşmasının,
kompozisyonun ve termal kararlılığının in-situ FT-IR spektroskopik çalışmasını içermektedir. Yüzey alanını geniş elde etmek için tungstenlenmiş zirkonyumun (ağırlıkça18.6 % WO3 nominal içerikli) hazırlanmasında Sol-gel polimer-template
sentezi seçilmiştir. İmpregnasyon yöntemi kullanılarak Pd(II) iyonları (ağırlıkça 0.1%) depolanmıştır. PXRD karakterizasyonu katalizörün tetragonal ve mesoporus fazlarını içerdiğini göstermiştir.
Tungstenlenmiş zirkonyum üzerine oda sıcaklığında NO adsorpsiyonu koordinasyona açık Zr4+ iyonlarının olduğunu göstermiştir. Pd içeren numunenin NO adsorpsiyonu iki çeşit Pd(II)’nin bulunduğunu açığa çıkarmış ve koordinasyona açık Zr4+ iyonları gözlenmemiştir. İki numune üzerindeki NOx
türleri (N2O3, nitro and nitrito iyonları) oda sıcaklığında NO’nun W6+=O
gruplarıyla oksitlenmesi sonucu üretilmiştir. Pd/tungstenlenmiş zirkonyum üzerinde paladyum(II) 623 K de NO’yu NO2’ye oksitleyebilmektedir.
sağlamıştır.Her iki numunede de oluşan nitratların termal kararlılıkları benzerdir. 673 K deki dinamik vakumlama sonrasında nitratlar yok olmuşlardır. Bununla beraber Pd/tungstenlenmiş zirkonyum üzerinde oluşan yüzey nitratlarının düşük konsantrasyonu, nitratların tungstenlenmiş zirkonyuma koordinasyonunu belirtmektedir.
Adsorbe olmuş NOx türlerinin yokluğunda iki numune de hidrokarbonu
aynı sıcaklıkta aktifleştirmiş olmasına rağmen, deneysel sonuçlar metanın NOx ile
daha önce kaplanmış tungstenlenmiş zirkonyum ve Pd/tungstenlenmiş zirkonyumun farklı şekillerde etkileştiğini göstermiştir. Tungstenmiş zirkonyumda yüzey nitratları metanın oksidasyonunu bastırırken, NOx ile daha
önce kaplanmış Pd/tungstenlenmiş zirkonyum nitrometan oluşmasını katalizlemektedir. Nitrometan, NO’nun metan ile seçici katalitik indirgenmesinde anahtar ara ürün olarak düşünülmektedir. Hidrokarbonun direk activasyonunu içeren ve seçici indirgenme ürünlerini (N2, CO2 and H2O) oluşturan bir
mekanizma önerilmiştir.
Anahtar Kelimeler: NO and NO/O2 adsorpsiyonu; in-situ FT-IR specktroskopi;
tungstenlenmiş zirconyum; Pd depolanmış tungstenlenmiş zirconyum; NO’nu metan ile seçici katalitik indirgenmesi; Mekanizma; Nitrometan.
ACKNOWLEGMENT
It is a pleasure for me to express my deepest gratitude to Dr. Margarita Kantcheva for her encouragement and supervision throughout my studies.
I would to thank to Olga Samarskaya and Tuğba Arzu Özal for their precious help and moral support.
I would like to thank all present and former members of Bilkent University Chemistry Department for their help.
I would like to express my deepest gratitude to my husband Fatih Çayırtepe for endless support and love.
TABLE OF CONTENTS
1. INTRODUCTION 1
1.1 General About the Selective Catalyti Reduction of NOx ... 1
1.2 Selective Catalytic Reduction by Methane-What is tha advantage.... 3
1.3 Main Characteristics of Tungstated Zirconia as a Support...5
1.4 Mechanism of Selective Catalytic Reduction of NOx on the Pd- containing Catalyst... 6
1.5 Identification of Adsorbed NOx species by FT-IR Spectroscopy... 8
2. EXPERIMENTAL 11 2.1 Sample Preparation... 11
2.1.1 Tungstated Zirconia... 11
2.1.2 Zirconia... 12
2.1.3 Palladium Modified Tungstated Zirconia... 12
2.2 Surface Area Measurements and XRD... 13
2.3 IR Spectroscopy... 13
2.3.1 Experimental Setup... 13
2.3.2 Activation of the Samples... 13
2.3.3 Adsorption of NO and NO/O2... 14
2.3.4 Interaction of the CH4 with the Catalysts... 14
2.3.5 Interaction of the Methane with the NOx-precovered catalysts... 14
3. RESULTS AND DISCUSSION 16 3.1 Characterization of the Samples... 16
3.1.1 BET Surface Area Measurements and XRD... 16
3.1.1.1 Tungstated zirconia... 16
3.1.1.2 Zirconia... 17
3.1.2 Tungsten Density... 19
3.1.3 FT-IR Spectra of the Activated Samples... 20
3.2 NO and NO/O2 Adsorption and Thermal Stability of the Adsorbed NOx species... 21
3.2.1 Adsorption of NO... 21
3.2.1.1 Adsorption of NO at Room Temperature on ZrO2... 21
3.2.1.2 Adsorption of NO on WZ at Room Temperature... 23
3.2.1.3 Adsorption of NO on Pd/WZ at Room Temperature.... 25
3.2.1.4 High Temperature Adsorption of NO on the Pd/WZ Catalyst... 26
3.2.2 Coadsorption of NO/O2 and Thermal Stability of NOx produced... 29
3.2.2.1 On the ZrO2 Sample... 29
3.2.2.2 On the WZ Suport... 31
3.2.2.3 On the Pd/WZ Catalyst... 34
3.2.3 Summary of The Results on NO and NO/O2 Adsorption on the Samples Studied... 38
3.3 Reactivity of The Adsorbed Coadsorption of NO/O2 and Thermal Stability of NOx produced... 39
3.3.1 “Blank NOx” Experiment... 39
3.3.1.1 With The WZ Support... 39
3.3.1.2 With The Pd/WZ Catalyst... 41
3.3.2 “Blank CH4” Experiment... 42
3.3.2.1 With The WZ Support... 42
3.3.2.2 With The Pd/WZ Catalyst... 44
3.3.3 Interaction of Preadsorbed NOx species with Methane...46
3.3.3.1 On The WZ Support... 46
3.3.3.2 On The Pd/WZ Catalyst... 50
3.4 Summary of The Results on the Reactivity of the Adsorbed NOx Species toward Methane... 54
LIST OF TABLES
1. Spectral characteristics of NOx species observed on
the metal oxides... 10
2. Tungstated zirconia sample notations...13
3. Pure zirconia sample notations... 14
4. BET surface areas of the samples... 17
5. Assignments of the FT-IR bands observed upon NO adsorption on the WZ support... 27
6. Assignments of the FT-IR bands observed upon NO/O2 coadsorption on the zirconia sample... 33
7. Assignments of the FT-IR bands observed upon NO/O2 coadsorption on the WZ support... 35
8. Assignments of the FT-IR bands observed upon NO/O2 coadsorption on the Pd/WZ catalyst... 40
LİST OF FIGURES
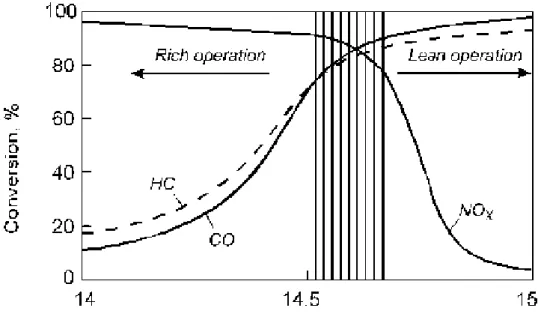
1 The conversion efficiency (%) of a three-way catalyst as a function of A/F-ratio. The lambda window, an A/F-ratio of
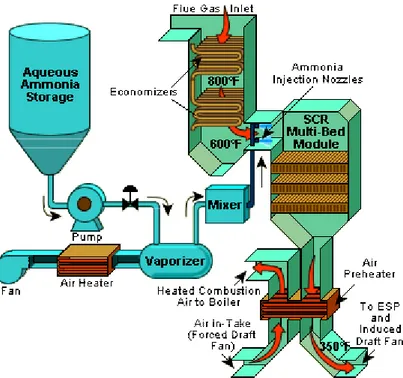
14.6 corresponds to stoichiometric operation... 2 2 Example SCR System for NOx control in a boiler... 3
3 NO conversion to nitrogen on Ag/Al2O3 using various
n-alkanes: (●) methane, (c) ethane, (▲) propane, (U) butane, () hexane, () octane. Conditions: NO = 1000 ppm,
alkane = 6000 ppm,, O2 = 10 %, H2O = 2 %, and
W/F = 0.12 g.s/cm3, except for methane-SCR... 8 4 Effects of the heating at 473 K and at 673 K, carbonization at
923 K, calcination at 773 K and heat treatments at 873 K and at 973 K on the X-ray diffraction patterns during the preparation of the tungstated zirconia sample... 19 5 Effects of the heating at 473 K and at 673 K, carbonization at
873 K and calcination at 773 K on the X-ray diffraction patterns during the preparation of the pure zirconia sample ( t: tetragonal,
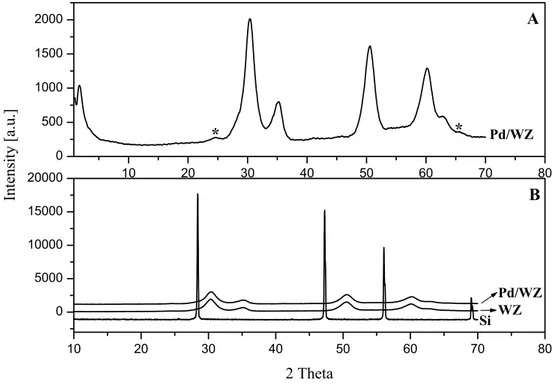
m: monoclinic)... 20 6 A: X-ray diffraction pattern after the preparation of Pd modified
tungstated zirconia sample (* indicates the monoclinic phase). B: X-ray diffraction patterns of the sample for comparison……... 21 7 FT-IR spectra of the activated zirconia (a), WZ sample (b) and
Pd/WZ catalyst (c). The spectra are taken at ambient temperature.... 23 8 FTIR spectra of adsorbed NO (1.34 kPa) on pure zirconia sample
at room temperature immediately (a), for 20 min (b), and after evacuation (c). The spectrum of the activated sample is used as
a background reference... 24 9 FTIR spectra of adsorbed NO (1.34 kPa) on the WZ support at
room temperature immediately (a), for 10 min (b), and after evacuation at room temperature for 15 min. The spectrum of the
10 FT-IR spectra of adsorbed NO (1.34 kPa) on the Pd/WZ catalyst at room temperature for 40 min (a) and after evacuation (b). The spectrum of the activated sample is used as a background
reference and the gas phase spectra are subtracted...28 11 FT-IR spectra of the Pd/WZ sample taken after adsorption of NO
(1.33 kPa) at room temperature for 15 min (a), after heating of the closed IR cell for 15 min at 623 K (b), and subsequent evacuation for 15 min at 623 K (c) then continuing heating the closed IR cell for 15 min at 723 K (d), at 773 K (e). Afterwards the closed IR cell was cooled to 623 K (f) to 523 K (g) and to RT (h). The spectrum of the activated sample is used as a background reference and the gas phase spectra are subtracted... 30 12 FT-IR spectra of NO (1.34 kPa) adsorbed on the zirconia support
at room temperature for 10 min (a), after subsequent introduction of O2 (2.66 kPa) for 35 min (b), and after evacuation for 15 min at
ambient temperature (c). The spectrum of the activated sample is used as a background reference... 31 13 FT-IR spectra obtained after adsorption of NO/O2 at RT followed
by evacuation for 10 min (a), after heating the zirconia containing adsorbed NOx species for 15 min in vacuum. The spectra are
recorded after cooling of the IR cell to the room temperature. The spectrum of the activated sample is used as a background
reference... 32 14 (A) FT-IR spectra of NO (1.34 kPa) adsorbed on the WZ support
at room temperature for 10 min (a), after subsequent introduction of O2 (2.66 kPa) for 30 min (b), and after evacuation for 10 min at
ambient temperature(c). The spectrum of the activated sample is used as a background reference. (B) FT-IR subtraction spectra of the WZ sample obtained from the spectra drawn in A... 34 15 FT-IR spectra obtained after adsorption of NO/O2 at RT
followed by evacuation for 10 min (a), after heating the WZ sample containing adsorbed NOx species for 15 min in vacuum.
temperature. The spectrum of the activated sample is used as a
background reference... 36 16 (A) FT-IR spectra of NO (1.34 kPa) adsorbed on the Pd/WZ
catalyst at room temperature for 25 min (a), after subsequent introduction of O2 (2.66 kPa) for 30 min (b), after evacuation
for 10 min (c) and for 30 min (d) at ambient temperature. The spectrum of the activated sample is used as a background reference and the gas phase spectra are subtracted. (B) FT-IR subtraction spectra of the Pd/WZ sample obtained from the
spectra drawn in A... 37 17 FT-IR spectra obtained after adsorption of NO/O2 at RT followed
by evacuation for 10 min (a), after heating the Pd/WZ sample containing adsorbed NOx species for 10 min in vacuum. The
spectrum of the activated sample is used as a background
reference and the gas phase spectra are subtracted...39 18 FT-IR spectra of the WZ support taken after adsorption of NO/O2
mixture (1.33 kPa : 2.66 kPa, NO:O2 = 1:2) at ambient temperature
followed by evacuation down to 3x10⁻³ Torr (a), after heating of the closed IR cell for 20 min at 723 K (b), then cooling of it to RT (c), and then evacuation of the gas phase at RT (d). The spectrum of the activated sample is used as a background reference... 42 19 FT-IR spectra of the Pd/WZ sample taken after adsorption of
NO/O2 mixture (1.33 kPa : 2.66 kPa, NO:O2 = 1:2) at room
temperature followed by evacuation for 30 min (a), after heating of the closed IR cell for 15 min, then cooling to RT (b). The spectrum of the activated sample is used as a background
reference and the gas phase spectra are subtracted... 43 20 FT-IR spectrum of the WZ support taken after addition of
methane (8 kPa) at room temperature, followed by heating of the closed IR cell for 20 min. Then cooling to RT (a). The spectrum of the activated sample is used as a background reference and the gas phase spectra are subtracted... 45 21 FT-IR spectrum of the Pd/WZ sample taken after addition of
the closed IR cell for 15 min. Then cooling to RT (a). The spectrum of the activated sample is used as a background reference and the gas phase spectra are subtracted ... 47 22 FT-IR spectra taken from “Blank CH4” experiment after the
final evacuation at room temperature for the WZ sample (a) and for the Pd/WZ sample (b)... 48 23 FT-IR spectra of the WZ support taken after adsorption of NO/O2
mixture (1.33 kPa:2.66 kPa, NO:O2 = 1:2) at RT followed by
evacuation for 15 min (a) and addition of 7.33 kPa of CH4 (b), after
heating of the closed IR cell for 20 min and then cooling to RT (c), subsequently evacuation of the gas phase at RT (d). The spectrum of the activated sample is used as a background reference... 50 24 FT-IR spectra of the WZ support taken from the “Blank CH4” (a),
the interaction of the preadsorbed NOx with CH4 (b) and the
“Blank NOx” (c) experiments after the final evacuation at room
temperature. The spectrum of the activated sample is used as a
background reference...52 25 (A) FT-IR spectra of the Pd/WZ catalyst taken after adsorption of
NO/O2 mixture (1.33 kPa:2.66 kPa, NO:O2 = 1:2) at RT followed
by evacuation for 15 min and addition of 7.33 kPa of CH4 (a),
after heating of the closed IR cell for 15 min at 473 K (b), 523 K (c), 573 K (d), 623 K (e), 673 K (f), 723 K (g) and then cooling to RT (h), subsequently evacuation of the gas phase at RT (i). The spectrum of the activated sample is used as a background reference. (B) FT-IR subtraction spectra of the Pd/WZ catalyst obtained from the spectra shown in panel A. (C) Gas phase spectrum of the corresponding spectrum shown in panel A... 54 26 FT-IR spectra of the Pd/WZ catalyst taken from the interaction
of the preadsorbed NOx with CH4 at 673 K (a) and after
evacuation at room temperature (b), the “Blank CH4” (c), and
the “Blank NOx” (d) experiments after the final evacuation at
room temperature. The spectrum of the activated sample is
1. INTRODUCTION
1.1. General about the Selective Catalytic Reduction of NO
xFossil fuels are combusted in transport devices, power plants, house heating and the chemical industry. Since the concept is almost the same for each application, transport devices are exemplified in order to explain how undesirable gases are produced.
Power is supplied to the majority of automobiles and trucks by a spark ignited gasoline engine. Gasoline is a mixture of paraffins and aromatic hydrocarbons, which combust in air very efficiently. In the engine the following ideal combustion reaction is considered to take place:
Petrol + O2 (in air) → CO2 + H2O + Heat
In addition to these products, carbon monoxide (CO), unburned hydrocarbons (HC), nitrogen oxides (NOx), hydrogen (H2) and oxygen (O2) can be identified in
exhaust gases [1]. NOx, CO and HC are the primary atmospheric pollutants. CO
poisons human-beings. HC is a potential greenhouse gas. Reaction between HC and NOx, which is enhanced by sunlight, leads to the formation of ground level
ozone. NOx particularly has the ability to cause the formation of photochemical
smog, acid rain and airborne particulate, through ammonium nitrate formation [1,2,3].
Because of the environmental reasons, in automobile exhaust gases CO and HC should be oxidized to CO2 and H2O meanwhile NOx should be reduced to
the desired product N2. The oxidation reactions are:
CxHn + (x+n/4) O2 → xCO2 + (n/2) H2O
2CO + O2 → 2CO2
And the reduction reactions are: 2NO + 2CO → N2 + 2CO2
2NO + H2 → N2 + H2O
New automobile technology requires catalysts, which cause above reactions to occur at lower temperatures. Since the catalyst simultaneously promotes these reactions, it is called the three-way catalyst (TWC). The catalytic performance of the three-way catalyst is a function of the engine air to fuel ratio (Fig.1). The best performance of TWC is obtained at the air-fuel ratio of 14.6:1. So non-selective reduction of NOx is accomplished by HC, CO and/or H2. Thus,
the primary pollutants in the exhaust gases are converted to desired chemical products [1,2,3].
Figure 1. The conversion efficiency (%) of a three-way catalyst as a function of
A/F-ratio. The lambda window, an A/F-ratio of 14.6 corresponds to stoichiometric operation, λ =1 [4].
The TWC is inefficient to reduce NOx for the lean-burn engine
applications (λ > 1), e.g. diesel engines and lean burn gasoline engines. The NOx
reduction by HC under the excess oxygen condition is called selective catalytic
reduction (SCR), in which the reductant intentionally reacts with nitrogen oxides
instead of being burned by oxygen [1,5,6]:
1.2. Selective Catalytic Reduction by Methane – What is the
advantage?
Industrial sources of NOx are from stationary plants, which are coal-
and oil-fired power plants, incinerators and gas turbines. NOx is currently
removed from exhaust streams in lean burn conditions and at lower temperature by the selective catalytic reduction with ammonia. A conventional SCR system is shown in Fig. 2 [7].
Figure 2. Example SCR System for NOx control in a boiler.
In SCR systems, ammonia vapor is used as the reducing agent and is injected into the flue gas stream, passing over a catalyst. The SCR with ammonia breaks down nitrogen oxide to form molecular nitrogen and water with the following reactions [8];
4NO + 4NH3 + O2 → 4N2 + 6H2O
2NO2 + 4NH3 + O2 → 3N2 + 6H2O
NOx emission reductions over 80-90% can be achieved and the
optimum temperature is usually between 300°C and 400°C, which is normally the flue gas temperature at the economizer outlet. The V2O5 loaded on TiO2, which is
further doped by manganese or molybdenum oxides, is the most used catalyst in the coal-fired plants. Yet there are other catalysts used industrially, which are activated carbon or platinum.
Even though SCR by NH3 is a very promising technology in terms of
efficiency and sulfur tolerance, it has some drawbacks at the same time. The toxicity is the main drawback in the use of ammonia and then precautions have to be taken during storage and transportation. The SCR with NH3 produces relatively
high N2O emissions compared to a conventional diesel engine. The amount of
ammonia injected into the SCR is critical to its successful operation. If too little ammonia is injected, some of the NOx will not be converted and if too much
ammonia is injected, some of the ammonia will "slip" past the catalyst and become a new emission problem. So the ammonia slip in SCR processes should be minimized that supposes an optimization of the ammonia feed. Finally, accumulation of ammonium sulfates can induce significant pressure drops and/or further corrosion phenomena, which alter the efficiency of SCR processes. Therefore this SCR with NH3 requires high capital investment, infrastructure
development and operational cost [3,5].
Presently, the use of hydrogen or hydrocarbon, mainly methane, could be an alternative, which offers new perspective in the utilization of natural gas. Selective catalytic reduction with hydrocarbons (SCR-HC) is expected to be a more convenient and cheaper alternative. In this respect, particularly the use of methane, readily available as natural gas, already in use as fuel and not corrosive, is very attractive. It also removes the storage problem. Furthermore, the slippage of hydrocarbon is more environmentally benign than ammonia, although it is still necessary to minimize the slippage. Thus, the use of methane offers the opportunity for significantly reduced capital and operating costs [10]. The selective catalytic reduction of NOx with methane is according to the following
reaction:
2NO + CH4 + O2 → N2 + CO2 + 2H2O
The most possible applications of this technology using methane as a reducing agent are for exhaust from natural gas-fired power plants and lean-burn natural–gas engines. The catalyst for mobile applications should have high activity and exceptional durability. The catalyst, which is candidate for the industrial power plants, should not be poisoned from water vapor and SO2.
Zeolite-based catalysts (e.g. Co-, Ga-, In-ZSM-5) can be particularly effective [3,11-16]. However, their NOx reduction activity and durability is deteriorated
when exposed to wet reaction conditions [3,12,14,16]. Use of simple oxide support with strong surface acidity provides an alternative approach to achieve better performance of the catalysts for the selective catalytic reduction of NO with methane in moist streams. The most promising materials as catalysts are supported metal oxides (e.g. Pd/TiO2, Pt/Al2O3, Pd/WOx-ZrO2,...) [17-19]. They
exhibit activity comparable to the zeolitic catalyst in the SCR of NOx by CH4.
Unlike zeolitic catalysts, supported noble metal oxides are much more stable hydrothermally. Furthermore, flexibility in the preparation of mixed metal oxides with a desired composition puts importance for practical catalysts [20].
1.3. Main Characteristics of Tungstated Zirconia as a Support
Acidity is the important phenomenon in oxide supports for the selective catalytic reduction of NOx with methane since the acidity of the support
determines the activity toward CH4 in the absence of zeolitic structure [20,21].
Acidity of the supports can be modified by choosing the appropriate synthesis techniques, doping with transition and/or non-transition oxides and adjusting the amount of modifiers.
Zirconia has taken interest as a support [18,22-26] due to the amphoteric properties [27]. Stable monoclinic and metastable tetragonal phases can be intentionally obtained by using various preparation routes, which have different starting raw materials and different pretreatment conditions, and by adding tiny amount of impurities [28-34]. Zhao et al. [35] reported that tetragonal zirconia has only Lewis acid sites on the surface but monoclinic zirconia has both Brønsted and Lewis acid sites. Bolis et al. [36] stated that Lewis acidic sites on the surfaces of tetragonal zirconia are much stronger than those on the surfaces of monoclinic zirconia even though the Lewis acid sites are more abundant on monoclinic zirconia. The acidity of the zirconia can be changed by doping with sulfate ions and tungsten oxide, both of which enhance the acidity. Whereas sulfated zirconia shows more acidic character than tungstated zirconia [36-38], sulfated zirconia suffers from rapid deactivation, sulfur loss during reaction
conditions and regeneration. Thus, tungstated zirconia has taken more attention as a strong solid acid.
It has been reported that WO3 supported on ZrO2 exhibits strong
Brønsted and Lewis acidity when WO3 covered the ZrO2 surface as a monolayer
[39-42]. Additionally, the preparation method involving simultaneous coprecipitation of tungsten with the formation of hydrous zirconia results in a catalyst and/or a support with increased strong acid site density as compared to the catalyst and/or the support prepared by tungsten impregnation of hydrous and calcined zirconia [43-46]. Chin et al. [18] observed that tungstated zirconia as a support of a DeNOx catalyst is more tolerant to water vapor because of the simple
structure and shows resistance to SO2 poisoning.
In order to increase the activity and selectivity toward the reduction of NO with methane Pd is deposited on the tungstated zirconia [18,19,47].
1.4. Mechanism of Selective Catalytic Reduction of NO
xon Pd-
containing Catalysts
Lobree et al. [48] proposed a reaction mechanism for the reduction of NO with CH4 by using mass spectroscopy and in-situ infrared spectroscopy. They
observed that the reduction of NO by CH4 started by the interaction of methane
with the adsorbed NO above 650 K, which produces CH2NO (or its isomer
CHNOH) in the form of Z¯H+[Pd(H)(CH2NO)]+Z¯ species. CH2NO decomposes
to produce water and highly reactive neutral CN species (Z¯H+[Pd(H)(CN)]+Z¯) as intermediates, which further react with NO or O2 (if present). Reaction with NO
forms N2 and CO, whereas reaction with O2 yields NO and CO. For this process
the principal active component in Pd-H-ZSM-5 is found to be Pd2+.
Shimizu et al. [49] investigated the mechanism of NO reduction by methane in the presence of O2 over Pd-H-Mordenite. They concluded from in-situ
UV-Vis, in-situ IR data and kinetic results that CH4-derived reactive species
reduces the adsorbed NO on Pd2+ in order to produce NH4+ on the zeolite acid
sites. The formed NH4+ reacts with Pd2+-nitrosyl and NO2 species, which results
in the desired product N2. They also believe that Pd2+-NO and NH4+ are the
Brønsted acid sites are indispensable for intermediates. And the kinetic results confirm the proposed mechanism.
Lukyanov et al. [50] stated from kinetic studies that interaction of methane with adsorbed NO2 initiated the catalytic reduction of NOx into N2 and
oxidation of CH4. The intermediate species, CH3•, was formed due to H
abstraction of NO2 since NO2 is a free radical and stronger oxidizing agent than
NO.
Mechanistic study on titania-supported palladium pointed out NH3 as
an intermediate [17,51]. Ozkan et al. observed that the linearly adsorbed NO on metallic Pd disappeared upon methane addition and NH3 adsorbed on Lewis acid
sites has been formed. They proposed that methane was activated on Pdº sites. Sun et al. [52] suggested nitromethane as an intermediate in the reduction of NO over Co2+ modified ZSM-5 catalysts. In the oxidizing atmosphere NO easily interacts with Co-ZSM-5, resulting in the formation of adsorbed NO2 species. And methane reacts with adsorbed NO2 to produce
nitromethane intermediate, which further reacts with NO2 to yield N2, H2O and
CO2.
If nitromethane is observed as an intermediate in the selective catalytic reduction of NO with CH4, isocyanide (NCO), hydrogen cyanide (HCN),
ammonia (NH3), carbamic acid, nitrous oxide (N2O), cyanuric acid (HNCO),
melamine can be detected as decomposition products/intermediates [53-57]. The temperature dependence of NO conversion to nitrogen with various hydrocarbons in excess oxygen (Fig. 3) displays a volcano shape [58]. This indicates that strongly bound NOx surface complexes are involved in the selective
conversion of NO to molecular nitrogen in excess oxygen. The aims of this study are:
(i) to determine by means of in situ FT-IR spectroscopy routes of formation, composition and thermal stability of strongly bound NOx
complexes on the surface of Pd/tungstated zirconia, and
(ii) to investigate transformation of surface NOx complexes in the presence
Figure 3. NO conversion to nitrogen on Ag/Al2O3 using various n-alkanes: (●)
methane, (c) ethane, (▲) propane, (U) butane, () hexane, () octane. Conditions: NO = 1000 ppm, alkane = 6000 ppm,, O2 = 10 %, H2O = 2 %, and
W/F = 0.12 g.s/cm3, except for methane-SCR (W/F = 0.9 gs/cm3) [58]
1.5. Identification of adsorbed NO
xspecies by FT-IR Spectroscopy
Adsorptions of NO and its coadsorption with O2 lead to formation
adsorbed NOx species, whose identifications are important for the mechanistic
study of selective catalytic reduction of NO.
The negatively charged species usually observed on the surface of the catalysts are nitrite (NO2¯) and nitrate (NO3¯) anions. The free nitrite anion has a
Cs symmetry and absorption bands due to νas(NO2) and νs(NO2) modes are at
1330 and 1260 cm-1, respectively [59]. When NO2¯ is coordinated by one or two
of its oxygen atoms, nitrito species are formed. When NO2¯ is coordinated by its
nitrogen atom, nitro compounds are formed. Characteristic IR regions for nitro/nitrito compounds are given in Table 1.
The free nitrate is planar and has a D3h symmetry. It shows three IR
active modes: asymmetric stretching (ν3) at 1430 cm-1, out-of-bending (ν2) at 825
cm-1 and in-plane-bending (ν4) at 722 cm-1 [60]. ν1 is symmetric and is only
observed in Raman spectra. After coordination, ν1 becomes IR active and the
of the splitting depends on the coordination type of the nitrates. The absorption ranges for nitrates are presented in Table 1.
The IR absorption bands for nitrite and nitrates sometimes overlap in the 1350-1550 cm-1 region. In that case, combination bands of nitrates can be used for structural identification. The combination bands of the bridged nitrates are at 2845-2800 cm-1 [ν
s(N=O) + νs(NO2)] and pair bands at 1980-1960 [νs(NO2) +
δ(ONO)] and 1900-1890 cm-1[ν
s(NO2) + δ(ONO)]. Bidentate nitrates produce
combination bands in the region of 2600 cm-1 [νs(N=O) + νs(NO2)] and pair of
bands at 1755 and 1700 cm-1 [νs(NO2) + δ(ONO)] [60].
Stability of adsorbed NOx species can give information about their
nature. The noncharged species, e.g. NO, (NO)2, NO2, N2O3 and N2O4, are
generally weakly adsorbed and easily removed from the surface upon evacuation at room temperature. But charged species, e.g. NO+, NO2¯, NO3¯, NO¯ are stable.
They need to be heated at elevated temperatures in order to desorp from the surface. The nitro species are more stable than the nitrito species and bridged and bidentate nitrates are more thermally stable than the monodentate nitrates.
Table 1: Spectral characteristics of NOx species observed on the metal oxides
[59,60,62,63]
NOx Species Vibration Modes Wavenumbers (cm-1)
Free nitrite ion, NO2¯
νas(NO2) νs(NO2) δ(ONO) 1250 1335 830 Nitro, M-NO2 νas(NO2) νs(NO2) δ(ONO) 1370-1470 1320-1340 820-850 Nitrito, M-O-NO ν(N=O) ν(NO) δ(ONO) 1400-1485 1050-1100 820-840 Chelated Nitrito, (M-O2)=N νas(NO2) νs(NO2) δ(ONO) 1270-1390 1170-1225 840-860 Bridging nitro, M-O-N(O)-M νas(NO2) νs(NO2) 1390-1520 1180-1260 Bidentate nitro νas(NO2)
νs(NO2)
1390-1520 1180-1260 Free nitrate ion, NO3¯ νas(NO2) 1430
Monodentate nitrate, M-O-NO2 νas(NO2) νs(NO2) ν(NO) 1450-1570 1250-1330 970-1035 Bidentate nitrate, M-O2NO νas(NO2) νs(NO2) ν(NO) 1200-1310 1003-1040 1500-1620 Bridged nitrate, (M-O)2=NO νas(NO2) νs(NO2) ν(NO) 1200-1260 1000-1030 1590-1660
2. EXPERIMENTAL
2.1. Sample Preparation
2. 1. 1. Tungstated zirconia
The mesoporous tungstated zirconia was synthesized by using polyvinyl alcohol (PVA) as a template [34]. The following procedure was applied; 30 g of ZrOCl2.8H2O was dissolved in 150 ml of H2O. 2.6 ml of 0.4 M
ammonium metatungstate solution was added to zirconium oxychloride solution while stirring. The mixed solution was heated up to 100ºC in a water bath and kept for 1 h at this temperature. Besides, the aqueous solution of PVA was prepared by dissolving 15 g of PVA in 150 ml of H2O (on heating). The hot
solutions of PVA and zirconium tungstate were mixed and kept for 1 h at 100ºC, then cooled to 60ºC. The colloidal solution was poured into a prepared buffer solution (NH4Cl + NH4OH) under stirring. Granules of a transparent elastic gel
were formed. And the obtained mixture stayed for 1 h at room temperature while stirring. Then it was washed with distilled water several times until the disappearance of chlorine anions in the washing water. The washed gel was dried in a drying oven at 373 K whereupon the transparent gel was heated up to 473 K and kept at this temperature for 24 h in air. Then the sample was placed into a quartz tube and heated slowly under vacuum up to 673 K. It stayed for 2 h at this temperature. Afterwards, the sample was heated up to the final carbonization temperature of 923 K and let to stand for 2h at this temperature. The obtained sample was calcined for 5 h at 773 K in air to burn the carbon-containing compounds. The black carbonized sample was completely white after ~30 minute (see flow chart 1).
The finally obtained tungstated zirconia sample was heat treated initially at 873 K then at 973 K for 1 h in order to follow the behavior of mesoporous phase. The nominal content of WO3 is 18.6 wt %.
Flow Chart 1 for the preparation of the WZ: Calcination at 773K for 5h Carbonization at 923K for 2h Heating at 673K for 2h Heating at 473K for 24h Dried in oven 373K Washing with distilled water Mixing at RT for Granules of transparent elastic gel Buffer Solution Cooled to Solution Mixing at 373K for 1h 15g of PVA + 150ml of H2O 373K for 1h ZrOCl+ 2 sol.
AMT sol. 2.6ml of 0.4M AMT solution 30g of ZrOCl2.8H2O + 150ml of H2O
This method is preferred to prepare the tungstated zirconia sample because:
• Simultaneous coprecipitation of tungsten with the formation of hydrous zirconia produces a material with increased strong acid site density,
• High surface area can be obtained due to the presence of the mesoporous phase,
• WO3 can cover the ZrO2 surface as a monolayer,
• Growing of ZrO2 crystals can be retarded due to pinning effect of WO3
and mesoporous phases.
In this synthesizing method, PVA acts as a templating agent in the coprecipitation of tungsten and hydrous zirconia and can remain in the material up to temperatures of 600-700ºC. So the crystallization of the zirconia occurs without a collapse of the mesoporous structure during the carbonization step. The residue of PVA after carbonization can be removed easily in the oxidizing atmosphere at lower temperature (500ºC).
The tungstated zirconia notations used further in the text are summarized in Table 2.
Table 2: Tungstated zirconia sample notations
Sample Treatment
WZ200 After drying the precipitate at 2000C for 24 h in air
WZ400 After heating in vacuum at 4000C for 2 h WZ650 After heating in vacuum at 6500C for 2 h WZ After calcination at 5000C for 5 h
WZ600HT After heating at 6000C for 1 h WZ700HT After heating at 7000C for 1 h
2. 1. 2. Zirconia
The mesoporous zirconia was synthesized just like in the case of the mesoporous tungstated zirconia but without using tungstate and the final carbonization temperature was chosen as 873 K.
The pure zirconia notations used further in the text are summarized in Table 3.
Table 3: Pure zirconia sample notations
Sample Treatment
Z200 After drying the precipitate at 2000C for 24 h in air Z400 After heating in vacuum at 4000C for 2 h
Z600 After heating in vacuum at 6000C for 2 h Z After calcination at 5000C for 5 h
2. 1. 3. Palladium Modified Tungstated Zirconia
Palladium nitrate is used as a source of Pd2+ ions. 0.001 M Pd2+ solution was prepared for the synthesis of 0.10% Pd on tungstated zirconia. 1.5 g of WZ was impregnated with 14.1 ml of 0.001 M Pd2+ solution. The impregnated samples were dried by stirring at mild heating. Then it was calcined at 773 K for 5 hours.
Pd/WZ notation for palladium modified tungstated zirconia is used further in the text.
2. 2. Surface Area Measurements and XRD
The BET surface area of the samples was measured by nitrogen adsorption at 77 K by using a MONOSORP apparatus from Quantachrome. Before the measurements, the samples were dehydrated at 573 K for 1 hour. XRD analysis was performed on a Rigaku Miniflex diffractometer with Ni-filtered Cu Kα radiation at ambient conditions. The scan speed was 1º/min.
2. 3. IR Spectroscopy
The FT-IR spectra were recorded on a Bomem MB 102 FT-IR (Hartman & Braun) spectrometer equipped with a liquid-nitrogen cooled MCT detector at resolution of 4 cm-1 (128 scans).
2. 3. 1. Experimental Setup
Two different types of IR cell were used in the experiments. One of the IR cell equipped with NaCl windows allowed the activation of the sample at high temperatures and the recording of the spectra at ambient temperature. The other type of the IR cell (Xenonum Scientific SVCS, USA) allowed recording of the spectra at ambient and elevated temperatures (with BaF2 windows). The sample
holder of the cell can be moved up and down relatively to the light beam, which gives the possibility for the subtraction of the gas phase spectrum when needed. . The IR cell is connected to a vacuum/adsorption apparatus.
2. 3. 2. Activation of the Samples
Self-supporting discs (0.040 g/cm2) were used for the FT-IR studies.
The pressed Pd/WZ sample was activated by heating for 1 h in vacuum at 723 K and in oxygen (13.3 kPa) at the same temperature followed by evacuation for 1 h at that temperature. The pressed WZ sample was activated by heating for 1 h in vacuum at 723 K and in oxygen (13.3 kPa) at the same temperature followed by evacuation for 1 h at 573 K.
The spectra of the activated sample were taken at high temperature and room temperature, which were used as background references. The spectra of the samples that were subjected to heat treatments at elevated temperatures were recorded at those temperatures. The high temperature background reference was used in the subtraction of the spectra taken at high temperatures and correspondingly the room temperature background reference was used for the spectra registered below 423 K.
When the experiment were performed at high temperatures, changes in the OH region could not detected because the water vapor (if produced) adsorbed dissociatively on the BaF2 windows, which were cooled by running water.
2. 3. 3. Adsorption of NO and NO/O2
99.9 % (Air products) purity of NO was used. NO adsorption was conducted at room temperature with the introduction of 1.33 kPa of NO and the evolutions of the IR spectra with time were taken.
Co-adsorption of NO and O2 was accomplished at room temperature
with the introduction of gas mixture (1:2) of NO and O2 for a given period of
time.
The thermal stability of the created NOx species was tested by heating
the catalyst for 15 or 20 min under vacuum in the temperature range 473-723 K.
2. 3. 4. Interaction of the CH4 with the Catalysts
8 kPa of methane was added into the IR cell in order to observe the interaction of CH4 with the catalyst. Then, the closed cell was heated from 523K
to 723 K and the samples were allowed to stay for 20 min at each temperature level.
2. 3. 5. Interaction of the Methane with the NOx-precovered catalysts
After the formation of NOx species by room temperature adsorption of
NO and O2 (1:2) followed by evacuation for 15 min, 7.33 kPa of CH4 was added.
The interaction of the methane with the NOx-precovered catalyst was observed in
the temperature range 523 – 723 K. The interaction time was chosen 15 or 20 min for each temperature level.
3. RESULTS AND DISCUSSION
3. 1. Characterization of the Samples
3. 1. 1. BET Surface Area Measurements and XRD Table 4: BET surface areas of the samples
Sample BET surface area [m2/g]
ZrO2 153
WZ 210
3. 1. 1. 1. Tungstated zirconia
X-ray diffraction pattern of the heated sample at 673 K, denoted by WZ 400, shows one sharp peak at 2.9º and two broad features in the range of 2θ from 20 to 38º and from 40 to 70º (Fig. 4). The broad peaks indicate a very low degree of crystallinity. Existence of mesoporous phase in the sample can be determined from the sharp peak at low angle [64].
The diffractogram of the carbonized sample at 923 K, designated by WZ 650, reveals that it consists of crystalline tetragonal zirconia phase and randomly distributed mesoporous phase.
The size of crystallites was calculated by the use of the Scherrer’s equation [65]:
t = 0.9λ / (B*cosθB)
where λ is the wavelength of the X-Ray, B is the full with at half maximum (in radian) of the reflection, θB is the position of the reflection in the XRD pattern and
t is the crystal size. Not only the crystallite size causes the broadening of the reflection peak but also the instrumental broadening causes. Slit widths, sample size, penetration in the sample, imperfect focusing and unresolved α1 and α2 peaks
of the source are the reason of the instrumental broadening. Instrumental peak broadening can be determined by using a very big crystal of the sample. Since
size of the sample, the full with at half maximum of the reflection band comes from the instrumental sources. So the peak broadening due to instrumental sources is removed. Si sample with 2000 nm crystallite size was used in order to determine instrumental broadening because big crystal of the sample of our interest is not possible. According to this method, the instrumental broadening is about 0.1º.
The crystallite size of tetragonal ZrO2 phase was calculated 4.7 nm after
the subtraction of the instrumental peak broadening.
The sample calcined at 773 K for 5 h (WZ) is still a mixture of tetragonal ZrO2 phase and randomly oriented mesoporous ZrO2 phase (Fig. 4).
The peak at low angle shifts to the left until the heat treatment at 873 K. This means that an opening of pores takes place. The peak intensities of tetragonal ZrO2 phase for WZ are higher than those for WZ 650. Contrary, the intensity of
the peak at 1.8º for WZ decreases relative to that of the peak at 2º for WZ 650. It indicates that after calcination, there is a simultaneous increase in the amount of the tetragonal ZrO2 phase and decrease in the amount of the mesoporous phase.
The tetragonal crystallite size is 4.9 nm for WZ. There is a small crystallite size difference between WZ 650 and WZ. It can be concluded that the presence of tungsten oxide and mesoporous phase stabilizes tetragonal ZrO2 crystallites and
retard the growth of ZrO2 grains. This is consistent with the literature data
[66-68].
Powder X-ray diffraction patterns of the heat treated samples (WZ600HT and WZ700HT) show that samples contain only crystalline tetragonal zirconia phase and the intensity of the peak at low angle belonging to mesoporous phase decreases considerably for WZ600HT and disappears completely for WZ700HT. It means that the mesoporous phase is not stable and pores collapse at high temperature. Furthermore the crystallite size of the tetragonal zirconia phase increases.
10 20 30 40 50 60 70 80 0 1000 2000 3000 4000 5000 6000 7000 8000 9000 WZ600HT WZ700HT WZ WZ650 WZ400 In te ns ity [ a. u. ] 2 Theta WZ200
Figure 4. Effects of the heating at 473 K and at 673 K, carbonization at 923 K,
calcination at 773 K and heat treatments at 873 K and at 973 K on the X-ray diffraction patterns during the preparation of the tungstated zirconia sample.
3. 1. 1. 2. Zirconia
The X-ray diffraction pattern of the heated sample at 673 K, denoted by Z 400, shows one broad peak at 5.1º and two broad features in the range of 2θ from 22 to 40º and from 40 to 70º (Fig. 5). The broad peaks show that the sample has a very low degree of crystallinity. There is a mesoporuous phase in the sample, which can be determined from the peak at low angle [64].
The diffractogram of the carbonized sample at 873 K, designated by Z 600, reveals that it consists of crystalline tetragonal zirconia phase and randomly distributed mesoporous phase.
The sample calcined at 773 K for 5 h, represented by Z, is a mixture of tetragonal and monoclinic ZrO2 phases (Fig. 5). The peak at low angle shifts to
that most of the mesoporous phase disappears and/or pores collapse at 773 K. The crystallite size of the tetragonal phase is 7.7 nm for Z.
The crystallographic phase compositions were calculated by using the Toraya et al. [69]. Then, the volume percentage of the tetragonal zirconia is 39%.
10 20 30 40 50 60 70 80 0 1000 2000 3000 4000 5000 m m m m m t t t m m m t t Z Z600 Z400 In te ns ity [ a. u. ] 2 Theta Z200
Figure 5. Effects of the heating at 473 K and at 673 K, carbonization at 873 K
and calcination at 773 K on the X-ray diffraction patterns during the preparation of the pure zirconia sample (t: tetragonal, m: monoclinic).
3. 1. 1. 3. Palladium modified Tungstated zirconia
Diffractogram of Pd impregnated on tungstated zirconia shows that it contains the crystalline tetragonal zirconia phase and randomly distributed mesoporous phase. But phase transformation from tetragonal to monoclinic has started in the sample, which can be differentiated from the appearance of the small peaks in Fig. 6.
10 20 30 40 50 60 70 80 0 5000 10000 15000 20000 B Si WZ Pd/WZ In tens ity [a.u .] 2 Theta 10 20 30 40 50 60 70 80 0 500 1000 1500 2000 A Pd/WZ * *
Figure 6. A: X-ray diffraction pattern after the preparation of Pd modified
tungstated zirconia sample (* indicates the monoclinic phase). B: X-ray diffraction patterns of the sample for comparison.
3. 1. 2. Tungsten Density
Theoretically the atomic ratio of Zr to W (Zr:W) was chosen 8.25:1, corresponding to 18.6% of WO3 by a mass content. This corresponds to nominal
surface density of 2.8 WO3/nm2, which is 0.5 of the monolayer. The coverage is
obtained by using the maximum packing density of planar WO3 species equal to
0.21 g WO3/100m2 [42].
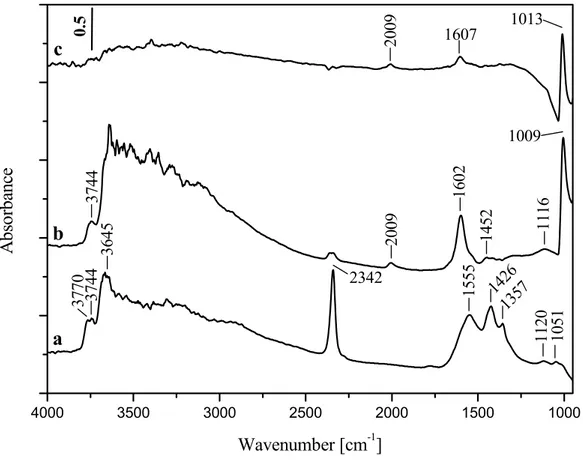
3. 1. 3. FT-IR Spectra of the Activated Samples
Fig. 7 shows FT-IR spectra of the activated Pd/WZ catalyst (spectrum c), WZ support (spectrum b) together with pure zirconia (spectrum a). The activated spectrum of the ZrO2 in the OH-stretching region displays a pair of
between 3500 and 3000 cm-1. According to the literature data [29,61,70], the band at 3770 cm-1 is attributed to terminal OH-groups due to the monoclinic phase. The band at 3744 cm-1 belongs to bibridged OH-groups and the band at 3645 cm-1 is assigned to tribridged OH groups from the monoclinic and tetragonal phases. The broad band is attributed to H-bonded tribridged hydroxyls. The band at 2342 cm-1 corresponds to adsorbed CO2 [69]. Bolis et al. [71] reported that relatively stable
CO2 adsorbed on tetragonal zirconia resisting room temperature evacuation. The
bands in the 1700 - 1100 cm-1 region are assigned to surface carbonates [70]. Most probably CO2 appears as a product of the decomposition of the residual
carbonates (produced from burning of the sample and adsorb on the surface when the temperature is lowered.
The spectrum of the tungstated zirconia sample (Fig. 7, spectrum b) in the OH-stretching region is characterized by the bands corresponding to bibridged terminal OH-groups (3744 cm-1) [29] and tribridged terminal hydroxyls (3645
cm-1) of the tetragonal zirconia. An intense band at 1009 cm-1 due to ν(W=O) and the respective overtone at 2009 cm-1 [72,73] are observed. These bands are typical of wolframyl species (W6+ =O) supported on zirconia [73]. The broad band in the 3600-3000 cm-1 region and band at 1602 cm-1 are due to adsorbed water, which requires prolonged activation in order to remove. The bands in the 1550 - 1100 cm-1 region are assigned to surface carbonates [29,70].
The spectrum of Pd/WZ catalyst is similar to that of WZ. The amount of adsorbed water is lower and no surface carbonates are observed.
4000 3500 3000 2500 2000 1500 1000
c
b
a
0. 5 10 51 11 20 1357 1426 15 55 1009 1013 1607 20 09 11 16 14 52 16 02 20 09 2342 36 45 37 70 37 44 37 44 A bso rb ance Wavenumber [cm-1]Figure 7. FT-IR spectra of the activated zirconia (a), WZ sample (b) and Pd/WZ
catalyst (c). The spectra are taken at ambient temperature.
3. 2. NO and NO/O
2Adsorption and Thermal Stability of the
Adsorbed NO
xspecies
3. 2. 1. Adsorption of NO
3. 2. 1. 1. Adsorption of NO at Room Temperature on ZrO2
Spectra of NO (1.34kPa) adsorbed at room temperature on the zirconia sample for a period of 20 min are shown in Fig. 8. The intense band at 1190 cm-1 (Fig. 8, spectrum b) is assigned to the ν(NO) stretching mode of anionic nitrosyl, NO¯ [61]. These species can form by disproportionation NO on the surface O2−
3NO + O2− → NO2 + 2NO− (1)
The NO2 produced can be adsorbed on the surface, leading to formation
of NO3¯ and NO2¯ species (bands in the 1600-1000 cm-1 region) [61,62,74]. The
presence of adsorbed NOx species causes perturbation of the isolated OH groups
at 3745 cm-1 and appearance of hydrogen-bonded hydroxyls. The weak band 1682 cm-1 is assigned to cis-HNO2 [61]. 4000 3500 3000 2500 2000 1500 1000 14 90 12 92 37 45 10 12 0. 25 15 85 12 43 11 90 12 92 14 92 16 10 A bso rb ance Wavenumber [cm-1] 16 82 c b a 11 90
Figure 8. FTIR spectra of adsorbed NO (1.34 kPa) on pure zirconia sample at
room temperature immediately (a), for 20 min (b), and after evacuation (c). The spectrum of the activated sample is used as a background reference.
3. 2. 1. 2. Adsorption of NO on WZ at Room Temperature
Spectra of NO (1.34 kPa) adsorbed at room temperature on the WZ sample are shown in the Fig. 9. The equilibrium between the gaseous NO and the adsorbed NOx species is established after 10 min. The band at 1180 cm-1 is
attributed to νas(NO2) mode of bidentate nitrito species [62]. The pair of bands at
monodentate nitro species [62]. This assignment is consistent with the fact that they resist evacuation at room temperature (see Fig. 9, spectrum c). In general, the nitro species are more stable than the nitrito species. The νs(NO2) modes of the
nitro and nitrito species fall below 1100 cm-1 and cannot be detected. The fact that NO2¯ species are formed indicates that the adsorbed NO undergoes oxidation.
Since Zr4+ ions are considered to be unreducible under these conditions, the following process, in which the surface hydroxyls at 3751 cm-1 and W6+ ions are involved, can be suggested:
2NO + W6+ + 2OH- → N2O3 + H2O + W4+ (2)
Indeed, appearance of a negative band at 3751 cm-1 and the positive absorption in the 3500 – 3000 cm-1 support the participation of the Zr4+−OH groups in this process leading to formation of adsorbed water molecules (δ(H2O)
at 1600 cm-1). The bands at 2054 and ~ 1992 cm-1 together with the weak absorption at 1350 and 1311 cm-1 correspond to the ν(N=O) and νs(NO2) modes
of N2O3 adsorbed on two different sites [59,74]. The νas(NO2) stretching vibration
is overlapped by the water band at 1600 cm-1. It can be proposed that N2O3
undergoes self-ionization according to the reaction:
N2O3 ⇔ NO+ + NO2− (3)
The NO+ species are identified by the absorption band at 2130 cm-1 due to the ν(NO) mode [59,61]. Most probably the NO2¯ species obtained in this process
are the bidentate nitrites at 1180 cm-1. They disappear together with the adsorbed N2O3 and NO+, which confirms the occurrence of the equilibrium (3). The bands
at 2284 and 2246 cm-1 are assigned to the ν(NN) modes of N
2O adsorbed on two
different sites [59,74]. The ν(NO) stretching vibration is at 1224 cm-1. The weak
band at 2446 cm-1 is due to the first overtone of the ν(NO) fundamental band of N2O. Since no Zr4+−NO bands are observed on the pure zirconia (see page 23,
Fig. 8), the absorption at 1915 cm-1 is attributed to Zr(IV) species, of with wolframyl groups are in their vicinity.
4000 3500 3000 2500 2000 1500 1000
c
b
a
2246 0.1 23 64 16 00 14 55 14 25 98 6 1018 11 80 12 24 13 11 13 50 14 25 14 55 16 00 16 62 18 17 19 15 19 92 20 54 21 30 22 84 24 48 37 51 Ab so rb an ce Wavenumber [cm-1]Figure 9. FTIR spectra of adsorbed NO (1.34 kPa) on the WZ support at room
temperature immediately (a), for 10 min (b), and after evacuation at room temperature for 15 min. The spectrum of the activated sample is used as a background reference.
The weak band at 1662 cm-1 is assigned to the ν(N=O) modes of adsorbed cis-HNO2 molecules [61], which are produced by interaction of the
NO2¯ species with the adsorbed water:
NO2¯ + H2O ↔ HNO2 + OH¯ (4)
An assignment of the IR bands observed upon NO adsorption on the WZ support is summarized in Table 5.
Table 5. Assignments of the FT-IR bands observed upon NO adsorption on the
WZ support.
NOx species Band Position (cm-1) Mode
NO+ 2130 ν(NO) H2O 1600 3751 δ(H2O) ν(OH) cis-HNO2 1662 ν(N=O) Bidentate nitrito, NO2¯ 1180 νas(NO2) Monodentate nitro, NO2¯ (two types) 1455 1425 νas(NO2) N2O3
(two different sites)
2054, 1992 1350, 1311 1600 ν(N=O) νs(NO2) νas(NO2) N2O
(two different sites)
2284, 2246 1224 2446 ν(NN) ν(NO) 2ν(NO) Zr4+−NO 1915 ν(NO)
3. 2. 1. 3. Adsorption of NO on Pd/WZ at Room Temperature
Spectra of adsorbed NO (1.34 kPa) on the Pd/WZ catalyst at room temperature are similar to those observed for the tungstated zirconia. Following differences should be noticed:
1. There are no Zr4+−NO nitrosyls.
2. The bands at 1863 and 1810 cm-1 are due to NO adsorbed on two different Pd(II) sites [75,76].
3. The adsorbed N2O3 (1935 and 1558 cm-1) and the nitrito species at 1166 cm-1
resist the evacuation. Since the surface OH groups are not perturbed, the following process leading to N2O3 formation can be proposed:
2NO + WO4+ → N
2O3 + W4+ (5)
2500 2000 1500 1000 b a 0.1 985 101 4 117 5 123 2 127 2 155 4 1814 186 5 192 8 204 4 210 8 224 0 A bs orbance Wavenumber[cm-1]
Figure 10. FT-IR spectra of adsorbed NO (1.34 kPa) on the Pd/WZ catalyst at
room temperature for 40 min (a) and after evacuation (b). The spectrum of the activated sample is used as a background reference and the gas phase spectra are subtracted.
3. 2. 1. 4. High Temperature Adsorption of NO on the Pd/WZ Catalyst
Figure 11 shows the spectrum of the Pd/WZ catalyst taken after adsorption of NO (1.33 kPa) for 15 min (spectrum a) at room temperature, followed by heating the closed IR cell for 15 min at 623 K (spectrum b). The latter treatment causes all of the NOx species observed at room temperature to
disappear. Two new bands at 1837 and 1790 cm-1 (shoulder) and weak band at 1610 cm-1 are detected. The gas phase spectrum recorded at 623 K (not shown)
contains NO2 in addition to NO. Some amount of N2O is also detected, which was
formed already at room temperature. Based on this, the band at 1610 cm-1 in spectrum b (Fig. 11) is attributed to adsorbed NO2. This experimental fact shows
that oxidation of NO to NO2 has occurred. In this process the Pd2+ sites are
involved because the W6+=O species are almost completely restored, whereas strong perturbation in the region of the Pd2+−NO nitrosyls is observed. The weak bands at 1863 and 1816 cm-1 corresponding to two types of Pd2+−NO nitrosyls have disappeared and considerably stronger bands at 1837 and at about 1790 cm-1 (shoulder) are observed instead. These two bands are assigned to two different Pd+−NO linear species, which correspond to the Pd2+−NO nitrosyls observed at
room temperature. The Pd+−NO nitrosyls display high thermal stability and do not disappear upon evacuation at 623 K (Fig. 11, spectrum c). Increasing the temperature of the closed IR cell to 773 K (Fig. 11, spectra d and e) leads first to removal of the adsorbed NO2 and then to loss of NO adsorbed on the Pd+ sites.
Cooling back to room temperature (Fig. 11, spectra from f to h) causes reappearance of Pd+−NO bands with reduced intensities, which indicates further oxidation of the adsorbed NO. The intensity of the band due to the adsorbed NO2
(1610 cm-1) increases with lowering the temperature, reaching maximum at 523 K. This band disappears at room temperature due to conversion of the adsorbed NO2 to surface nitrate and nitro species (1610, 1587, 1457 and 1360 cm-1).
2500 2000 1500 1000 1360 1837 1610 1587 1457 1837 1610
i
h
g
f
e
d
c
b
a
0.
1
976 976 1010 1016 2284 2242 2124 1935 1863 1816 1554 1225 1180 1610 1837A
bso
rb
ance
Wavenumber [cm
-1]
Figure 11. FT-IR spectra of the Pd/WZ sample taken after adsorption of NO (1.33
kPa) at room temperature for 15 min (a), after heating of the closed IR cell for 15 min at 623 K (b), and subsequent evacuation for 15 min at 623 K (c) then continuing heating the closed IR cell for 15 min at 723 K (d), at 773 K (e). Afterwards the closed IR cell was cooled to 623 K (f) to 523 K (g) and to RT (h). The spectrum of the activated sample is used as a background reference and the gas phase spectra are subtracted.
3. 2. 2. Coadsorption of NO/O2 and Thermal Stability of NOx produced
3. 2. 2. 1. On the ZrO2 Sample
4000 3500 3000 2500 2000 1500 1000 A bso rb ance Wavenumber [cm-1] 17 54 16 30 15 90 15 32 12 86 12 38 10 12 36 93 37 40 a b c 0.5
Figure 12. FT-IR spectra of NO (1.34 kPa) adsorbed on the zirconia support at
room temperature for 10 min (a), after subsequent introduction of O2 (2.66 kPa)
for 35 min (b), and after evacuation for 15 min at ambient temperature (c). The spectrum of the activated sample is used as a background reference.
Fig. 12 shows the spectra of the zirconia support obtained after the adsorption of 1.34 kPa of NO for 10 min (Fig. 12, spectrum a). Subsequent addition of 2.66 kPa of O2 to the IR cell for 35 min (Fig. 12, spectrum b) causes
formation of NO2 (the color of the gas phase has changed to brown) and
disappearance of the band at 1190 cm-1 corresponding to the ionic nitrosyl. The band at 1754 cm-1, which disappears after the evacuation at room temperature, is characteristic of adsorbed N2O4 [59]. The strong bands between 1650 and 1200
negative bands at 3740 and 3693 cm-1, which is accompanied by appearance of positive absorption in the region of the H-bonded OH groups, suggests that the surface nitrates are formed by disproportionation of NO2 with the involvement of
the isolated surface hydroxyls [77,78]:
2OH¯ + 3NO2 → 2NO3¯ + NO + H2O (6)
4000 3500 3000 2500 2000 1500 1000 a 723 K 673 K 623 K 573 K 523 K 369 3 374 0 1. 0 1045 143 2 135 6 2344 153 2 1630 128 6 161 3 159 0 155 9 123 0 A bso rb ance Wavenumber [cm-1]
Figure 13. FT-IR spectra obtained after adsorption of NO/O2 at RT followed by
evacuation for 10 min (a), after heating the zirconia containing adsorbed NOx
species for 15 min in vacuum. The spectra are recorded after cooling of the IR cell to the room temperature. The spectrum of the activated sample is used as a background reference.
The nitrate species resist room-temperature evacuation (Fig. 12, spectrum c). However, heating the NOx- precovered sample under vacuum in the
523 – 573 K temperature range (Fig. 13, spectra b and c) causes disappearance mainly of the monodentate nitrates at 1532 and 1286 cm-1 [59]. The bidentate
(1630, 1590 and 1233 cm-1) nitrates display higher thermal stability and disappear from the spectrum after dynamic evacuation at 723 K [59,62].
The assignment of the IR bands observed upon NO/O2 coadsorption on
the zirconia sample is summarized in Table 6.
Table 6. Assignments of the FT-IR bands observed upon NO/O2 coadsorption on
the zirconia sample.
NOx species Band Position (cm-1) Mode
Monodentate NO3¯ 1532 1286 νas(NO2) νs(NO2) Bidentate NO3¯ 1630-1613,1590,1559 1230 ν(N=O) νas(NO2) N2O4 1754 ν(N=O) 3. 2. 2. 2. On the WZ Support
Figure 14 shows the spectra of the WZ support obtained after the adsorption of 1.34 kPa of NO for 10 min (Fig. 14A, spectrum a), followed by the addition of 2.66 kPa of O2 to the IR cell for 30 min (Fig. 14A, spectrum b).
Compared to the pure zirconia, the amount of the adsorbed species observed in the presence of the gas phase is considerably larger. The weakly adsorbed species, which disappear after evacuation at room temperature (Fig. 14B), are identified as follows (see Table 7 for the assignment of the bands): N2O3 adsorbed on two
different sites (1945, 1885, 1582, 1514, 1288 and 1274 cm-1), N2O4 (1745 and
1288 cm-1) and NO2 (1618 cm-1) [59,78]. The strong band at 2185 cm-1, which
decreases in intensity after the evacuation, is typical of NO+ species. Formation of
large amounts of oxides of nitrogen with oxidation numbers +3 and +4, which is not observed in the case of NO/O2 adsorption on pure zirconia, suggests that in
the oxidation of NO not only O2 but also the wolframyl, W6+=O, species are
(shifted to 984 cm-1) due to perturbed wolframyl groups. The following processes can be proposed: NO + WO4+ → NO2 + W4+ (7) NO + NO2 → N2O3 (8) 2NO2 → N2O4 (9) 4000 3500 3000 2500 2000 1500 1000 c b 36 79 0. 5 Ab so rb an ce Wavenumber [cm-1] 37 46 21 85 26 15 19 81 19 07 16 30 15 82 1223 17 45 98 4 1269 10 36 10 12 a A 2500 2000 1500 1000 98 3 10 12 B c-b 0. 25 19 45 1885 1288 17 45 1582 16 55 11 98 15 14 1274 10 35 16 18
Figure 14. (A) FT-IR spectra of NO (1.34 kPa) adsorbed on the WZ support at
room temperature for 10 min (a), after subsequent introduction of O2 (2.66 kPa)
for 30 min (b), and after evacuation for 10 min at ambient temperature(c). The spectrum of the activated sample is used as a background reference. (B) FT-IR subtraction spectra of the WZ sample obtained from the spectra drawn in A.
As in the case of pure zirconia, the bands at 1630, 1582 and 1223 cm-1 resisting the evacuation correspond to bidentate nitrates. They can form by both disproportionation (reaction 6) and self-ionization of NO2/N2O4 [61]:
The weak bands at 2615, 1981, and 1907 cm-1 (Fig. 14A, spectrum c) correspond to combination modes of the fundamental nitrate bands.
Table 7. Assignments of the FT-IR bands observed upon NO/O2 coadsorption on
the WZ support.
Species Band, cm-1 Mode
NO+ 2185 ν(NO) N2O4 1745, 1288 νas(NO2) νs(NO2) N2O3 1945, 1885 1582,1514 1288,1274 ν(N=O) νas(NO2) νs(NO2) NO2 1618 νas(NO2) Monodentate NO3¯ 1514 1274 1035 νas(NO2) νs(NO2) ν(N=O) Bidentate NO3¯ 1630, 1582 1223 1755 2614 ν(N=O) νas(NO2) νs(NO2) + δ(ONO) ν(N=O) + νs(NO2)
The thermal stability of the adsorbed NO3¯ species is lower than that on
pure zirconia. They disappear after the evacuation at 673 K (Fig. 15). The negative absorption in the 3600 – 3000 cm-1 region and the band at 1600 cm-1 observed in the spectra d and e (Fig. 15) are due to desorbed water molecules initially present in the activated sample. The weak negative bands at 1455 and 1425 cm-1 indicate that there is a loss in the carbonate species present as

![Table 1: Spectral characteristics of NO x species observed on the metal oxides [59,60,62,63]](https://thumb-eu.123doks.com/thumbv2/9libnet/5759646.116486/26.892.188.705.166.1061/table-spectral-characteristics-x-species-observed-metal-oxides.webp)