Segmentation of Cervical Cell Images
Aslı Kale, Selim Aksoy Department of Computer Engineering
Bilkent University Bilkent, 06800, Ankara, Turkey {akale,saksoy}@cs.bilkent.edu.tr
Abstract—The key step of a computer-assisted screening system that aims early diagnosis of cervical cancer is the accurate segmentation of cells. In this paper, we propose a two-phase approach to cell segmentation in Pap smear test images with the challenges of inconsistent staining, poor contrast, and overlapping cells. The first phase consists of segmenting an image by a non-parametric hierarchical segmentation algo-rithm that uses spectral and shape information as well as the gradient information. The second phase aims to obtain nucleus regions and cytoplasm areas by classifying the segments resulting from the first phase based on their spectral and shape features. Experiments using two data sets show that our method performs well for images containing both a single cell and many overlapping cells.
I. INTRODUCTION
Cervical cancer can be prevented if it is detected and treated early. Pap smear test is a manual screening procedure used to detect cervical cancer or precancerous changes in an uterine cervix by grading cervical cells based on color, shape and texture properties of their nuclei and cytoplasms. A computer-assisted screening system for Pap smear tests will be very beneficial to prevent cervical cancer if it increases the reliability of the diagnosis. The first and the most crucial step of such a system is the accurate segmentation of cells along with their nuclei and cytoplasms.
There are many studies related to segmentation of cy-topathological images. However, cell segmentation is still a problem due to the complexities of cell structures resulting from inconsistent staining, poor contrast, and overlapping cells [1]. Global approaches such as thresholding, clustering, and histogram-based methods lead to unsatisfactory results due to the variable staining existing even within a single cell [2]. Such problems can be partially avoided using local information by exploiting local relative changes to find the boundaries between different cell structures. For example, methods using marker-based watershed segmentation rely on the gradient information but finding a corresponding marker for each object is a major problem because of the variable nature of overlapping cells [3]. Furthermore, there are parametric segmentation procedures incorporating shape priors [4], [5], [1], [3]. However, a single set of parameters that works well for all cells in an image is almost impossible to find. Poor contrast resulting from focusing issues also causes initialization and convergence problems for these
shape models. In addition, some approaches require images of a single cell as inputs where the segmentation reduces to a binary problem but it is not always straightforward to extend them to the case of multiple cells [6], [4].
In this work, we propose a two-phase approach to cell segmentation in Pap smear test images with the challenges of inconsistent staining, poor contrast, and overlapping cells. Our segmentation algorithm is generic so that it can handle Pap smear test images containing a single cell as well as many overlapping cells. The first phase consists of parti-tioning an image by a non-parametric hierarchical segmen-tation algorithm that uses the spectral and shape information as well as the gradient information. After constructing a hierarchical tree by performing multi-scale watershed seg-mentation on the image, we automatically select the most meaningful regions of that tree by maximizing a measure composed of two factors, namely spectral homogeneity and circularity. The multi-scale watershed-based segmentation that uses local gradient information and the following region selection procedure at the end of the first phase enable the algorithm to perform well under inconsistent staining and poor contrast conditions in images containing multiple cells. The second phase aims to identify the nucleus and cytoplasm areas by classifying the segments resulting from the first phase using multiple spectral and shape features.
In the rest of the paper, Section II presents the proposed cell segmentation approach. Section III describes the classi-fication of segments as nucleus or cytoplasm. Section IV presents the experiments using two data sets. Section V provides a summary and future directions.
II. CELL SEGMENTATION
Our main goal of segmenting a cell region containing either a single cell or multiple overlapping cells is to obtain a corresponding segment for each nucleus that captures the true structure of that nucleus well. Partitioning of the cytoplasm of the cell region into several segments is not as critical because the obtained segments are later to be classified as nucleus or cytoplasm.
Below, we present a non-parametric hierarchical segmen-tation algorithm where a hierarchical tree is constructed from the candidate regions extracted by multi-scale watershed
segmentation. We select the most meaningful regions in the tree by optimizing a measure.
A. Hierarchical region extraction
We utilize the dynamic concept associated with regional minima for hierarchical region extraction. A regional mini-mum consists of pixels with the same intensity value t and pixels on its external boundary having a value greater than t. When we consider an image gradient as a topographic surface, the dynamic of a regional minimum is the minimum height that a point in the minimum has to climb to reach a lower regional minimum.
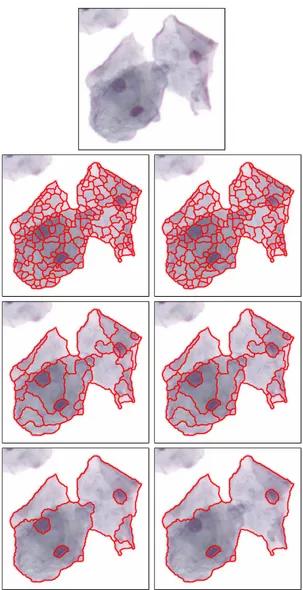
We calculate a set of nested partitions of a given image by applying the watershed segmentation to the h-minima transform of the image gradient for increasing values of h. The h-minima transform suppresses all minima whose dynamic is less than or equal to a given threshold h. Thus, the watershed partition at scale s becomes the watershed of the image gradient whose regional minima of dynamic less than or equal to s are filtered using the h-minima transform. Figure 1 shows the multi-scale watershed partitioning of an example cell image at six different scales. As the scale increases, more regional minima are filtered, and the coarsest partition becomes the entire image obtained from a single regional minimum of the largest dynamic. Note that a correct region for each nucleus is obtained at some scale because the nucleus regions are associated with higher dynamic values. All regions of each scale are considered as candidate meaningful segments. We construct a hierarchical tree from these regions where each segment is a node and there is an edge between two nodes of consecutive scales if one node is contained within the other. Thus, the leaf nodes represent the regions extracted by the watershed segmentation of the raw image gradient and the root becomes the whole image.
B. Region selection
Our next goal is to select the most meaningful segments among those appearing at different levels of the hierarchical tree. Nucleus regions are considered as the most meaningful segments where they can be differentiated according to their spectral homogeneity and shape.
The goodness measure for a node is determined to be the product of two factors. We introduce a homogeneity measure as the first factor. Homogeneous nucleus regions are obtained at some levels of the hierarchy where they stay the same for some number of levels and then face a large change in terms of homogeneity due to merging with their surrounding cytoplasm segments. The segments we are interested in correspond to the homogeneous regions right before this change.
The homogeneity measure for a node R1 is calculated
according to the spectral similarity between the pixels of
Figure 1. Part of an example image and the candidate segments obtained by multi-scale watershed segmentation at scales 5, 6, 24, 25, 37, and 39. These scales show example cases where significant merges occur.
that node and its parent node R2 using an F-statistic
F = (n1+ n2− 2)n1n2 n1+ n2 (m1− m2)2 s2 1+ s22 (1) where n1 and n2 are the number of pixels in R1 and R2,
respectively. The corresponding mean mi and scatter s2i for
Ri, i = 1, 2 are obtained by using gray level information. We
obtain a small F-value when the region remains the same or it merges with similar regions to form its parent in the next scale. When the F-value is large, it means that the region merged with the regions having different spectral features. Thus, this F-statistic is used as the homogeneity measure of a node.
As the second factor, we define a circularity measure for a node because nucleus regions can also be differentiated according to their shape. In order to calculate this measure, we first find the eccentricity of the ellipse that has the same
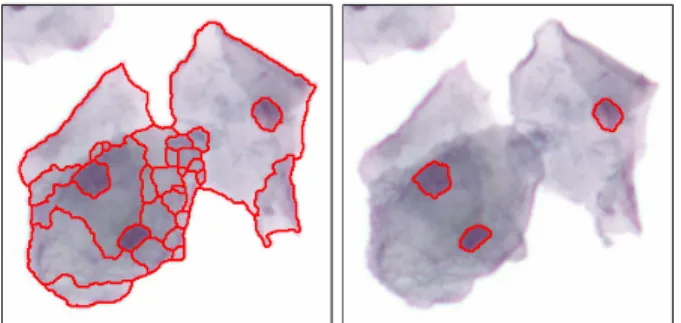
Figure 2. Segmentation (left) and classification (right) of an example image. Only the boundaries of nucleus regions are shown on the right.
second moments as the corresponding region of the node. The eccentricity is minimum for a circle and maximum for a line segment. We determine the circularity measure for a node as the multiplicative inverse of its eccentricity so that it is maximized for a region that has a circular shape.
Given the goodness measure of each node as the product of the two factors described above, the most meaningful seg-ments are selected using the two-pass algorithm described in [7]. The goal of the first pass that is bottom-up is to find the nodes having a measure greater than all of their descendants. The second pass that is top-down selects the most meaningful nodes having the largest measure on their corresponding paths in the tree. Figure 2 illustrates the segmentation result for an example image. The final most meaningful segments include all of the individual nucleus regions as well as sub-regions related to cytoplasm areas.
III. NUCLEUS AND CYTOPLASM CLASSIFICATION
In this step, we propose to divide a cell region into nucleus and cytoplasm regions by classifying the segments obtained in the previous step as nucleus or cytoplasm based on multiple spectral and shape features, namely, their size, mean intensity, circularity, and homogeneity attributes. The classification is performed using a support vector machine (SVM) with a radial basis kernel function. The final cy-toplasm region is calculated as the union of all segments classified as cytoplasm. Figure 2 shows the classification result for an example image.
IV. EXPERIMENTS
The Herlev data set contains 917 images of a single cervical cell. Each cell image is classified into one of 7 classes by experts. The distribution of the data among the classes are given in Table I. We evaluated cell segmentation using this data set because it includes manual segmentation results for all images.
The Hacettepe data set consists of 82 Pap smear test images with 2048 × 2048 pixels. As can be seen from the example images in Figure 3, these images are more realistic with the challenges of overlapping cells, poor contrast, and inconsistent staining. In order to evaluate nucleus and
Table I
ZSIMEANµZSIAND STANDARD DEVIATIONσZSIOF EACH CLASS FOR THE GROUND TRUTH COMPARED TO OUR SEGMENTATION.
Class name Class size µZSI± σZSI Superficiel squamous 74 cells 0.93 ± 0.05 Intermediate squamous 70 cells 0.95 ± 0.03 Columnar 98 cells 0.90 ± 0.07 Mild dysplasia 182 cells 0.94 ± 0.08 Moderate dysplasia 146 cells 0.93 ± 0.08 Severe dysplasia 197 cells 0.92 ± 0.10 Carcinoma in situ 150 cells 0.90 ± 0.12
Figure 3. Example images from the Hacettepe data set.
cytoplasm classification, we constructed a data set from the corresponding feature vectors of 1452 nucleus and 7726 cytoplasm regions resulting from segmenting the images of Hacettepe data.
A. Evaluation of segmentation
The performance of our segmentation algorithm for lo-cating nucleus regions along with their boundaries was compared against the ground truth of the Herlev data using the Zijdenbos similarity index (ZSI). In our segmentation result, we used the segment with the highest overlap with the ground truth nucleus region for comparison.
ZSI is defined as the ratio of twice the common area between two regions to the sum of the individual areas. It is sensitive to differences in size and location where an ZSI greater than 0.7 indicates an excellent agreement between the regions [8]. The ZSI for our segmentation had a mean larger than 0.9 and standard deviation smaller than 0.2 for all classes as in Table I.
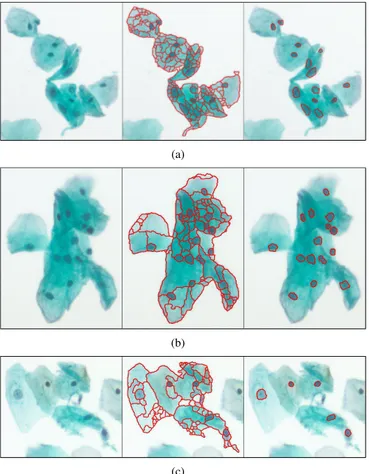
Segmentation and classification results of example images from the Hacettepe data are given in Figure 4. We obtained
(a)
(b)
(c)
Figure 4. Example segmentation and classification results for the Hacettepe data.
the nucleus regions for all images. This means that the nucleus regions were generated at some levels of the hi-erarchical tree, and they were found as the most meaningful nodes on their paths in the hierarchy. On the other hand, there were some occasions in which segments of nucleus regions could not be obtained using our method where, for example, a nucleus region never appeared in the hierarchy due to its noisy texture, or although it appeared in the hierarchical tree, its ancestor at a higher level was found to be more meaningful because of our heuristics. However, our method is generic and allows to employ additional heuristics for defining meaningfulness of a region.
B. Evaluation of classification
The data set used for evaluation of the classification was partitioned into equally sized training and test sets. After training the SVM, we classified the test set and obtained the confusion matrix in Table II. The overall correct classification rate was 96%.
V. SUMMARY
We described a two-phase approach to cell segmentation in Pap smear test images with the challenges of inconsistent
Table II
CONFUSION MATRIX FOR CLASSIFICATION OF REGIONS AS NUCLEUS AND CYTOPLASM.
Nucleus Cytoplasm Total
Nucleus 627 99 726
Cytoplasm 50 3813 3863
staining, poor contrast, and overlapping cells. Our segmen-tation algorithm was generic so that it could handle images containing a single cell as well as overlapping cells. The first phase partitioned a cell image using a non-parametric hierarchical segmentation algorithm that automatically se-lected meaningful segments from a hierarchy constructed using multi-scale watershed segmentation. The second phase involved classification of the resulting segments as nucleus or cytoplasm with an SVM classifier using multiple spectral and shape features. As future work, we will incorporate other heuristics such as size to improve the first phase. We will also experiment with nucleus and cytoplasm classification using different classifiers.
ACKNOWLEDGMENT
This work was supported in part by the TUBITAK CA-REER Grant 104E074.
REFERENCES
[1] S. Shah, “Automatic cell image segmentation using a shape-classification model,” IEICE Transactions on Information and Systems, vol. E91-D-7, pp. 1955–1962, 2008.
[2] H. S. Wu, J. Barba, and J. Gil, “Iterative thresholding for seg-mentation of cells from noisy images,” Journal of Microscopy, vol. 197, no. 3, p. 296, 2000.
[3] P. Huang and Y. Lai, “Effective segmentation and classification for HCC biopsy images,” Pattern Recognition, 2009. [4] H. S. Wu, J. Barba, and J. Gil, “A parametric fitting
algo-rithm for segmentation of cell images,” IEEE Transactions on Biomedical Engineering, vol. 45, no. 3, pp. 400–407, 1998. [5] P. Bamford and B. Lovell, “Unsupervised cell nucleus
segmen-tation with active contours,” Signal Processing, vol. 71, no. 2, pp. 203–213, 1998.
[6] S. S. F. Yang-Mao, Y. Y. K. Chan, and Y. Y. P. Chu, “Edge enhancement nucleus and cytoplast contour detector of cervical smear images,” IEEE Transactions on Systems, Man, and Cybernetics, Part B: Cybernetics, vol. 38, no. 2, pp. 353–366, 2008.
[7] H. G. Akcay and S. Aksoy, “Automatic detection of geospa-tial objects using multiple hierarchical segmentations,” IEEE Transactions on Geoscience and Remote Sensing, vol. 46, no. 7, pp. 2097–2111, July 2008.
[8] A. Zijdenbos, B. Dawant, R. Margolin, and A. Palmer, “Mor-phometric analysis of white matter lesions in MR images: method and validation,” IEEE Transactions on Medical Imag-ing, vol. 13, no. 4, pp. 716–724, 1994.