Corresponding Author. Email: [email protected] 95 An International Journal of Optimization
and Control: Theories & Applications Vol.2, No.2, pp.95-104 (2012) © IJOCTA ISSN: 2146-0957 eISSN: 2146-5703 http://www.ijocta.com
Simulation Based Optimization for World Line Card Production System
Sinan APAKa and Sami ERCANb
a
Department of Industrial Engineering, Istanbul Arel University-Turkey Email: [email protected]
b
Department of Industrial Engineering, Istanbul Arel University-Turkey Email: [email protected]
(Received February 08, 2012; in final form June 05, 2012)
Abstract. Simulation based decision support system is one of the most commonly used tools to examine complex production systems. The simulation approach provides process modules which can be adjusted with certain parameters by using data relatively easily obtainable in production process. World Line Card production system simulation is developed to evaluate the optimality of existing production line via using discrete event simulation model with variety of alternative proposals. The current production system is analysed by a simulation model emphasizing the bottlenecks and the poorly utilized production line. Our analysis identified some improvements and efficient solutions for the existing system.
Keywords: Decision support system; Simulation language; Simulation based optimization. AMS Classification: 00A72, 81T80, 90B90, 90B99
1. Introduction
Well established production lines have to adapt quick reactions due to market needs with an optimized production systems. These challenges force industrial engineers to consider multiple parameters to improve productivity in industrial environment. There have been some difficulties while analyzing running production systems to find analytical solutions. The reason would be the complexity of stochastic characteristics of such systems although simulation is an effective solution method that could handle large scale stochastic production systems. In other words simulation would be an efficient tool for enabling concurrent design and production efficiency [1].
An effective approach for improving performance of a manufacturing shop is to develop a simulation model that meets the desired objectives. Thus, using simulation models can be defined as; to model when system data is not available in detail, the data which will be used to anayze the simulation model later is
collected cheaper than in real life, to study the internal complex interactions in the system and experiment on them, to provide for observing the system being simulated, to eliminate deficiencies not seen before, to establish more effective physical and operational system, to support the truthness of analytical solutions, and to simulate the real time of dynamic systems that can be observed in a compressed or expanded time [2].
The discrete-event simulation optimization procedures perform on a discrete stochastic problem to determine the best design alternative [3]. Interactive decision support system with computer – based system helps decision makers to identify and optimize the production process. Simulation analysis with existing data provides forecasts on the basis of the given input values. This gives production managers the time to react to potential problems and evaluate alternatives. It is possible to strike a better balance between multiple parallel customer orders and finite resources. Some of the benefits of implementing
an operational simulation system include: less effort in planning day-to-day schedules, ensuring on time delivery for customer orders, synchronizing flow through the plant and minimizing setups and changeovers. In addition, these systems can provide early warnings of potential problems, check critical resources and materials, and allow users make optimal decisions.
A line card is a modular electronic circuit on a printed circuit board that interfaces with a telecommunications access network. A world line card (WLC) is capable of terminating more than one type of service. A WLC production lines usually include multi stage, multi server production line with variable processing times although it is desired to achieve the shortest production time in these work stations. In general, the main problems on such production lines are the bottlenecks and low utilization rates at some stages. Thus, an analysis becomes necessary while considering the number of machines and the number of workers. This study investigates the required number of additional machines and the number of additional workers for bottlenecked stations to meet the demand and balance the different work centers ensuring a well-designed layout. Paper applies simulation to evaluate alternative choices for decision makers through “what-if” scenarious.
The paper is organised as follows: The next section reviews some previous studies using the simulation based decision support system optimization approach. Production line, and its characteristics, are described in Section 3. The application of simulation, simple decision support system (DSS) model building, optimization, sensitivity analysis and validation are presented in Section 4. Finally, the research conclusion remark is summarized in Section 5. 2. Decision Making with Simulation for
Optimization
The objective of this paper is to analyse the performance of the current production system and determine the optimum working conditions using simulation optimization. We want to simulate the throughput rate, the average amount of time parts spend in the system, the length of the queues in front of each station and the utilisation levels of machines.
To efficiently use simulation in the decision process, integration of decision support system
with simulation has been emphasized. Simulation is the most flexible of all operations research modeling techniques and can be applied in different areas such as supply chain, factory floor scheduling systems, air-traffic control, scientific applications, decision-making, etc [4]. Therefore, simulation would be used to model current and desired working systems optimality. We use simulation to estimate the performance of a system under different operating conditions. Simulation models were used in many scientific areas to determine optimality [5].
Thompson [6] came up with the idea of integrating simulation and real time controls two decades ago. A review on simulation based real time decision making for manufacturing automation systems is presented by Yoon and Shen [7]. Kadar et al. [8] explain how to use DSS to support production planning and schedule decisions with an explanatory case in production.
Many simulation-based scheduling and planning tools are currently being developed. Some of these tools have been presented by Hindle and Duffin, and Vasudevan et al. [9, 10]. Optimization algorithms or scheduling rules can be embedded into the simulation model; in other cases, the system can combine optimization and simulation, as presented by Vasudevan et al., and Appelqvist and Lehtonen [10, 11]. The basic idea is to combine the strengths of automatic data analysis and the simulation results with the visual perception and analysis capabilities of the human user, i.e. the person responsible for making the final decisions. The use of simulation with an easy-to-use graphical user interface provides the tools and methods for manufacturing scenario evaluation, scheduling optimization, and production planning [12]. These can even be used by people with little experience in simulations.
Andriansyah et al. [13], Azadeh et al. [14], Azadeh et al. [15], Canonaco et al. [16] used simulation to validate and assess the quality of optimal solutions generated by their new modeling for Open zero-buffer multi-server general queuing networks applicable in process industry. As mentioned previously, simulation / optimization have been considered by several authors for the type of application dealt within this paper. The method that we propose differs from others in the way it uses these techniques. Instead of dealing with an approximated mathematical model of the system, we solve the actual system. Cheung et al. [17] propose an
intelligent DSS for service network planning, considering both an optimization and a simulation model following a two-stage methodology. The intelligent DSS integrates a DSS with an expert system, to offer guidance to the decision maker throughout the planning process [18].
Increasing in the number, variety, and complexity of system simulation have caused different types of simulation languages to develop. Some of the simulation languages are GPSS, SIMSCRIPT, SIMAN, GASP, DYNAMO, SIMULA, SLAM, WITHNESS, SIMFACTORY.
One of the most widely used simulation language is General Purpose Simulation System (GPSS). GPSS/H is a version of GPSS which takes a form of series of statements and used for manufacturing systems, health care systems, transportation systems, communication networks, defense systems, civil systems and queuing (waiting line) systems in general and for discrete event simulation. In GPSS/H, the active Transaction (“Xact”) can execute a YIELD Block to shift from the Active State to the Ready State and restart the CEC scan. Higher-priority (and higher-ranked same priority) Xacts on the CEC can then try to become active, one by one, before the control yielding Xact itself again becomes active at the same simulated time. (A “PRIORITY PR, YIELD” Block can alternatively be used in order to reposition the just-active Xact behind equal-priority Xacts on the CEC prior to restarting the scan). In GPSS/H, using a high-priority controller Transaction at a refusal-mode TEST Block, the controller waits at the front of the CEC. The Facility RELEASE will trigger a CEC scan restart and the controller will do its job. GPSS/H contains block statements corresponding to the blocks which are then prepared and supplemented with additional type of statements called control statements, and perhaps with other type of statements known as compiler directives. These additional statements provide supporting information about the model and describe the plan for its experimental design. The result of simulating with such a model are provided as information which describes the current state of the problem. GPSS/H models can be supplemented to extract pictorial representation from them and provide visual insides both for the modelers of the system and the modeler’s clients and to serve as a
communication medium between the modelers and clients through the use of computer graphics and animation.
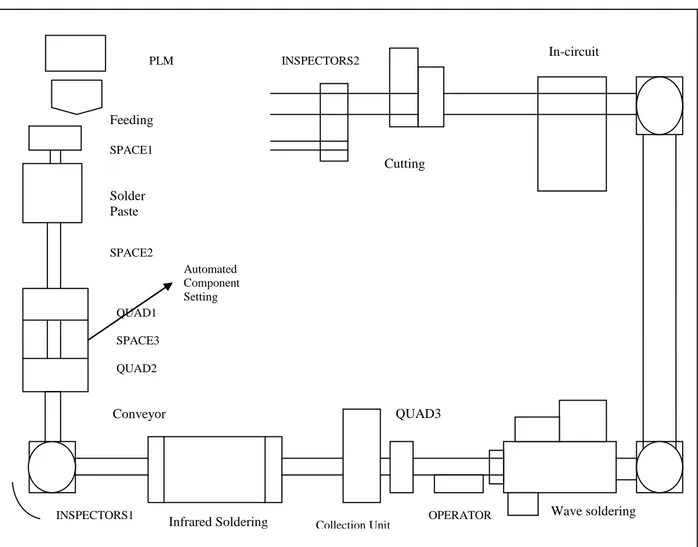
3. World Line Card Production System The firm started to produce WLC by establishing full automation assembly line in 2010. The production line consists of 11 machines, and conveyors and is supervised by a computer system with a total of ten workers. The production of WLC starts with the preparation step, and goes on with the solder paste, automatic setting, infrared soldering, setting of the components passing through holes, wave soldering, in-circuit test, card cutting, and passed/failed card seperation (see Figure 1).
The company’s production line has changed several times due to some maintanance problems, newly developed technologies and emerging defective rate increases. The purpose of the company is to determine a new design for this production line, which can achieve the desired production level under some constraints defined in section 3.2. A simulation model is built for the series of stations using discrete-event simulation to achieve our objective.
3.1. Analaysis of the world line card production steps and automation network
Each step of production is detailed with their capabilities in follow;
3.1.1. Preparation
The product code and date are put on the Printed Circuit Boards (PCB) by using the silk-screening method. Moreover, barcode which has two series numbers is put on PCB to follow the product on the line. The prepared PCB are set in the feeding unit.
3.1.2. Soldering process
The solder paste machine frees the solder on certain points. Then PCB pass to the next step through conveyor. Whether the solder paste is on its place is controlled taking 10 percent sample by a laser microscope.
3.1.3. Automatic setting process
The components are put on islands by four different setting heads. It is possible to put 85000 surface mounted devices in a day. The machine arranges itself automatically according to the size of surface mounted device.
Figure 1. Layout of the production line
3.1.4. Infrared soldering
After 100% inspection, PCB go into the infrared soldering machine. The components are physically and electrical soldered before melting the solder paste and then cooling. The cards leaving the oven are collected in the collection unit.
3.1.5. Setting of the components passing through holes
The components are assembled by full automatic setting machine. It has two different setting heads and can put approximately 12000 components. The completed card is sent to the conveyor and a new card is taken from the collection unit automatically.
3.1.6. Wave soldering
The cards go into the wave soldering machine to provide for the connection between the components and the cards. After this operation, the cards are brought to the normal temparature
by means of fans. Different working conditions are programmed to the machine according to the size and components of the cards.
3.1.7. In-circuit test
The first test point at automatic WLC production line is in-circuit test. The test period for a card at in-circuit test device controlled by a personal computer is approximately 3 seconds (11 seconds for four cards). Control test is done for the components of WLC which are missing or assembled in wrong places. The production mistakes like short circuit and open circuit are also inspected in this process. The cards are sent to the entering conveyor of board flo-test handler automatic. The series numbers are read by the barcode reader and put on the test fixture by automatic card setter to test.
After the test, whether the cards have passed or failed and the test results which arise due to the mistakes of the failed cards are sent to the data collection system and evaluated.
INSPECTORS2
Cutting
In-circuit test
INSPECTORS1 OPERATOR Wave soldering
QUAD3
Infrared Soldering Collection Unit Feeding SPACE1 Solder Paste SPACE2 2 Conveyor QUAD1 SPACE3 QUAD2 Automated Component Setting PLM
GO ADVANCE 0.138, 0.06 ADVANCE 0.125, 0.125 SEIZE QUAD2 LEAVE SPACE3 ADVANCE 0.825, 0.175 RELEASE QUAD2 ADVANCE 0.714, 0.384 QUEUE QINS1 SEIZE INS1 DEPART QINS1 ADVANCE 0.12, 0.04 RELEASE ADVANCE 0.13, 0.02 INS1 ADVANCE 0.23, 0.02 ENTER BUFFER SEIZE QUAD3 LEAVE BUFFER ADVANCE 1.125, 0.275 RELEASE QUAD3 ADVANCE 0.2, 0.14 ADVANCE 0.228, 0.103 ENTER QSYSTEM QUEUE INS3 SEIZE PLM ADVANCE 0.123, 0.123 LEAVE SPACE1 ADVANCE 0.603, 0.018 ENTER SPACE2 RELEASE PLM ADVANCE 0.024, 0.132 ENTER
Q
U
A
D
LEAVE SPACE2 ADVANCE 0.133, 0.133 ENTER SPACE3 LEAVE QUAD1 RELEASE OVEN SEIZE ADVANCE 3.825, 0.005 0.353, 0.035 GENERATE QUEUE ENTER QSYSTEM SPACE 1 LEAVE INS3 TERMINATE ALT OVEN3.1.8. Card cutting
The knife working with the guillotine system divides the cards into four section and the machine sends the seperated cards to the barcode reader by the conveyor.
3.1.9. Passed/failed cards seperation
After the series numbers are read, the cards are sent to the cross unit. Here, whether the cards pass the test is asked from QNX database. If the card is appropriate, it goes to the conveyor; otherwise it is sent to the other conveyor to be repaired. Two inspectors control the cards.
3.2. Simulation of existing system
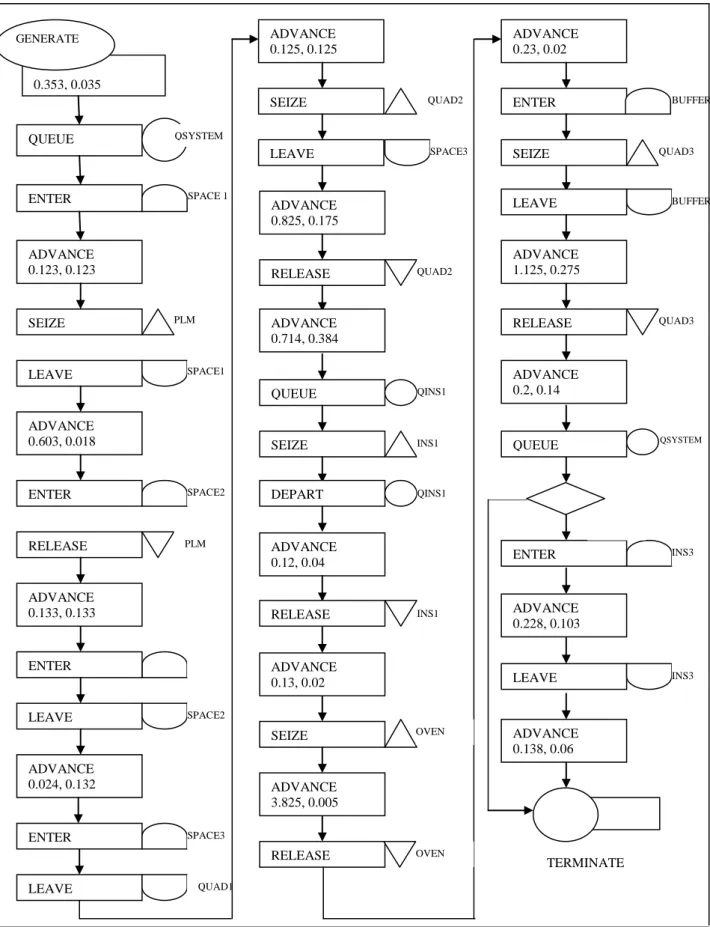
The real data had been collected before the program was written. The program was run until the every situation results extrapolated. But the number of panels produced, the utilization of the machines, the workers and the queues are not known. Because comparing the utilization of the machines and the workers are unbalanced, ones that could be seen in the system can be arranged depending on each other. The management constraints are the total budget constraint, indicating that the total annual investment for the new configuration was already done and no more machine could not be added for new layout and another limitation that no more than a total worker of 14 workers can work in the production line. In addition to managerial constraints, capacity constraints are given in Table 1. Service and transportation time distributions are listed in Table 2 (see also Figure 2).
While some machines keep on working, some others wait for sequence. The production line releases 30 world line cards average in a day with the current manufacturing resources.
Table 1. Capacity constraints
Layout Number
Capacity of Buffer (BUFFER) 20
Capacity of SPACE1 2
Capacity of SPACE2 3
Capacity of SPACE3 3
Capacity of QUAD1 4
Storage (INS2) 2 inspectors
To measure the average sytem performance such as station utilisation, cycle time, and output rate we defined the simulation length to be 60 minutes, which is actually the number of minutes per hour available for production.
Table 2. Time distribution
Process Time
Process time of PLM (3, 0.603, 0.018) Process time of QUAD1 (2, 0.624, 0.192) Machining time of QUAD2 (2, 0.825, 0.175) Inspection time QINS1 (1, 0.12, 0.004) Process time of Oven (3,825, 0.005) Conveyor time (0.23, 0.002) Process time of QUAD3 (1.125, 0.275) Service time of OPERATOR (1.240, 0.235)
Cutting time (0.51, 0.18)
Last inspection time (0.228, 0.108)
3.3. Results of the existing system simulation
The results of the experimentation are analysed by ANOVA procedures. Next we validate the ANOVA assumptions of normality, constant variance and independency among the error components by observing the standardized residual plots obtained using MINITAB. The following main effects and interactions were found to contribute to equation in Table 3. The simulation model of the production system was used to obtain response variables for different scenarios considering x1, x2, and x3 are assigned to number of Operator, number of Quad2, and number of Quad3, respectively. Coefficients and their standard deviations are shown in the third and fourth columns, respectively. The last two columns display the t-ratios and p-values. Model was also found to be significant (p = 0.000).
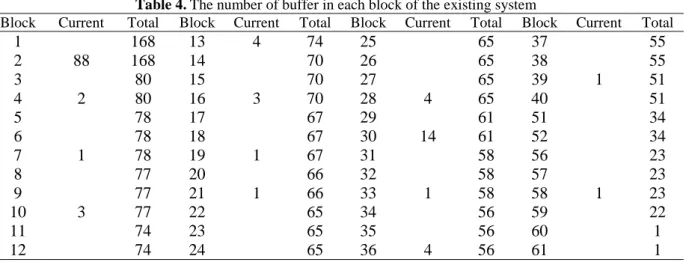
Each block represents work phase in WLC production, current column and total column represents work unit in each block in Table 4. The simulation extended a hundered times and 60 minutes the results are as follows; average number of panels produced: 33.28 with the standard deviation of 0.709 and average number of nondefective panels: 25.90 with a standard deviation of 2.31.
A part of block diagram of the production line is shown below in Figure 2 which represents each step in simulation according to layout of the production line.
Table 3. Analysis of the model
Source DF Seq SS Adj SS Adj MS F p
Main 3 16232327 16232327 18625340 2.90E+03 0.000 2-way 8 16354 163547 16355 2.18 0.001 3-way 8 15923 159238 15924 1.99 0.018 Residual eror 96 44312 44312 3846 Pure eror 96 44312 44312 3856 Total 121 17389475 17389475
Table 4.The number of buffer in each block of the existing system
Block Current Total Block Current Total Block Current Total Block Current Total
1 168 13 4 74 25 65 37 55 2 88 168 14 70 26 65 38 55 3 80 15 70 27 65 39 1 51 4 2 80 16 3 70 28 4 65 40 51 5 78 17 67 29 61 51 34 6 78 18 67 30 14 61 52 34 7 1 78 19 1 67 31 58 56 23 8 77 20 66 32 58 57 23 9 77 21 1 66 33 1 58 58 1 23 10 3 77 22 65 34 56 59 22 11 74 23 65 35 56 60 1 12 74 24 65 36 4 56 61 1
The result indicates that PLM, QUAD2, QUAD3, OPERATOR, QUAD1, SPACE1, SPACE2, and SPACE3 have high utilization. QUAD1, QUAD2, QUAD3 and, PLM work more slowly when compared to the other machines. That could be seen from the spaces which have always a busy load in front of them. The reason why there are average 14 actions waiting in the BUFFER shown in the outputs that QUAD3 has longer processing time. In existing system has a buffer capacity of 20 pieces in front of QUAD3. In addition, the OPERATOR after QUAD3 has the longest processing time which causes the operation time increase. However, INS1, INS2, INCRT and, CUTTING machines have lower utilization, they are able to work faster also they could be in idle from time to time.
4. Proposes for Alternative Scenarios
To optimize and check the optimality of production line we presented three different proposal.
4.1. First scenario
To reduce the buffer in Block 30 which is given in Table 4 with an avarage of 14 waiting units; we simulated to double number of QUAD3 and the OPERATOR who is the successor of the
OPERATOR.
We built up a new simulation code for new conditions. By doubling QUAD3 and the OPERATOR we found such results: average number of total panels produced 50 with a standard deviation 2.24 and average number of nondefective panels 39 with a standard deviation 3.67. Analyzing the outputs of this model indicated that there were no panel waiting in front of QUAD3 and the utilization of BUFFER was zero.
4.2. Second scenario
Another analysis was about reduction of three spaces which are SPACE1, SPACE2, and SPACE3. To analyse production line, the processing times of machines that are successors of the three spaces were reduced. Although results have indicated that acceleration of processing times of machines was an ideal solution, machines have fixed processing times and could not set for desired time. As an alternative to increasing speed of machines was to add new three machines. However, the high cost of investment of those machines made the firm gave up buying new machines.
Instead of buying new machines, the firm would concentrate on the component bands. If
the component bands are prepared before the previous machine finishes, that could save time and provide a higher utilization.
4.3. Third scenario
The processing time of each operation on each machine is assumed to be deterministic which has been adopted from [19]. When the spaces can not be eliminated from the system, our analyses focused on increasing the capacity of each space one by one with all combinations.
All alternative simulations indicated close results of the existing system model. The reason that can be the facility layout design constraint and the number of machines. Thus, there were no requirement to increase capacities of spaces.
4.4. Results of scenarios
According to three proposals, we got best improvement from the first benchmark. The differences between production of panels are 17 and non-defective panels production are 14. When we consider other proposals there has been no improvement for WLC production line. Thus, first proposal comes first with outputs.
4.5. Sensitivity and validation of the outputs
When the optimum solution is known, a sensitivity analysis can be conducted by changing the values of the decision variables from their optimal level to see which decision variable has most effect which have been applied in this study. The inputs of the model consist of the system definition and the data collected from the real system, which are used to construct the simulation model. The output of the simulation model obtained through a design of experiments is further used as an input. The DSS proposed in this paper was developed through the use of the simulation model. Sensitivity analysis is conducted on the solution found by the optimization module in order to consider alternative neighbour configurations. Thus, in this paper, we propose a DSS which allows the decision makers to determine a near-optimal configuration of the decision variables by considering different scenarios (such as different number of hot press machines and number of workers in each station) that satisfy problem constraints.
The validation was done by simulating the current system first, and then comparing the simulation results in the data obtained from the
actual system The simulation model is validated by using the data gathering from existing production lines in the production line. The model is used to obtain the number of world card produced hourly and to determine the factors affecting this throughput. Based on the simulation and physical and economical conditions of the system, factors (the number of workers in the quality control workstation, the number of workstation) and allowable factor levels are determined. The simulation model is used to find the optimum levels of considered factors to ensure well-designed physical system. In other words, simulation model and optimization stage integration are used both to analyze the performance of the current production line to reveal the bottlenecks at some stages and determine the optimum working conditions, respectively, with reduced cost, time and effort.
To show the effects of difference between the simulation outputs, three former benchmark cases and statistical analysis are conducted. The computational results indicate that the difference between the simulation is significant and the proposed system outperforms existing methods. The proposed method is also efficient in terms of the computation time which is highly important for the real-time control of a manufacturing system.
5. Conclusion
To analyse the performance of the current production system and determine the optimum working conditions, we applied simulation optimization. As a discrete event simulation we used GPSS/H program to identify each process that influences the plant production.
The proposed system constitutes the framework of an adaptive controller supporting the co-ordination and co-operation relations by integrating a real-time simulator and a decision support system for implementing dynamic strategies. The proposed system concentrates on the control of stochastic manufacturing system which has machine flexibility characteristics for performing operations of different parts.
The model provides an applicable and efficient framework for real-time control of the production in flexible manufacturing system under stochastic circumstances. The experiments show that the proposed approach leads to better performance of the system with increased
production amount while satisfying all the constraints. As a result, the proposed method is suitable for controlling production line with a number of machines, parts and operations. Future researches may concentrate on applying other types of flexibility in shop floors using a simulation-based controller.
Acknowledgements
The authors would like to thank the referees for their valuable suggestions which helped to improve the paper.
References
[1] Varadharajan, T. K., Rajendran, C., A multi-objective simulated-annealing algorithm for scheduling in flowshops to minimize the makespan and total flow time of jobs,
European Journal of Operational Research
167 772–795(2005).
[2] Edis, R. S., Ornek A., Simulation analysis of lot streaming in job shops with transportation queue disciplines, Simulation
Modelling Practice and Theory, 17 442–453
(2009).
[3] Mahdavi I., Shirazi B., and Solimanpur M., Development of a simulation-based decision support system for controlling stochastic flexible job shop manufacturing systems.
Simulation Modelling Practice and Theory,
18 768–786 (2010).
[4] Justin, B., Royce, O., Fred, G., Future of simulation optimization. In: Proceedings of
the Winter Simulation Conference, Atlanta,
1466–1469 (2001).
[5] Appelqvist, P., and Lehtonen, J–M.. Combining optimisation and simulation for steel production scheduling. Journal of
Manufacturing Technology Management, 16
(2) 197-210 (2005).
[6] Thompson, M. B., The Marriage between Simulation & Real-time Control. APICS -
The performance advantage, 8 43-46 (1993).
[7] Yoon, H. J., and Shen, W., Simulation-based real-time decision making for manufacturing automation systems: a review. International
Journal of Manufacturing Technology and Management, 8 (1) 188–202 (2006).
[8] Kadar, B., Pfeiffer, A., and Monostori, L., Discrete event simulation for supporting production planning and scheduling decisions in digital factories. Proceedings of
the 37th CIRP International Seminar on Manufacturing Systems; Digital enterprises,
production networks, Budapest, Hungary, 444-448 (2004).
[9] Hindle, K., and Duffin, M., Simul8-planner for Composites Manufacturing. Proceedings
of the Winter Simulation Conference,
(2006).
[10] Vasudevan, K. K., Lote, R., Williams, E. J. and Ulgen, O., Iterative Use Of Simulation And Scheduling Methodologies To Improve Productivity. Proceedings of the 2008
Winter Simulation Conference, (2008).
[11] Appelqvist, P. and Lehtonen, J–M., Combining optimisation and simulation for steel production scheduling. Journal of
Manufacturing Technology Management, 16
(2) 197-210 (2005).
[12] Anglani, A., Grieco, A., Pacella, M., Tolio T., Object-oriented modelling and simulation of flexible manufacturing systems: a rule-based procedure, Simulation
Modelling Practice and Theory, 10 209–234
(2002).
[13] Andriansyah, R., Van Woensel T., Cruz, F.R.B., and Duczmal, L. Performance optimization of open zero-buffer multi-server queueing networks, Computers &
Operations Research, 37 (8) 1472–1487
(2010).
[14] Azadeh, A., Haghnevis, M., and Khodadadegan, Y. An improved model for production systems with mixed queuing priorities: an integrated simulation, AHP and value-engineering approach, International
Journal of Industrial and Systems
Engineering, 4 (5) 536–553 (2009).
[15] Azadeh, A., Mohammadebrahim, R., Eivazy, H., Parameter optimization of tandem queue systems with finite intermediate buffers via fuzzy simulation,
Performance Evaluation, 67 353–36 (2010).
[16] Canonaco P., Legato, P., Mazza, R.H. Musmanno, R., A queuing network model for the management of berth crane
operations, Computers & Operations Research, 35 2432–2446 (2008).
[17] Cheung, W., Leung, L.C., and Tam, P.C.F., An intelligent decision support system for service network planning, Decision Support Systems, 39 415–428 (2005).
[18] Dengiz, B., Bektas, T., and Ultanir, A. E. Simulation optimization based DSS application: A diamond tool production line in industry, Simulation Modelling Practice and Theory 14 296–312 (2006).
[19] Xing, L. N., Chen, Y. W., Yang, K. W. Multi-objective flexible job shop schedule: design and evaluation by simulation modeling, Applied Soft Computing, 9 362– 376 (2009).
Dr. Sinan APAK is currently working as an Asst. Prof. at Industrial Engineering Department in Istanbul Arel University, Istanbul, Turkey. He received his B.Sc. degree in Mechanical Engineering from Balıkesir University, M.Sc. degree in Systems Engineering from Yeditepe
University and Ph.D. in Engineering
Management from Marmara University in 2010.
His research interests are production
management, multi criteria decision making and fuzzy logic.
Prof. Dr. Sami ERCAN, B.Sc. in Industrial Management from M.E.T.U., Ankara in 1961. MBA degree from Cornell University, 1964; M.Sc. and Ph.D. in Industrial Engineering from I.I.T., Chicago. He is currently a Prof. Dr. at Istanbul Arel University in Industrial Engineering Department. He has over a hundred national and international publications. Dr. Ercan also has supervised over a hundred disertations and thesis. He has served as chairman of Industrial Engineering in Marmara University. He has been vice-president, dean of faculties in Cyprus International American University. His research interest includes decision making, quality improvement methods and techniques. One of his book is about Applied Basic Statistics and he is currently writing Quality Improvement Technics.