ASYMMETRIC BEHAVIOR OF EXCHANGE RATE PASS
THROUGH IN TURKEY
A Master’s Thesis by BAHAR ŞEN Department of Economics Bilkent University Ankara September 2009ASYMMETRIC BEHAVIOR OF EXCHANGE RATE PASS THROUGH IN TURKEY
The Institute of Economics and Social Sciences of
Bilkent University
by
BAHAR ġEN
In Partial Fulfillment of the Requirements for the Degree of MASTER OF ARTS in THE DEPARTMENT OF ECONOMICS BĠLKENT UNIVERSITY ANKARA September 2009
I certify that I have read this thesis and have found that it is fully adequate, in scope and in quality, as a thesis for the degree of Master of Arts in Economics.
--- Asst. Prof. Ümit Özlale Supervisor
I certify that I have read this thesis and have found that it is fully adequate, in scope and in quality, as a thesis for the degree of Master of Arts in Economics.
--- Prof. Erinç Yeldan
Examining Committee Member
I certify that I have read this thesis and have found that it is fully adequate, in scope and in quality, as a thesis for the degree of Master of Arts in Economics.
--- Asst. Prof. Levent Özbek Examining Committee Member
Approval of the Institute of Economics and Social Sciences
--- Prof. Erdal Erel Director
iii
ABSTRACT
ASYMMETRIC BEHAVIOR OF EXCHANGE RATE PASS
THROUGH IN TURKEY
ġEN, Bahar
M.A., Department of Economics
Supervisor: Asst. Prof. Ümit Özlale
September 2009
This thesis investigates the presence of asymmetry in pass through from exchange rates to manufacturing industry prices in Turkey. In the analysis, to detect a possible nonlinear response of prices, threshold regression models are employed. The results indicate that reactions of prices to exchange rate movements differ depending on the aggregate demand conditions. In particular, when the economy is booming, exchange rate changes are transmitted into prices in a larger extent. On the other hand, during slowdowns, fluctuations of exchange rates are not reflected on prices and past inflation has more important role in determining prices.
iv
ÖZET
TÜRKĠYE‟ DE KUR GEÇĠġKENLĠĞĠNĠN ASĠMETRĠK DAVRANIġI
ġEN, BAHAR
Yüksek Lisans, Ġktisat Bölümü
Tez Yöneticisi: Doç. Dr. Ümit Özlale
Ağustos 2009
Bu tez Türkiye‟de kurdan imalat sanayi fiyatlarına geçiĢte asimetrinin varlığını incelemektedir. Analizde, fiyatların doğrusal olmayan tepkisini belirleyebilmek için, eĢikdeğer regresyon modeli kullanılmıĢtır. Sonuçlar fiyatların kur hareketlerine olan tepkisinin toplam talep koĢullarına göre farklılaĢtığına iĢaret etmektedir. Özellikle, ekonomi büyürken kur değiĢimleri fiyatları daha büyük bir oranda etkilemektedir. Diğer yandan daralma sürecinde, kur hareketleri fiyatlara yansıtılmamaktadır ve geçmiĢ enflasyon fiyatları belirlemekte daha önemli bir role sahiptir.
v
ACKNOWLEDGMENTS
I am grateful to Asst. Prof. Ümit Özlale for his supervision and guidance through the development of this thesis.
vi TABLE OF CONTENTS ABSTRACT ... iii ÖZET ... iv ACKNOWLEDGEMENTS ... v TABLE OF CONTENTS ... vi
LIST OF TABLES ... vii
LIST OF FIGURES ... viii
CHAPTER 1. INTRODUCTION ... ... 1
CHAPTER 2. LITERATURE REVIEW ... 7
2.1. Determinants of Pass Through ... 7
2.2. Literature Review about Asymmetry in Pass Through ... 10
2.3. Pass through Literature on Turkey ... 13
2.4.Brief History of Exchange Rate and Inflation Dynamics of Turkey: 15 CHAPTER 3. THRESHOLD REGRESSION MODEL 17
CHAPTER 4. THE MODEL ... 22
4.1. Model Specification ... 22
4.2. The Data ... 28
4.3. Unit Root Test Results ... 29
CHAPTER 5. ESTIMATION RESULTS ... 31
CHAPTER 6. CONCLUSION ... 41
SELECT BIBLIOGRAPHY ... 43
vii
LIST OF TABLES
1. Table 4.3.1. Unit Root Test Results...30 2. Table 4.3.2. Descriptive Statistics...30 3. Table 5.1: The Test Results for Existence of Threshold for The First Model .... ..31 4. Table 5.2: Threshold Regression Estimates for the First Model ...34 5. Table 5.3: The Test Results for Existence of Threshold for The Second Model ...35 6. Table 5.4: Threshold Regression Estimates for the Second Model ...38
viii
LIST OF FIGURES
1. Figure 5.1: Likelihood Ratio Statistics as a Function of Threshold Variable... 32 2. Figure 5.2: 95 % Confidence Interval For the Threshold Variable... 33 3. Figure 5.3: Likelihood Ratio Statistics as a Function of Threshold Variable.... 36 4. Figure 5.4: 95 % Confidence Interval For the Threshold Variable……… 37 5. Figure 5.5: Output Gap, Inflation and Exchange Rate Movements for Turkey.. 40
1
CHAPTER 1
INTRODUCTION
Exchange rate pass through measures to what extent import prices or in general domestic prices are sensitive to exchange rate movements. In that sense, information about the degree of pass through is crucial for the determination of optimal monetary policy and for the success of inflation forecasting both for developed and developing countries. However, the design of monetary policy in small open emerging countries confronts different challenges from that in developed countries. To be explicit, the structural characteristics of transition economies such as asset and liability dollarization, fiscal imbalances, lack of financial deepening make them more vulnerable to external shocks. Hence, fluctuations in exchange rates in emerging countries may be more costly compared to those in developed ones. In addition, investment is financed mainly through external borrowings in most of the emerging market economies including Turkey. Thus, it is not surprising to observe that periods of real appreciations and depreciations resulting from capital flows overlap with expansions and recessions. That is, during capital flow periods, fluctuations in exchange rates play a fundamental role in shaping output and inflation
2
dynamics. Accordingly, in such an environment, policymakers cannot rule out the importance of exchange rate changes for conduct of monetary policy and for proper assessment of monetary policy transmission mechanism.
Apart from the existing chronical problems of emerging market economies such as immense dollarization, financial fragility and dependence on external financing, another characteristic of emerging markets is the degree to which their price levels are sensitive to fluctuations in exchange rates. The exchange rate shocks are transmitted into aggregate inflation at a much faster rate in emerging economies than are in industrial ones (Calvo and Reinhart, 2002; Choudhri and Hakura, 2005; Devereux and Yetman, 2003). This is because in the production process, emerging markets are highly dependent on imported intermediate goods and, therefore, effects of exchange rate changes on domestic prices can be seen directly and quickly. Furthermore, when domestic currency depreciates, large proportion of traded goods in consumption basket leads to a rise in prices of imported goods in terms of domestic currency, thereby consumer prices. In addition to these two reasons, which are dependency on imported intermediate goods in production process and high-weight of traded goods in consumption basket, low pricing to market may be another explanation for high pass through in emerging economies. To clarify, pricing to market demonstrates to what extent foreign exporters adjust their prices depending on the level of competitiveness and the price stickiness of the importing country. If the level of competitiveness is low and prices are not rigid for the importing country, foreign exporters do not need to align their prices much to the domestic prices of the importing country, i.e. pricing to market is low. This implies that foreign exporters can mostly reflect any impact of exchange rate changes and foreign price
3
developments on domestic prices of the importing country rather than adjusting their mark-up. Thus, pass through turns out to be higher.
Further, in the context of foreign trade policy, the information about the size of pass through allows understanding the expenditure switching effect stemming from exchange rate changes (An, 2006). In particular, depending on the extent of pass-through, movements in exchange rate may lead to a shift (or not) in the composition of expenditures on foreign and domestic goods by altering relative price of home and foreign goods. As a result, pass through may have an additional impact on trade balance and output dynamics, as well.
To summarize, when we have a small open emerging market economy, due to its structural characteristics, there is susceptibility to external shocks. The extent of pass through is likely to have important implications for the monetary policy to be conducted to absorb external shocks, and how important exchange rate adjustment is in this policy framework. In a low pass through environment, for example, upward pressure on consumer prices, effect on net exports and, hence, on real output stemming from depreciation of exchange rates becomes smaller. That is why monetary authorities may pursue more flexible monetary policy in low pass through regimes (Fraga, Goldfajn and Minella, 2003; Choudhri and Hakura, 2006). Consequently, understanding the degree and timing of aggregate exchange rate pass-through as well as its determinants is essential, especially for small open economies like Turkey.
Although there is a vast literature on the pass through, the nonlinearity in response of prices to exchange rate movements is analyzed only in a few studies (Marazzi et al, 2005). The meaning of nonlinear response is that the reaction of prices to movements in exchange rates may change with respect to the size and
4
direction of exchange rate shocks, demand conditions or inflationary environment. More precisely, with nonlinear transmission assumption, it is supposed that prices react differently to large or small changes in exchange rates and to appreciation and depreciation of domestic currency. In addition, the response of prices may change depending on whether the economy is in boom or recession periods as well as in high or low inflationary regimes. Understanding how prices respond to exchange rates is of key importance to the conduct of monetary policy in the sense that the correct level of nominal interest rate determined by policy makers in the inflation targeting regime will differ depending on the presence of asymmetry between exchange rates and prices (Schaling, 1999). In particular, if pass through behaves asymmetrically along the business cycle, pass through will be smaller during slowdown. In that case, upward pressure of depreciations on inflation will be lower compared to expansions. As a result, for monetary authorities with the objective of price stability, optimal interest rate to control inflationary pressures will also be lower. Therefore, with linear response assumption, policymakers may overestimate the correct level of policy rate when the economic activity is low.
Based on the above arguments, this study investigates a likely presence of asymmetry in response of manufacturing industry prices to external price developments, namely import prices and exchange rate fluctuations along the business cycle for Turkey. There are also two studies concerning asymmetry in pass through for Turkey. First one, by Kara et al. (2007), determines the threshold level exogenously and split the sample depending on the exogenous threshold value. However, the results are likely to be sensitive to this value and inferences are not accurate when the threshold value is set exogenously (Hansen, 2000). Another study regarding asymmetry belongs to Arbatlı (2003). Employing a threshold vector
5
autoregression model (TVAR), she tries to capture nonlinear response of prices to exchange rate changes. However, there may be some problems with this study regarding both the method used in the estimation and the sample period. To explain, the method does not take into account the identification of threshold variables and uses standard test statistics. However, under the null hypothesis of linear model, threshold variables become unidentified, thereby standard statistical test is no longer valid (Hansen, 1996, 2000). Moreover, the period covered in the paper is not homogenous in terms of monetary policy. Namely, it includes both the managed or crawling exchange rate regime and inflation targeting with flexible exchange rate regime. Therefore, the empirical findings may not reflect the recent pass through behavior accurately. In light of these evidences, our study contributes to the literature on emerging market economy by analyzing asymmetry in pass through with a well-defined method and homogenous sample period where there are no major structural changes.
The analysis is based on a single equation framework under two different specifications. First specification examines simple relationship between exchange rate changes and prices. Apart from the first specification, the second one also takes into account foreign price developments by incorporating import prices into the model.
The methodology employed to detect the threshold type of nonlinearity in pass through is based on the threshold regression model developed by Hansen (2000). The model considers different regimes and allows different dynamic behaviors for the variables conditional on the regime. Besides, rather than imposing threshold value exogenously, the critical values for the threshold are determined by endogenous search technique outlined by Hansen (2000).
6
The results indicate that pass through from exchange rate to manufacturing industry prices is higher when the output gap exceeds a certain threshold value. The threshold levels under both specifications are almost the same, which points out the robustness of the results. In addition, we find that the switching point is negative. Thus, pass through is not asymmetric around potential output, but at a negative output gap. Our findings are in line with previous findings (Goldfajn and Werlang, 2000; Correa and Minella, 2006).
The rest of the paper is organized as follows. Chapter 2 examines the determinants of pass through and provides comprehensive literature review related to nonlinearity in pass through. In addition, it presents pass through literature on Turkey and brief overview of Turkish economy. Chapter 3 describes the estimation methodology. In chapter 4, the empirical model is introduced along with the data set and the necessary statistical tests. In chapter 5, the threshold regression model is estimated and the results are reported. Chapter 6 presents the concluding remarks.
7
CHAPTER 2
LITERATURE REVIEW
This chapter provides information about the dynamics of exchange rates in section 2.1. Section 2.2 presents the literature review concerning the asymmetry in transmission from exchange rate to prices. In section 2.3, the literature on pass through for Turkey is summarized. Finally, in section 2.4, a brief overview of Turkish economy is presented.
2.1 Determinants of Pass Through
The existing literature about exchange rate pass through tries to answer two interrelated questions about exchange rate pass through. First question is why pass through is not complete and the second one is what factors determine the pass through.
Factors underlying partial response of import or consumer prices to movements in exchange rates have been evaluated by both theoretical and empirical studies.
8
From a theoretical point of view, imperfect competition, role of market organization, product segmentation and pricing to market are among the factors that explain incompleteness of pass through (Dornbusch, 1987; Krugman, 1987). According to the pricing to market theory, firms aim at maintaining their market share and prefer adjusting their mark-up rather than reflecting the exchange rate changes completely on prices (Goldberg and Knetter, 1997). To what extent firms absorb movements in exchange rates by altering their mark-up depends on the degree of product substitutability and product heterogeneity as well as the market share of importing and exporting firms.
Further explanation of theoretical framework is pricing strategy of firms. If a firm chooses producer currency pricing (PCP), then the changes in exchange rate will be reflected entirely to home-country price of the foreign goods, hence pass through is complete. In case of local currency pricing (LCP), there is no pass through in short run prices. Therefore, aggregate pass through will be incomplete in the economy characterized by a combination of firms, which follow LCP and PCP (Betts and Devereux, 1996; Devereux and Engel, 2002).
Another prominent view of theoretical studies is that the decline in pass through can be attributed to low inflationary environment because stable prices lead to a decrease in pricing power of firms (Taylor, 2000). Depending on how persistent the increase in cost or prices is expected to be, low inflation and proper monetary policy may lead to decline in pass through. In particular, if exchange rate shocks are not persistent, pass through of these shocks will be lower in low-inflation environment.
Considering the empirical studies about pass through, majority of them have focused on identification of the leading determinants of transmission from exchange
9
rate to domestic or import prices by estimating elasticity of pass through via different methodological approaches (Ca‟zorzi et al., 2005; An, 2006; Choudri and Hakura, 2001).
One possible factor determining the extent of pass through is inflationary environment. As mentioned above, Taylor (2000) brings in monetary policy perspective to pass through literature and argue that higher rate of inflation leads to higher pass through because any increase in cost of production will be considered as persistent in high inflation regime. His hypothesis has been tested for many countries by Devereux and Yetman (2003), Bailliu and Fujii (2004), Ca‟Zorzi et al. (2005), Choudri and Hakura (2001) and Gagnon and Irig (2001). The empirical findings in these papers are in line with Taylor‟s hypothesis.
On the other hand, Campa and Goldberg (2005) reach the conclusion that contrary to the Taylor argument, composition of import bundle is by far a more important factor in affecting pass through for OECD countries. Larger proportion of manufactured goods and smaller proportion of primary goods like raw materials and energy products in composition of imports lead to decline in pass through because pass through to energy and raw material goods is higher in comparison with manufactured products.
Degree of openness is another potential explanation to degree of pass through. In a more open economy, the ratio of imports to domestic income will be higher, thereby, pass through (Goldfajn and Werlang, 2000; Kang and Wang 2003). Moreover, larger share of imports in consumption baskets and larger proportion of imported intermediate goods in production process will lead to higher pass through due to increasing upward pressure on domestic prices through inflation of imported goods (McCarthy, 2000; Bacchetta and Wincoop, 2003).
10
Furthermore, tariffs are another determinant of pass through with a negative impact (Frankel et al., 2005). In particular, a firm reflects a much lower percentage of the depreciation on prices at the higher tariffs to maintain its market share and, that is why tariffs cause a reduction in pass through.
2.2 Literature review about asymmetry in pass through
Even if there is a broad literature on pass through, the literature concerning the asymmetry in pass through is investigated less frequently. Most of the studies working on the subject of asymmetric pass through focus on nonlinearity associated with appreciations and depreciations and with the size of exchange rate changes. The reasoning behind assessing the extent of fluctuations in exchange rate as a source of asymmetry is that small changes in exchange rate may be absorbed in prices in presence of a menu cost in price adjustment. Only if the change is above a certain threshold, it may be reflected on prices. Moreover, when the importing country‟s currency appreciates, foreign firms may substitute the input produced in their own country and firms may lower import prices to increase their market share by maintaining their mark-up. The response to appreciation and depreciation, therefore, may be different.
Empirical studies concerning asymmetry in pass through resulting from the size and direction of exchange rate changes obtain different results. Pollard and Coughlin (2004) examine the response of U.S import prices to exchange rate for 29 industries. They test asymmetries in exchange rate pass through with respect to direction and size of a change in exchange rate and find that pass through is positively related to the size of exchange rate, but there is no clear evidence for asymmetry in the direction of exchange rate changes. Herzberg, Kapetanios and
11
Price (2003) analyze nonlinearities for the UK and find no evidence for nonlinearities in the response of import prices to exchange rate changes. Wickremasinghe and Silvapulle (2004) observe the exchange rate pass-through to import prices of Japan manufacturing exhibits different responses with respect to appreciation and depreciation of the exchange rate and the response is larger in case of appreciation. Bussiere (2007) investigates the response of export and import prices of G7 countries to exchange rate movements. He reaches the conclusion that nonlinearities cannot be rejected, especially on the export side, but the direction and magnitude of asymmetries varies across countries. Alvarez et al (2008) find a weak evidence of asymmetric pass-through from appreciations versus depreciations for the aggregate import indexes in Chile. By examining pass through to domestic prices for India, Khundrakpam (2007) finds an asymmetry in pass through resulting from size and direction of exchange rate changes. Posedel and Tica (2007) estimate a threshold autoregressive model (TAR) for Croatia and detect the asymmetry in transmission from exchange rate changes to prices related to magnitude of movements in exchange rate. Only if exchange rate changes exceed a threshold, they affect CPI inflation.
There are also several studies analyzing other sources of nonlinearity in pass through concerning demand conditions, inflationary environment and macroeconomic stability. Considering demand conditions as a source of asymmetry, which can be measured as GDP deviation from an estimated trend or output gap, the response of prices to exchange rate may differ according to whether the economy is in recession or boom period. More specifically, when the economy is in recession, firms may not reflect the increase in costs fully on their prices; hence sizeable depreciations may not always imply sizeable price increases (Goldfajn and Werlang,
12
2000). In case of asymmetry with respect to inflationary environment and macroeconomic stability, the exchange rate shocks tend to feed into aggregate inflation at a much larger rate when the economy is in high inflationary regime or when the economy faces with macroeconomic instability. The reason may be attributed to the fact that in such an environment exchange rate shocks and price changes are perceived to be more persistent and firms reflect larger percentage of exchange rate changes on prices (Ledesma et al, 2007).
There are also other studies questioning the asymmetry in pass through in respect of demand pressures and inflationary environment. Choudhri and Hakura (2001) examine whether low inflationary environment leads to low pass through for 71 countries, consisting of both developing and industrialized countries. Their findings indicate that the effect of monetary shocks is more persistent and exchange rate pass-through is larger in high inflation regimes. Similarly, Devereux and Yetman (2003) reach the conclusion that nonlinear relationship exists between the degree of pass through and inflation rate for 118 countries by using cross-section data. Shintani et al. (2009) test Taylor‟s hypothesis (2000) for import and domestic prices of the U.S. by employing smooth transition autoregressive (STAR) models. Their results point out that pass through is low when inflation is low. Correa and Minella (2006) estimate Phillips curve for Brazil by using threshold autoregressive model (TAR). They find an evidence for asymmetry in exchange rate pass through to CPI inflation with respect to magnitude and volatility of exchange rate movements and demand conditions measured by output gap. Their findings indicate that when the economy exhibits expansion along with exchange rate depreciations and volatility being above certain threshold, pass through is higher. Ledesma and Junior (2008) examine exchange rate pass through to CPI inflation for several emerging and developed
13
countries. Using smooth transition autoregressive models (STAR), they investigate whether pass through is nonlinear with respect to size and direction of exchange rate changes, demand conditions, inflationary environment and a measure of macroeconomic stability. They conclude that nonlinearities are not ignorable, even if reasons for nonlinearities vary across countries. Goldfajn and Werlang (2000) report that cyclical component of the output is a source of asymmetry in pass through to domestic inflation by using a panel of 71 countries. Przystupa and Wrobel (2008) examine whether exchange rate pass through to import and consumer prices of Poland shows asymmetric behavior. Although the response of import prices to exchange rate does not show strong evidence of nonlinearity, CPI responds asymmetrically to output gap, direction and magnitude of the exchange rate changes and to size of the exchange rate volatility, but not to inflation level.
2.3 Pass through literature on Turkey
The number of studies related to pass through for Turkey is limited. With the purpose of evaluating the response of domestic prices to exchange rate movements for Turkey, Leigh and Rossi (2002) estimate a recursive VAR model based on McCarthy‟s (2000) study for the period covering from January 1994 to April 2002. They conclude that the transmission from exchange rate to prices is completed around a year. In addition, they find that impact of exchange rate on wholesale prices is more pronounced than consumer prices.
Kara et al (2007) use a time varying and single equation methodology to understand the dynamics of pass through in Turkey. Their findings indicate that pass through declined after 2001 with the floating exchange rate regime period and the decrease in indexation behavior. Moreover, they examine the asymmetry in pass
14
through depending on the business cycle and direction of exchange rate changes. They find that larger percentage of exchange rate changes are transmitted into the domestic prices when the output is higher than its potential level and domestic currency depreciates.
Like other studies for Turkey, Kara and Öğünç (2008) utilize VAR set-up of McCarthy (1999) and estimate the pass through separately for the two periods, before and after the floating exchange rate regime. Instead of analyzing the pass through from exchange rates to prices, they estimate the impact of import prices denominated in Turkish Lira on domestic prices. By doing so, both the influence of import prices and exchange rate changes are evaluated jointly. Their results reveal that pass through declined with the adoption of floating exchange rate regime.
Ca‟ Zorzi et al (2007) analyze the degree of pass through to prices for 12 emerging countries including Turkey by estimating a VAR model used in McCarthy (2000) and (2003). They find the evidence for the view that pass through is high in emerging countries compared to developed countries. Moreover, their results support Taylor‟s hypothesis (2000), confirming the existence of positive relationship between the degree of pass through and inflation when Turkey and Argentina are excluded from the sample.
There is another study (Arbatlı, 2003), which questions the existence of asymmetries in pass through for Turkey. Arbatlı (2003) estimates threshold VAR model based on McCarthy‟s VAR set-up. She tests whether pass through shows asymmetric behavior with respect to magnitude and direction of exchange rate changes, inflation level and business cycle for the period from 1994:01 to 2004:05. She obtains evidence for the hypothesis that pass through is lower in periods of economic slowdown, low inflationary environment and high exchange rate
15
depreciations. More specifically, when using yearly change in industrial production index, the period between two 1994 and 2001 crises and the period after 2002 are classified as the high pass through regimes. In case of treating inflation and exchange rate changes as a threshold variable, post-1999 period is identified as high pass through regime. These results contradict with results of Kara and Öğünç (2008) and Kara et al. (2007). The reason for this contradiction may be the sample period. The period covers both the managed pegged regimes and floating exchange rate regime, but mostly dominated by the managed and crawling peg regimes. This is why the results of the paper may not be consistent with other studies including Kara and Öğünç (2008) and Kara et al. (2007).
2.4 A Brief History of Exchange Rate and Inflation Dynamics of Turkey:
1990‟s can be characterized as periods of high depreciations and persistent inflation periods for Turkey. During 1990s, Turkey experienced managed and crawling peg regimes and exchange rate was the main policy instrument to control inflation. Due to real exchange rate targeting, nominal exchange rate depreciated as much as past inflation and hence, this period can be named as continued depreciation period. With the adoption of floating exchange rate, exchange rate is determined by supply and demand conditions and contrary to the pre-float period, both appreciations and depreciations were observed. Besides, volatility of exchange rate has increased in the post-float period. Therefore, switching to floating exchange rate regime caused a structural change in exchange rate behavior (Kara and Öğünç, 2008). This remarkable shift in exchange rate dynamics coupled with the adoption of inflation targeting regime brings about a change in degree and speed of pass through. More specifically, pass through is slower and lower in post-float period (Kara and
16
Öğünç, 2008). In the light of this information, it is more appropriate to analyze pass through behavior in Turkey separately for the pre-float and post- float periods.
17
CHAPTER 3
THRESHOLD REGRESSION MODEL
The threshold regression model is a piecewise linear model in the space of the threshold variable. More specifically, the system is linear within the particular regimes but it is nonlinear across regimes. In a simple threshold regression model with one threshold, the sample is divided into two groups based on the threshold value. However, this value is not known and needs to be estimated. Besides, in order to obtain more accurate estimation it should split the sample such that each group has enough observations1. The threshold regression model with two regimes can be written in the form (Hansen, 1996, 2000).
𝑦𝑡 = 𝛼0+ 𝛼1𝑥1𝑡 + ⋯ + 𝛼𝑚𝑥𝑚𝑡 + 𝑒1𝑡 if 𝑞𝑡 ≤ 𝛾 1
𝑦𝑡 = 𝛽0+ 𝛽1𝑥1𝑡 + ⋯ + 𝛽𝑚𝑥𝑚𝑡 + 𝑒2𝑡 if 𝑞𝑡 > 𝛾 2 where is the dependent variable, 𝑥𝑖𝑡‟s are the independent variables where i is an element of 1,2, … , 𝑚 , 𝑞𝑡 is the threshold variable and it may be an element of 𝑥1, 𝑥2, … , 𝑥𝑚 , 𝛾 is the threshold value and 𝑒𝑖𝑡 is the error term which is iid
according to 𝑁 0, 𝜎2 . The regression parameters differ depending on the value of
1
18
𝑞𝑡. When 𝑞𝑡 is less than or equal to 𝛾 , equation 1 holds, otherwise the equation 2 is valid.
If regressors consist of only lagged values of 𝑦𝑡, , the model becomes a threshold autoregressive model (TAR). In addition, if 𝑞𝑡 is one of the lagged values of 𝑦𝑡, it becomes a self-exciting threshold autoregressive model (SETAR). Besides,
smooth transition regression models (STR) are general class of nonlinear time series model that explain deterministic change in parameters over time and it is a weighted average of two linear models. In a STR model, the regime switch is a smooth process since as the threshold variable changes, the system also changes slowly. However, in a threshold regression model, the regime switch takes place abruptly if threshold variable exceeds the threshold value.
Accordingly, the above model can be represented as follows
𝑦𝑡 = 𝛼0+ 𝛼1𝑥1𝑡+ ⋯ + 𝛼𝑚𝑥𝑚𝑡 𝐼 𝑞𝑡 ≤ 𝛾 + 𝛽0+ 𝛽1𝑥1𝑡+ ⋯ + 𝛽𝑚𝑥𝑚𝑡 𝐼 𝑞𝑡 > 𝛾 + 𝑒𝑡 (3)
where 𝐼 . is the indicator function that takes a value equal to either one or zero depending on the regime at time t. Let
𝑋𝑡 = 1 𝑥1𝑡… 𝑥𝑚𝑡
Then the equation becomes
𝑦𝑡 = 𝑋𝑡′𝛼𝐼 𝑞𝑡 ≤ 𝛾 + 𝑋𝑡′𝛽𝐼 𝑞𝑡 > 𝛾 + 𝑒𝑡 (4)
and assuming
𝑋𝑡 𝛾 = 𝑋𝑡′ 𝐼 𝑞𝑡 ≤ 𝛾 𝑋𝑡′ 𝐼 𝑞𝑡 > 𝛾 ′
𝜃 = 𝛼′𝛽′ ′
the equation (4) can be expressed as
𝑦𝑡 = 𝑋𝑡 𝛾 ′𝜃 + 𝑒𝑡 (5)
where 𝜃 and 𝛾 need to be estimated. Even if the equation (5) is nonlinear in parameters, least squares estimation is a suitable method to estimate the equation.
19
This is because conditional on 𝛾 it is linear in 𝜃. Least squares estimate of 𝜃 for given value of 𝛾 and the residuals are expressed below,
𝜃 𝛾 = 𝑋𝑡 𝛾 𝑋𝑡 𝛾 ′ 𝑛 𝑡=1 −1 𝑋𝑡 𝛾 𝑦𝑡 𝑛 𝑡=1 𝑒 𝛾 = 𝑦𝑡 𝑡 − 𝑋𝑡 𝛾 ′𝜃 𝛾
The sum of squared errors is
𝑆𝑛 𝛾 = 𝑛 𝑒 𝑡2
𝑡=1 𝛾 6
The least square estimate of 𝛾 minimizes 𝑆𝑛 𝛾 such that 𝛾 = 𝑎𝑟𝑔𝑚𝑖𝑛 𝑆𝑛 𝛾
𝛾𝜖Ψ where Ψ = 𝛾, 𝛾 .
More explicitly, for each value of 𝛾 belonging to Ψ , the equation (5) is estimated by ordinary least square (OLS) method and for each regression, corresponding sum of squared errors are obtained. The optimal threshold value 𝛾 is the one, which gives the minimum of sum of squared errors. Once the 𝛾 is obtained, the vectors of slope coefficient to be estimated as θ = θ 𝛾 .
Test for Existence of Threshold Effect:
The next procedure is to test whether a threshold effect exists or not. Under the null hypothesis of no threshold effect, i.e. 𝐻0: 𝛼 = 𝛽 the model becomes linear, whereas alternative hypothesis indicates that the responses of dependent variable vary across regimes. Considering the null hypothesis, threshold variable is not identified. Therefore, the frequently used statistics such as likelihood ratio statistics do not have standard distributions and critical values of these test statistics are no
20
longer valid. Hansen (1996) suggests a bootstrap procedure to obtain asymptotic distribution of the test statistics
𝐿𝑅0 = 𝑛
𝑆0− 𝑆1 𝛾 𝜎 2
where 𝑆0 and 𝑆1 are the residual sum of squares without and with threshold effect, respectively and 𝜎 2 is the residual variance under the alternative hypothesis.
If a threshold effect is detected, then a confidence interval should be formed for the threshold. Hansen demonstrates that the best way to form confidence interval is to form “no rejection region”. The null hypothesis of the threshold value is 𝐻0: 𝛾 = 𝛾0 where 𝛾0 is the actual value of threshold and likelihood ratio statistics are as follows:
𝐿𝑅1 𝛾0 = 𝑛
𝑆1 𝛾0 − 𝑆1 𝛾
𝜎 2
where 𝑆1 𝛾0 and 𝑆1 𝛾1 are the residual sum of squares from equation 6 for actual
and estimated value, respectively and 𝜎 2 is residual variance from equation 5 with
threshold. Valid confidence intervals can be constructed for the estimated threshold values via the asymptotic distribution of 𝐿𝑅1 𝛾0 . Since the distribution of 𝐿𝑅1 𝛾0 is not normal, Hansen (2000) computes the “no rejection region” by the following methodology. If 𝐿𝑅1 𝛾0 ≤ 𝑐 𝛼 where 𝑐 𝛼 = −2𝑙𝑛 1 − 1 − 𝛼 , then the null hypothesis of 𝐻0: 𝛾 = 𝛾0 cannot be rejected at the asymptotic level 𝛼 2,3. It means that the confidence region is simply the set of values of the threshold for which 𝐿𝑅𝑛 𝛾 . is less than the asymptotic critical value.
2
It is important to notice that 𝐿𝑅0tests the existence of a threshold effect while 𝐿𝑅1 𝛾0 tests equivalence of the actual threshold and estimated thresholds.
21
Hansen (2000) also generates the heteroskedasticity-consistent Wald or Lagrange Multiplier tests for conditionally heteroskedastic errors, which we adopt in this study. He constructs asymptotically valid confidence intervals for the slope parameters based on the likelihood ratio statistics, 𝐿𝑅𝑛 𝛾 .
Finally, it should be noted that threshold variable can be found from the set of variables or it can be set exogenously. In this study, output gap is set as an exogenous threshold variable based on the motivation of this study.
22
CHAPTER 4
THE MODEL
In section 4.1, the set up of the model is described. Section 4.2 provides description of the data. Last section 4.3 presents unit root tests results.
4.1 Model Specification
Pass through literature can be divided into two strands. One strand examines the responsiveness of import prices to exchange rate, and the other analyzes the transmission from exchange rate to domestic prices. This study falls into the latter category.
Exchange rate pass through to domestic prices is investigated by employing a wide set of econometric methods such as co-integration, vector autoregressive regression (VAR), single equation OLS, generalized methods of moments (GMM), vector error correction model, depending on the purpose of the study (McCarthy,2000; ) The empirical studies investigating a nonlinear response of prices to exchange rate developments generally test one particular kind of nonlinearities by using different methodologies. In several papers, the existence of nonlinearity can be
23
either detected by adding quadratic or cubic terms and interactive dummy terms into the linear equation or employing formal non-linearity tests.4 In this study, we focus on threshold types of nonlinearities and examine the likely presence of asymmetry in response of prices to changes in exchange rate along the business cycle. The key question in this case is how to find out the exact value of threshold. In the absence of theoretical guideline, threshold value is empirically defined and the sample is divided according to this value. The methodology followed in the previous studies is criticized in the literature because the results are likely to be sensitive to the choice of threshold value. (Moschos, 1989). Hansen (1999, 2000) also criticizes the adoption of an ad hoc and arbitrary sample splitting and argues that the estimators obtained from such procedures may cause severe inference problems.5 That is why we adopt the endogenous search techniques outlined by Hansen (2000) to determine the critical values for any thresholds and the confidence interval around these thresholds.
Regarding the choice of the threshold value, Kara et al. (2005) investigate the existence of asymmetry in pass through related to the state of economy as well as appreciation and depreciation periods of domestic currency for Turkey. They impose threshold levels exogenously and divide the sample into four depending on whether output gap is positive or negative and whether the currency depreciates or appreciates. They reach the conclusion that exchange rate pass through is higher in periods of positive output gap and depreciations. However, for Turkey, output is less than the potential output for most of the sample considered. In particular, only for 19 out of 87 observations output gap is positive. For this reason, negative output gap may not really mean a contraction where firms absorb exchange rate changes in their
4
The quadratic functional forms are both non-linear and asymmetric. Another interesting functional form arises with a cubic function, which is non-linear but symmetric.
5
24
profit margin by adjusting their mark-up rather than feeding it into prices. In the light of this evidence, we try to explore the appropriate value of threshold level for the output gap based on threshold regression model (TR).
In this paper, to estimate pass through effect, two types of model are used. The first model illustrates the simple statistical relationship between exchange rate and inflation and it is similar to the model in Kara et al. (2005).
𝜋 𝑡𝑀𝑃𝐼 = 𝛼
1+ 𝛽1𝜋 𝑡−1𝑀𝑃𝐼 + 𝜃1∆𝑒𝑡 + 𝜀𝑡 if 𝑦𝑡−1 ≤ 𝛾
𝜋𝑡𝑀𝑃𝐼 = 𝛼
2+ 𝛽2𝜋𝑡−1𝑀𝑃𝐼+ 𝜃2∆𝑒𝑡 + 𝜀𝑡 if 𝑦𝑡−1 > 𝛾 4.1
The dependent variable is monthly change of the logs of manufacturing price index (MPI) (𝜋 𝑡𝑀𝑃𝐼) and the explanatory variables are monthly changes of the logs of
lagged prices (𝜋 𝑡−1𝑀𝑃𝐼) and monthly change of the logs of bilateral nominal exchange
rate (∆𝑒𝑡 ) In addition, 𝑦𝑡−1 is output gap at time t-1 used as a threshold variable and 𝛾 is the threshold value of output gap. 𝜃𝑖 „s are short-run pass through coefficients
under different regimes.
Apart from the first model, the second model contains import prices measured in foreign currency. This specification enables to observe the response of prices to exchange rate and to import prices denominated in foreign currency, separately. In the standard pass-through models, no distinction is made between changes in import prices measured in foreign currency and exchange rate changes. Instead, these two effects are combined into a single variable, which is change in import prices denominated in domestic currency. However, firms may respond differently to exchange rate and import prices in foreign currency when determining their prices (Mihaljek and Klau, 2001). The second model supports this argument.
25 𝜋𝑡𝑀𝑃𝐼 = 𝛼
1+ 𝛽1𝜋𝑡−1𝑀𝑃𝐼 + 𝜃1∆𝑒𝑡 + 𝛿1𝜋𝑡𝐼𝑀𝑃+𝜀𝑡 if 𝑦𝑡−1 ≤ 𝛾
𝜋𝑡𝑀𝑃𝐼 = 𝛼
2+ 𝛽2𝜋𝑡−1𝑀𝑃𝐼+ 𝜃2∆𝑒𝑡 + 𝛿2𝜋𝑡𝐼𝑀𝑃+𝜀𝑡 if 𝑦𝑡−1 > 𝛾 4.2
Note that the term denoted by 𝜋𝑡𝐼𝑀𝑃 refers to monthly change in logs of unit value of import price index in US dollar and other terms are the same with that of previous specification.
For the second specification, Goldberg and Knetter (1997) and Mihaljek and Klau (2001) suggest to add a control variable for demand conditions in the importing country. Kara et al. (2007) adopt the model suggested by the Mihaljek and Klau (2001) in their simultaneous regression analysis for Turkey. The above specification, however, does not include an explanatory variable to control demand pressures on prices. Instead, we incorporate demand dynamics as a threshold variable into the model, so that we try to capture upward or downward pressures resulting from business cycle on pass through from exchange rate to inflation. One rationale for this specification is that an endogeneity problem may emerge with the inclusion of output gap as a regressor. Another reasoning is that since Turkey has experienced rapid recovery of growth along with disinflationary period following the 2001 crisis, the correlation between output gap and inflation for most of the sample period is negative (Mihaljek and Klau, 2008). Therefore, inclusion of output gap as a threshold variable may be more proper way to capture the impact of demand conditions on pass through rather than incorporating output gap as a control variable.
The second specification may also be justified by the study of KaradaĢ et al. (2006), which aims to analyze the pricing behavior of firms in manufacturing industry sector for Turkey. Their results indicate that main factors affecting pricing strategy of firms are exchange rate developments, cost of production and demand
26
conditions. Moreover, according to their findings, the main driving force behind cost of production is imported inputs for which close substitutes usually do not exist. This implies that the external shocks like fluctuations in exchange rate and import price developments may strongly affect the producer prices and consumer prices through imported inflation of intermediate goods. This is taken into account in the model by the explanatory variables, which are import prices in foreign currency and changes in the exchange rate. Another prominent factor determining pricing decisions of firms is the state of the economy. It is evaluated in the analysis by using output gap as a threshold variable. In the light of these evidences, it can be concluded that the model is appropriate to analyze pass through to manufacturing industry prices for Turkey.
In this study, we rather focus on the short-term elasticities. Apart from the majority of empirical studies, short-run exchange rate elasticity denotes contemporaneous effect of the exchange rate on the price level on a monthly basis instead of a quarter since the analysis is based on monthly model. The motivation of making the analysis on a monthly basis is that the sample period used in estimation covers the short time span from January 2002 to March 2009. Therefore, in case of using quarterly data, the number of observations will not be sufficient to analyze asymmetric effect in pass through. Another rationale is that firms revise their prices in a monthly period according to their cost of production, state of the economy and exchange rate developments (KaradaĢ et al, 2008). In that sense, working with monthly data is plausible.
The majority of the studies analyzing the pass through from exchange rate to domestic prices focus on the reaction of consumer inflation. In this study, however, the response of manufacturing industry prices is of main interest for the following reasons. Major part of the imported goods of Turkey is used in production process
27
rather than in consumption. In particular, the share of intermediate goods (around 75 percent) together with the share of capital goods (around 14 percent) accounts approximately 90 percent of total imports of Turkey in 2008, whereas the proportion of consumption goods accounts only 10 percent of total imports. Hence, pricing behavior of firms in manufacturing industry is highly sensitive to the developments in import prices and exchange rates. Consumer prices, on the other hand, contain also non-tradable goods and administered items like electricity, which are not much dependent on external price developments. In such an environment, it is not surprising to observe that both the immediate and cumulative responses of consumer prices to exchange rate shocks are very low compared to manufacturing inflation (Kara and Öğünç, 2008).6
That is, manufacturing price index responds immediately and on a sizeable manner to exchange rate movements compared to consumer prices. Hence, investigation of the asymmetry in pass through to manufacturing industry prices rather than consumer prices is more appropriate in case of working with monthly data and using only one lag in the regression analysis.
Another reason for working with manufacturing industry prices is that it may provide a better understanding for the pricing behavior of firms in manufacturing industry with respect to business cycle. This is because it excludes some components like mining, energy and agricultural prices, which are mostly driven by exogenous factors. For example, main determinants of agricultural prices are weather conditions and government policy. Inclusion of these prices may, therefore, distort the empirical findings. Manufacturing price index (MPI) constitutes 73.75 percent of total producer price index (PPI) and reflects general market behavior of production side according to external price developments. As a result, it may allow making more
6
28
basic analysis of asymmetry in pass through. In that sense, it is reasonable to analyze manufacturing industry price index as a core indicator of producer price index.
4.2 Data
The data for manufacturing price index is obtained from TURKSTAT and is formed by combining two sources. First, the data after 2003 is expressed as a subcategory of PPI. Second, the data before 2003 is formed under 1994-based Whole Price Index (WPI).
As exchange rate variable, instead of the nominal effective exchange rate or other foreign currencies, monthly average of nominal TL against the US dollar is used in the estimation. While firms and consumers can easily observe the dollar rate, understanding nominal effective rate is difficult. Besides, in forming expectations, dollar is a more effective channel compared to other foreign currencies and nominal effective rate. This is because signals from exchange rate changes to inflation expectations and to the CPI or PPI inflation are more likely to originate from changes in a key bilateral exchange rate followed daily by the agents rather than from the nominal effective rate (Mihaljek and Klau, 2001). In addition, large share of imports is carried out by US dollars, thereby it has more important role for any other currency in explaining the output and inflation dynamics.
Another variable employed in the analysis is the output gap. It is used as a proxy for economic activity. In previous studies, capacity utilization rates (CUR) and industrial production index (IPI) are also used as an indicator for the state of the economy. However, they mainly represent the conditions for industrial sector, which
29
reflects the economic activity to a limited extent7. Therefore, to capture a broader picture, output gap is employed instead of CUR or IPI. Quarterly estimates of the output gap are received from Özlale et al. (2004) and updated. Since the analysis is made on a monthly basis, there is a need to convert it into monthly data. Therefore, monthly distribution of the output gap estimates is obtained by adopting Fernandez (1981) methodology.
Import price data is obtained from TURKSTAT. The base year for the unit value of import price index is 2003 and it is denominated in US dollar. The choice of US dollar denominated import price is consistent with the choice of nominal TL against US dollar as an exchange rate variable.
4.3 Unit root tests of variables:
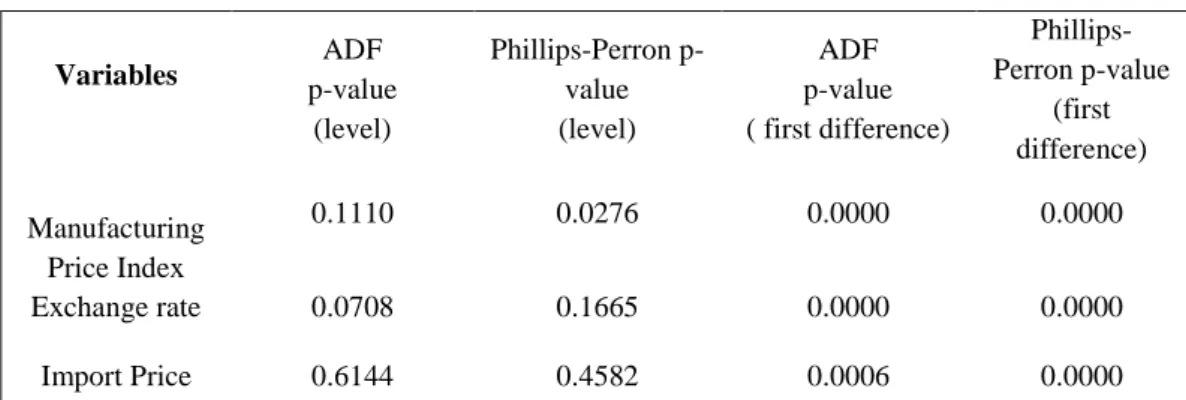
Before employing the TAR model we also need to check whether the variables used in the model are stationary to refrain from a possible spurious regression in case of a non-stationarity. For this purpose, augmented Dickey-Fuller (ADF) and Phillips-Perron unit root tests are performed. The null hypothesis of both tests is the existence of a unit root.
These results indicate that the null hypothesis of unit root for the levels of manufacturing price index, exchange rate and import price index are not rejected. However, we reject the null hypothesis for the first differences of each variable, hence we may conclude that they are integrated of order one, I(1). For this reason, we choose to work with the first (log) differences of these variables. On the other hand, output gap is a stationary variable, by definition.
7
30
Table 4.3.1: Unit Root Test Results
Variables p-value ADF
(level) Phillips-Perron p-value (level) ADF p-value ( first difference) Phillips-Perron p-value (first difference) Manufacturing Price Index 0.1110 0.0276 0.0000 0.0000 Exchange rate 0.0708 0.1665 0.0000 0.0000 Import Price 0.6144 0.4582 0.0006 0.0000
Note: Unit root tests are conducted on logarithms of the variables with a constant term. For ADF and Phillips-Peron unit root tests, lag length is determined by automatic selection procedures and by Newey-West Barlett Kernel, respectively.
In this study, we make the analysis for the period of January 2002 to March 2009. The reason behind the selection of this period is that Turkey has experienced a remarkable change in the structure of economy after 2001 crisis. This leads to a substantial differentiation in the dynamics of output, inflation and exchange rate compared to pre-float period. Finally, the period covered in this paper is relatively intact in terms of monetary policy regime, which is inflation targeting with flexible exchange rate regime.
The descriptive statistics are presented as in Table 4.3.2.
Table 4.3.2: Descriptive Statistics
Variable name Mean Variance Maximum value Minimum-value
Manufacturing Price Index 120.80 658.33 166.13 69.08 Exchange rate 1.41 0.02 1.71 1.17 Import price index 126.51 820.66 197.86 83.83 Output-gap -2.24 12.30 0.74 -17.80
31
CHAPTER 5
ESTIMATION RESULTS
In order to investigate a possible asymmetry in response of prices to the changes in exchange rate depending on business cycle, we construct the model described in the previous part. In this section, we present the estimation results that are obtained from the threshold regression model.
The initial step is to test whether a threshold effect exists in reaction of prices to exchange rate changes with respect to the state of the economy using the likelihood ratio statistics, 𝐿𝑅0, which is described in the previous section. To clarify, we estimate the equation 4.1 and compute the residual sum of squares (RSS) for threshold levels of output gap. Thus, we obtain the optimal threshold level for the output gap, which minimizes the RSSs. The results are presented in the table 5.1.
Table 5.1: The Test Results for Existence of Threshold for The First Model
𝐿𝑅0 p-value Optimal threshold
32
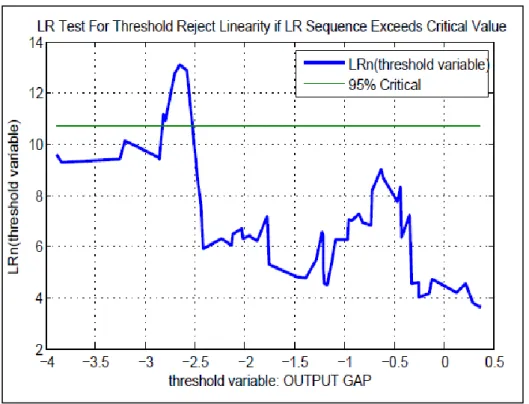
The minimum value of RSSs occurs at -2.71 percent level of output gap. The observed value of likelihood ratio 𝐿𝑅0 is equal to 9.72. Using the bootstrap distributions of likelihood ratio developed by Hansen (2000), we compute the bootstrap p-value, which is 0.048. Thus, the null hypothesis of no threshold effects can be rejected conveniently around 5%. It can also be seen in figure 5.1 where
𝐿𝑅0 is plotted as a function of the threshold variable. The horizontal line shows the 5
percent asymptotic critical value for 𝐿𝑅0. Since 𝐿𝑅0 exceeds the critical value at the threshold value, we reject the null hypothesis of linearity. Consequently, there is strong support for the existence of threshold effect in pass through from exchange rate to manufacturing industry prices.
Figure 5.1: Likelihood Ratio Statistics as a Function of Threshold Variable.
Even if there is an evidence for the threshold effect, we need to check how precise these estimates are. For this purpose, we construct the confidence intervals
33
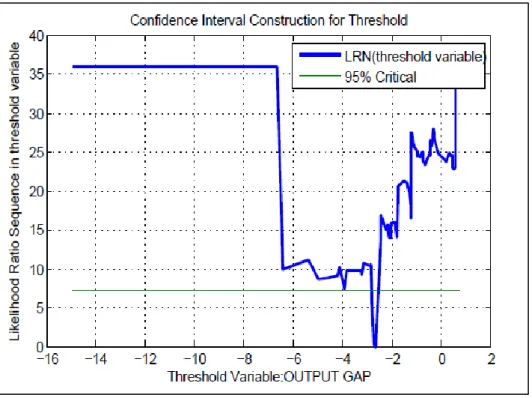
around the threshold estimate. To have a robust estimate, the confidence interval is required to be remarkably narrow, so that the threshold cannot be attributed to either regime. The confidence region is formed based on the likelihood ratio statistics. In figure 5.2, likelihood ratio curve is drawn as a function of the threshold for the first model.
Figure 5.2: 95 % Confidence Interval For the Threshold Variable.
The horizontal line represents 5 % asymptotic critical value 𝑐 𝛼 for 𝐿𝑅1 𝛾0
and at the threshold estimate 𝐿𝑅1 𝛾0 reaches its minimum. The no rejection region
is the set of points where 𝐿𝑅1 𝛾0 ≤ 𝑐 𝛼 . In other words, confidence interval for the threshold estimate is the segment of the curve that lies below the horizontal line. In figure 5.2, the minimum of 𝐿𝑅1 𝛾0 occurs when output gap is equal to -2.70%
and the 95 % confidence interval for threshold is [-2.797, -2.475]. This region is reasonably small as seen in figure 5.2. Only 7 out of 87 observations fall into 95 %
34
confidence interval, so the degree of uncertainty about the location of the threshold is minor. These results indicate evidence for the existence of two regimes.
Table 5.2: Threshold Regression Estimates for the First Model.
Dependent variable Linear 𝑦𝑡−1 ≤ −2.70 𝑦𝑡−1 > −2.70 Constant 0.005** (0.002) 0.001 (0.003) [-0.005, 0.006] 0.01** (0.002) [0.005, 0.012] 𝜋 𝑡−1𝑀𝑃𝐼 0.44** (0.10) 0.47** (0.21) [0.052,0.878] 0.20** (0.10) [-0.027, 0.463] ∆𝑒𝑡 0.12** (0.06) -0.02 (0.03) [-0.078, 0.040] 0.32** (0.06) [0.191, 0.441] R2 0.32 0.26 0.46 Number of observation 87 22 65
Values given in parenthesis denote heteroscedasticity-consistent standard error.
Values in brackets shows confidence intervals Joined R2: 0.46
-Heteroskedasticity Test (p-value): 0.78 * Indicate significance at 10% level ** Indicate significance at 5% level.
The sample is divided into two parts according to the threshold value of -2.70 percent. The periods where the output gap is less than -2.70 percent is identified as periods of recessions. Throughout the period, the exchange rate pass through which is measured by 𝜃1 is not statistically different from zero, whereas it is around 0.32 percent when the output gap exceeds the threshold. The rationale may be that in an expansionary phase, firms can reflect a larger percentage of exchange rate changes on prices in comparison to that of recessions. In periods of contractions, firms may
35
absorb a higher proportion of the cost increases related to depreciation of domestic currency in their profit margin rather than passing it into prices since they have a difficulty in selling their products. This means that during slowdowns large depreciations do not necessarily lead to large price increases.
The parameter regarding past inflation also behaves differently in two regimes. Although it is statistically significant at 5% confidence level in both regimes, it becomes remarkably smaller during expansions. It may be claimed that during recessions, inflation may have inertia and price setters do not fully respond to expected price increases.
Table 5.3: The Test Results for Existence of Threshold for The Second Model
𝐿𝑅0 p-value Optimal threshold
13.09 0.02 -2.65%
Similar to the previous model, for the second specification, we examine the threshold effect in pass through. The value of likelihood ratio is 13.08 and corresponding bootstrap p-value is 0.02 that is lower compared to first model (Table 5.3). It can also be seen from figure 5.3 where 𝐿𝑅0 sequence exceeds the critical value at the threshold value. Therefore, the null hypothesis of no threshold effects can be rejected at 5% level of significance. As a result, it can be concluded that the presence of threshold effect in pass through from exchange rates to manufacturing industry prices is stronger for the second specification compared to the previous model. This may stem from the fact that second specification is more appropriate to reflect the pricing behavior of firms in manufacturing industry sector since imported input costs constitute a larger part of the cost of production.
36
Figure 5.3: Likelihood Ratio Statistics as a Function of Threshold Variable.
To be confident with the estimated threshold level, we also need to compute the confidence region. That is why the likelihood ratio statistics is plotted as a function of the threshold and figure 5.4 is obtained. As a result -2.65 percent of output gap gives the minimum of . The segment of 𝐿𝑅1 curve that lies below the flat
line corresponds to 95 % confidence interval which is [-2.81,-2.59] for the threshold estimate. Compared to confidence interval for the threshold of first model, confidence interval for -2.65 percent is narrower. Moreover, only 3 out of 87 observations fall into this interval, which ensures that the degree of uncertainty about the location of threshold is considerably low. These results suggest that the model has two regimes.
37
Figure 5.4: 95 % Confidence Interval For the Threshold Variable.
An estimated threshold level of -2.65 % split the sample into two parts. When the output gap is less than -2.65 percent, the number of observations is 23 and it can be interpreted as periods of contractions. The regime where the output gap exceeds the threshold level of -2.65 percent contains 64 observations and it can be defined as periods of expansions as seen in table 5.4. Hence, we are confident that both regimes contain enough observations to estimate the model. In addition, it is important to note that the threshold level is not zero. Our finding is in line with the result of Arbatlı (2003). She employs industrial production index as a proxy for economic activity in Turkey and finds –3.28 percent of annual change of industrial production index to be a threshold level. Similarly, Correa and Minella (2006) find threshold level of -1.96 percent for output gap of Brazil.
38
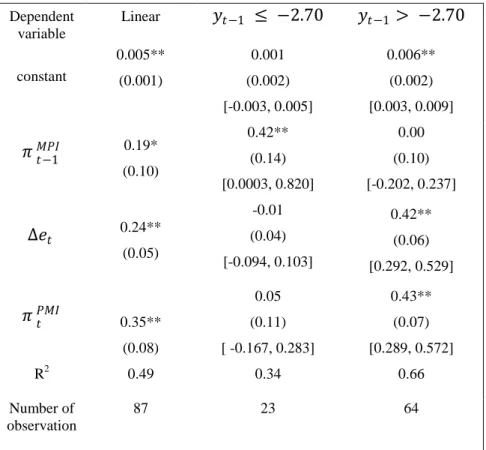
Table 5.4: Threshold Regression Estimates for the Second Model.
The results reported in table 5.4 indicate that when economic activity is low, pass through from exchange rate and from import prices to manufacturing import prices are statistically equal to zero. In periods of expansions, both the coefficients of exchange rate changes and import prices are significant at 5% level of confidence. This supports the previous findings of model 1. On the other hand, past inflation follows a different pattern. While it is statistically significant during the slowdown, it is statistically equal to zero above the threshold level. These results are consistent with those found in the previous studies (Goldfajn and Werlang, 2000; Correa and
Dependent variable Linear 𝑦𝑡−1 ≤ −2.70 𝑦𝑡−1 > −2.70 constant 0.005** (0.001) 0.001 (0.002) [-0.003, 0.005] 0.006** (0.002) [0.003, 0.009] 𝜋 𝑡−1𝑀𝑃𝐼 0.19* (0.10) 0.42** (0.14) [0.0003, 0.820] 0.00 (0.10) [-0.202, 0.237] ∆𝑒𝑡 0.24** (0.05) -0.01 (0.04) [-0.094, 0.103] 0.42** (0.06) [0.292, 0.529] 𝜋 𝑡𝑃𝑀𝐼 0.35** (0.08) 0.05 (0.11) [ -0.167, 0.283] 0.43** (0.07) [0.289, 0.572] R2 0.49 0.34 0.66 Number of observation 87 23 64
Values given in parenthesis denote heteroscedasticity-consistent standard error.
Values in brackets shows confidence intervals Joined R2: 0.63
Heteroskedasticity Test (p-value): 0.77 * Indicate significance at 10% level ** Indicate significance at 5% level.
39
Minella, 2006; Przystupa and Wrobel, 2008). They find that pass through from exchange rate to prices is higher when the economy is booming. That is, low levels of economic activity may offset some of inflationary implications of exchange rate depreciations.
Finally, it should be noted that including import prices in the second model improves the empirical fit. In particular, R2 of the model increases from 0.46 to 0.63. At the same time, although pass through coefficient of exchange rate increases, it is not statistically different from those obtained in the first model. Furthermore, inclusion of import prices leaves the sample division relatively unaltered. In particular, regarding the subsamples in two models, the difference between them is only one observation and the estimated threshold levels are in the same confidence region. This supports the robustness of the estimated threshold level.
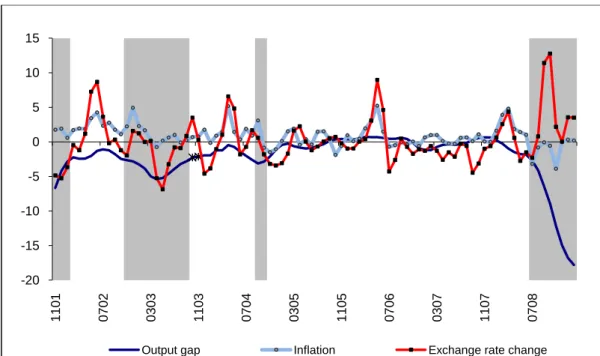
Figure 5.5 illustrates the results regarding the second model. 8 It presents the monthly changes of log of manufacturing industry prices, monthly changes of log of exchange rate in US dollar and monthly output gap series. While the gray areas indicate the periods of contractions where the output gap is less than -2.65 percent, the other area show the periods of expansions in which output gap exceeds the -2.65 percent level. In gray areas, it can be observed that inflation and exchange rate behave differently. In particular, after August 2008 exchange rate depreciates remarkably whereas inflation declines. For the period of first quarter of 2002 and from March 2003 to September 2003, while exchange rate appreciates, inflation increases. These indicate that exchange rate changes are not much transmitted into manufacturing industry prices in a month during slowdowns. That is, inflationary pressure from deprecations may be offset with low levels of economic activity. On
8
The figure 5.5 can also be considered as an illustration for the first model since the sample division is almost the same with the second model.
40
the other hand, when the economy is booming, inflation and exchange rate generally follow similar pattern, which implies the existence of high degree of pass through. As a result, it can be said that the estimated model can explain at least partially the relation between inflation and exchange rate.
Figure 5.5: Output Gap, Inflation and Exchange Rate Movements for Turkey.
-20 -15 -10 -5 0 5 10 15 1101 0702 0303 1103 0704 0305 1105 0706 0307 1107 0708