References
1. L. Sevgi, "Innumreracy: The Meaning of the Numbers We Use," IEEE Antennas and Propagation Magazine, 49, 2, April 2007, pp.
195-190.
2. L. B. Felsen and A. H. Kamel, "Hybrid Ray-Mode Formulation of Parallel Plate Waveguide Green's Functions," IEEE Transac-tions on Antennas and Propagation, AP-29, 4, July 1981, pp. 637-649.
3. L. B. Felsen, F. Akieman, L. Sevgi, "Wave Propagation Inside a Two-dimensional Perfectly Conducting Parallel Plate Waveguide: Hybrid Ray-Mode Techniques and Their Visualizations," IEEE Antennas and Propagation Magazine, 46, 6, December 2004, pp. 69-89.
A Review of Discrete Solutions of Poisson,
Laplace, and Wave Equations
Levent Sevgi
Doou§ University, Electronics and Communication Engineering Department
Zeamet Sokak, No 21, Acibadem
-Kadik6y, Istanbul, Turkey
E-mail: lsevgi~dogus.edu.tr, levent~sevgi@ieee.org
Abstract
One- and two-dimensional discrete solutions of Poisson, Laplace, and wave equations are given in this tutorial. The terms
wave propagation and numerical propagation are discussed. Simple MA TLA B scripts are also supplied.
Keywords: Poisson equations; Laplace equations; propagation; discretization; numerical analysis; FDTD methods; iterative
methods; Taylor expansion; difference equations
1. Introduction
T
he wave equation is a second-order linear partial differential equation that describes the propagation of a variety of elec-tromagnetic, acoustic, and fluid waves. The Poisson/Laplace equation, on the other hand, is a partial differential equation that describes the behavior of electric, gravitational, and fluid poten-tials. They describe some phenomena in electrodynamics and elec-trostatics, respectively. What are the fundamental differences between wave and Poisson/Laplace equations? What do they repre-sent physically or numerically? What type of boundary conditions do they require? Both of them can be put into discrete and iterative forms, and can be solved numerically. People who simulate both the wave equation and Laplace equations use the term numerical propagation. To what does the termn numerical propagation refer 246when waves or potentials are of interest? What do we mean when we say "wave propagation," "numerical wave propagation," or "numerical propagation?" This tutorial simply covers the answers to these questions, together with a few interesting MA TLAB scripts and examples.
2. Taylor's Expansion and
Finite
Difference Discretization
of the Differential Operator
Any continuous, infinitely differentiable function
f
(x) can be represented as an infinite sum of terms, calculated from its derivatives at a single point, x0, as [1]f~
~~
(-O (Xdff(X)xo):ý1ý (X _XO)2d
2f (X0)fIx xo) ! 2 ! dy
+(X - X0)' d'f (xo) +(Xx x)n dnf (x0)
3!
dx3 n!dXn
This sum is called a Taylor expansion, and is used to replace the mathematical derivative with a finite-difference approximation. If -0=0, then the sum is called the MacLaurin series. A Taylor expansion is used to approximate a function with a given accuracy. If x is close to x0, then a few terms would be adequate within a
specified accuracy (e.g., less than a relative error of 1%-2%). More and more terms would be required for the same specified accuracy as x goes further and further away from x0.
A Taylor expansion is also used in the numerical solution of ordinary differential equations (ODE). For example, analytical exact and four-term numerical solutions of the ordinary differential equation dy/dx = -2x -- y with y (0) -1 are yx -3e- -2x+ 2 and
y (x) = I+ Ax -3AX2/2 +
AX3/2.
The numerical solution that is obtained by using y(0), y'(0), y"(0), Y"'(0) ,etc., gives
YN (0.) =~ -0.915,
YN (0.2) =-0.864,
YN (0.5 ) = 0.815,
which may easily be obtained from Equation (1) if Ax =x - x0.
Here, O(Ax) refers to the order of the error (the most significant term of the residue). This is called the forward-difference scheme, because only points x0 and x + x0are used. Similarly,
f W
f(YO-fAX0
X
+
0(Ax),
f X)f(XO +A.X) -f (xo -Ax) O(Ax 2), 2Ax
(4)
(5)
are the backward- and central-difference schemes, respectively. The central-difference scheme uses one point more, but the error is one Order less than for the forward- or backward-difference schemes. The order of the error may be further decreased if the number of points is increased.
Similarly, finite-difference representations of second deriva-tives are
f (xo + 2Ax) -2f (xo -Ax) + f(xo) f 0 (X0) =Ax2
f (xo +Ax) -2f(xo) +f(xo -Ax) f, ) -Ax2(X0
(6)
(7)
for the forward- and central-difference approximations, yielding
errors of the orders of 0O(Ax) and 0O( AX2), respectively.
3. PoissonlLaplace/Wave Equations
The elliptic-type Poisson equation is a partial differential equation widely used to represent physical problems in electrical and mechanical engineering, theoretical physics, etc. It represents various physical problems: the temperature distribution in thermo-dynamics, gravitational fields and a vibrating string in mechanics, the potential distribution in electrostatics, etc. It is given as
V2U (x, y, Z) = f(X, y,
Z),
(8)while the analytical solutions are YA (0, 1) = 0.915,
where, in three-dimensional (3D) Cartesian coordinates, the Laplacian operator, V 2(or, as is widely used, A) is given as YA (0.2)=- 0.856,
YA (0.5) = 0.810.
The mathematical definition of a derivative is given as
f'(xo)
I df _=_ f(X0 +A,,) f (X0) (d, 0o Ax
Numrerically, Equation (2) can be replaced with
f'(x 0) -= f (X0+ )f f(X0)+ o(Ax), (3
Ax
2 2 a2 a2
2
l 2
ay
2
a9
(9)
If the right-hand side of Equation (8) is the Dirac delta function, .S(x -x') (y -y') (z -z')., then the Green's function, g k ,y z; X',y',Z'), replaces the function U . The Poisson equation is not a basic equation, but it follows directly from Maxwell's equations if all time derivatives are zero, i.e., for electrostatic con-ditions. In electrostatics, the Poisson equation expresses Gauss's Law: U is the scalar potential function, and is obtained from the solution of Equation (8) under a given charge density distribution function,
/
(i.e.,f
- p/e, where p and E are the volume charge density and permittivity of the region, respectively). On theother hand, in elasticity, U in one dimension denotes the trans-verse displacement along the direction of a stretched string under a nonzero tension, T, with the right-hand side of Equation (8) being
f
= w/T, and with w being the force density. Equation (8) becomes the Laplace equation for vanishingf .
1-0
0.0
The wave equation,
(10)
represents waves (spherical in three dimensions, cylindrical in two dimensions) in the time domain in electromagnetics, and c = 1/ cou is the velocity of light in free space. Note that for a specified geometry, Equation (8) represents a boundary-value problem (BVP), but Equation (10) is an initial-boundary value problem (IBVP).
4. Iterative Solutions and
MATLAB-Based Simulators
The Poisson, Laplace, and wave equations can be solved numerically. One way is to discretize and put them into iterative forms.
4.1 PoissonlLaplace Equation
Suppose the Poisson equation is considered in one dimension along the z direction in a finite region, 0 < z <ý-Z__, The differential equation then reduces to
(11)
dz2
(zWfz,and can be uniquely solved if the boundary conditions, U (0) and U(Zm,), are supplied. The geometry of the problem is given in Figure 1. The finite-difference solution of Equation (11) is
U (k) = -1[U (k +1) + U(k -1) -f(k)], (12)
and it is applied to all inner nodes (i.e., k-=2,3,4,..,KE -1, KE being the number of nodes). This states that the potential value at a node is determined by the values at two neighboring nodes and a given charge distribution. The terminating values, U (1) and U (KE), should be supplied as boundary conditions. In two dimen-sions, Equations (11) and (12) become
-1.0 -2.0 I Potential
r
-J
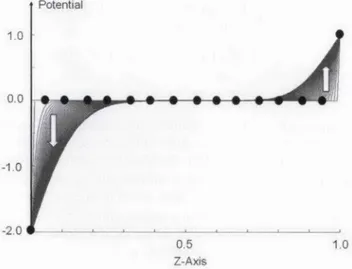
S~ - S S S S S ~ 0.5 Z-Axis 1.0Figure 2. A numerical solution of the Laplace equation for
Zin 1,KE =100 U(0 = 2, Ul) 1, = 2, Y5103.a2+a2 IUI,.Y)=f(.X,Y),
Tx2 aY
(13)(14)
This states that the potential at a node can be calculated from the potentials at four neighboring nodes plus a given charge distribu-tion. Figure 2 shows the results of a Laplace problem with Z.. -=1,
U (0) = -2, and U (1) = 1. This means that the potentials at the left and right are -2V and
lV,
respectively. The problem is to find theU (x) function that satisfies these boundary conditions and tion (11). Initially, all the inner nodes are assumed zero, and Equa-tion (12) is applied over and over again, in an infinite loop. The iterations cause the boundary potentials to propagate node by node from both ends. As the number of iterations increases, the potential values at the inner nodes change because of the contributions from the left and right then converge. The difference between each iteration and the previous iteration becomes less and less, and finally settles to a fixed value. A kind of convergence criterion, such as "the iterations may be terminated if the sum of the differ-ences between two consecutive iterations of all nodes is less than a given value," may be set. In one dimension, this is equivalent to setting
KE
EjnZ
U'U •, k=1(15)
where ), is the total error limit. The arrows in Figure 2 show the propagation of the potential values at the nodes as the number of iterations increases. The thick line is the final potential distribution that satisfies a given error criteria.
2
U
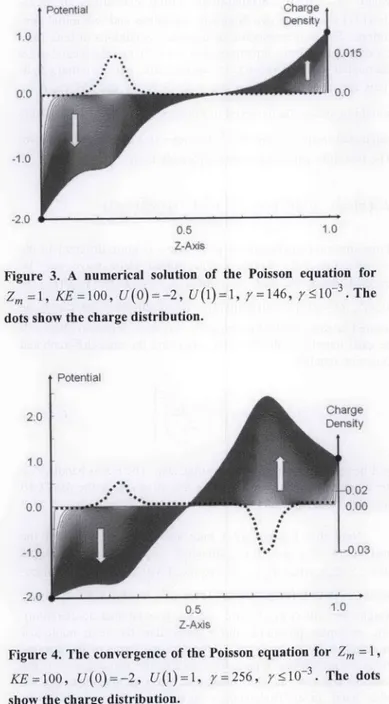
=0 Z=ZýFigure 3 shows the progress of iterations for the Poisson
=0Z equation for the same space and boundary conditions given in
Fig-I
II
ure 2, but with a Gaussian type of charge distribution. The dots
(1) (2) (3) (KE) show the given charge distribution. The left and right vertical axes (1) (2) (3)
...
(KE)correspond to potential and normalized charge densities (i.e.,
Figure 1. A one-dimensional, finite,
zspace.
p, /,-), respectively. Figure 4 shows another simulation result for248 IEEE Antennas and Propagation Magazine, Vol. 50, No. 1, February 2008
2_ 1 a2
V C 2
at
2 U(xyz;t)=O,Charge Density
tPotential
1.0 0.0 ... -1.0 -2.0 p 0,01 S 0.0 1ý0 0.5 Z-AxisFigure 3. A numerical solution of the Poisson equation for
Zml
=I KE-=l00, U (0) =--2, U (1) =1, yr=
14 6,
Y:510O 3.The
dots show the charge distribution.
az
at
a E,(16)Hy -,o a
Note that the second-order uncoupled wave equation, Equa-tion (10), is directly obtained from EquaEqua-tion (16) and (17) if, for example, one of them is further differentiated with respect to z and they are combined to eliminate either E., (z, t) or Hy (z, t) . The unique solution of Equations (16) and (17) can be given when the initial and boundary conditions are specified.
The iterative equations for these coupled first-order plane-wave representations, discretized according to the finite-difference scheme, are
(1 8a)
(1 8b)
Poenia H (k) = H yn'(k) -At [E n, (k) - E .- (k-I1)]
Ch De
1L03
05 1.0
Z-Axis
Figure 4. The convergence of the Poisson equation for Zm =I,
KE-.l00, U(0)=-2,U(1)=1,
7=256,r<ý10
3'.The dots
show the charge distribution.
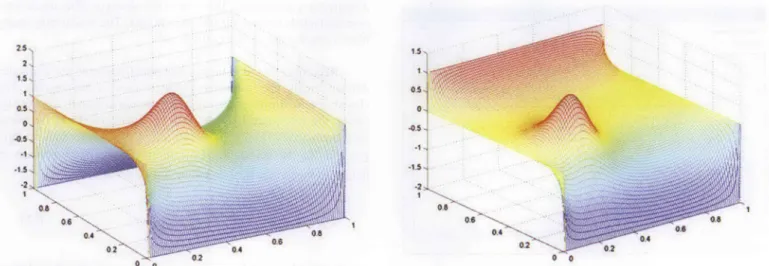
the Poisson equation for the same parameters except the charge distribution. Again, the dots show the normalized charge distribu-tion, and the left and right vertical axes correspond to the potential and charge densities, respectively. Finally, two examples for the solution of the Poisson equation in two dimensions, computed from Equation (14), are illustrated in Figure
5.
4.2 Wave Equation
Now, let us take the wave equation into account. Assume a plane wave, having E, (z, t) and Hy (z, t) , propagating along the z direction in a finite region 0 <ý z
<5Z_
and for tŽý 0 (actually, the electric and magnetic fields have both x and y components in this case, but this assumption further simplifies the equations without loosing generality). The two partial differential (first-order coupled wave) equations under this assumption, derived directly fromMaxwell's equations, are
IEEE Antennas and Propagation Magazine, Vol. 50, No. 1, February 2008
arge where z =kAz and I=nAt (k and n are integers). Note that the isity classical Yee cell (leap-frog approach) is used here [2]. Therefore, the electric and magnetic fields along z are located Az/2 apart, and the magnetic fields are updated At/2 later than the electric fields. -. 2 Electric (magnetic) fields in the next time step need only electric
-ý002 (magnetic) fields and two neighboring magnetic (electric) fields at
the current time step.
Iterative equations are open-form representations, and are therefore conditionally stable: At and Az can not be specified arbitrarily. The physical restriction of the stability condition is that the discrete time and spatial steps cannot be specified independ-ently. Here, Courant stability applies: once Az is determined, At is chosen such that At: • Az/c. Finally, Az is determined according to the numerical dispersion effect: the highest frequency component should be discretized with a sufficient number of samples (e.g.,
AZ! <2in/110).
The source in Equation (18) can be injected in time using
E.'
(k, ) = E.' (k,) + g(.), where g (n) is any suitable pulse func-tion andk,
is the source node. In general, the Gaussian pulse is usedg (n)-= exp{ _(j no)2} (19)
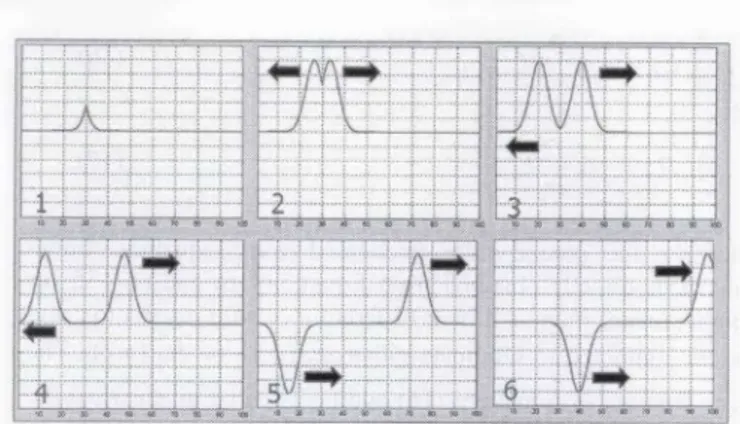
with delay and pulse-width parameters no and nr, respectively. Pulse propagation at different instants of time along a 100-node discrete z space with
k, - 35
and nT = 25 is pictured in Figure 6. As observed, the injection starts as a kind of impulse, then a Gaussian-shaped pulse is formed and splits into two leftward (-z) and rightward (+z) propagating pulses. The space is terminated with a perfectly reflecting boundary at the left and right. The pulses are therefore totally reflected with the opposite phase when they hit the boundaries. (Note that a Gaussian pulse has low-pass filter characteristics: i.e., its frequency spectrum extends from dc to a maximum frequency that is inversely proportional to the pulse 249 2.0 1.0 0.0 -1.0 -2.0Eý',' (k) = E,,n, -1 (k) - At Hn (k) - Hyn (k - 1)
4W W
Figure 6. Plane-wave pulse propagation at different time instants (the pulse was injected in time and PEC boundaries were used at the left and right ends).
length. This is strange, because ths pulse is propagating in air: dc cannot propagate, it can only he transmitted via transmission lines. This is why we call plane waves nonphysical, theoretical waves).
Alternatively, an initial spatial field distribution may be given. For example, the Gaussian-pulsed plane wave may be located in space before the time iteration starts:
E,' (k) exp{
~Kg}
(20a)(20b)
q0 = /io /,,o= 377 Q.
Here, z, =k,Az is the location of the pulse maximum, and
Zg =Kg Az is the extent of the spatial pulse. Note that a Gaussian
pulse in space is injected into both the electric-field and magnetic-field components according to Ohm's Law. This guarantees one-way propagating pulsed plane-wave injection. The ± signs in Equa-tion (20b) represent pulsed plane waves propagating towards the right and left, respectively. (Run the code listed in Appendix B with both signs separately and observe the right and left propagat-ing waves injected via Equation (20). You'll see that the right-propagating pulsed plane wave is injected without any numerical noise, but the left propagating pulse has some residuals. Since iterations in the code are performed from left to right, the nature of a pulse propagating from left to right is coherent with the structure of the code.)
The second-order form for this plane-wave representation for example, for the electric-field component -is
a 2 1 a2~
(21)
The iterative form discretized according to the finite-difference scheme is
(22)
250
where p = cAt/Ax. Second-order partial derivatives in Equa-tion (21) necessitate two boundary condiEqua-tions and two initial con-ditions. The implementation of boundary conditions in both first-order coupled forms, Equations (16) and (17), and the second-first-order decoupled form, Equation (21), are the same, but the initial condi-tions are not: in Equation (22), both E, (z, 0) and aE,
(z, O)/8t
should be given. As observed in Equation (22), E,,'+ is iteratively calculated from E,' and Ent-. Because of this, n starts from two. The first time step is calculated separately fromTime injection of the pulsed plane wave is quite different in the second-order wave equation. The pulsed plane wave may be injected from the left or right (i.e., as E,(0,t)-g(t)) or Ex (Zm, t) - g (t) ). Alternatively, the pulsed plane wave may be
located in space at the beginning. In this case, Equation (20a) will be used initially at the first time step, and the once-differentiated Gaussian function
g'(z):
2 t z-zsexp{
L
Z9
ý2}
(24)
will be used in the next (second) time step. The rest is handled via iterations in Equations (22). These are all given in the MATLAB script listed in Appendix C.
Note that Equation (21) may also be used to model the oscillations of a taut string, stretched between two fixed points ( 0 <ý z •! Z,,1), when Eý, (z, t) is replaced with the vertical displace-ment function, U (z, t), and c = Tg/ w ( T, w, and g are the force, weight for unit string length, and the gravitational acceleration). The examples presented above show that the term numerical propagation in electrostatics, in the iterative forms of the discrete Poisson and Laplace equations, refers to the convergence of the solution and not the electromagnetic wave propagation. On the other hand, in electrodynamics, numerical propagation refers to real wave propagation, since Maxwell's equations in their general
form model electromagnetic waves.
4.3
MATLAB-Based FDTDID
Package
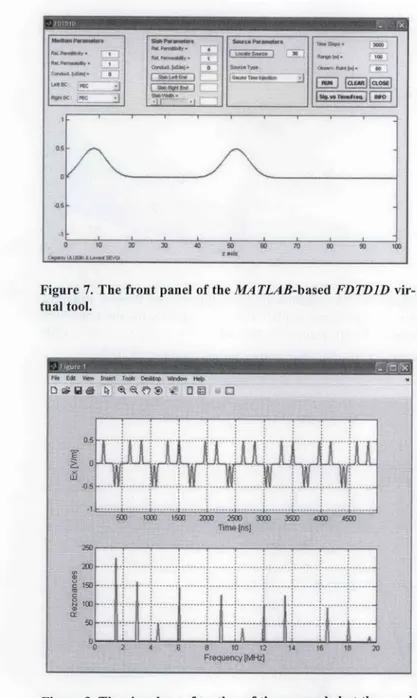
A nice educational package has been developed for the illustration of one-dimensional pulsed plane-wave propagation, and to observe its frequency spectrum. The front panel of the MA TLAB-based FDTDJD virtual tool (visit http://www3.dogus.edu.tr/Isevgi for this and many virtual tools, previously published in the Maga-zine) is quite similar to those of the TDRMeter and MGL-2D vir-tual tools [3, 4]. The front panel of this virvir-tual tool is given in Fig-ure 7. The propagation medium may be free space, partially or fully dielectric-filled, finite, semi-infinite, or infinite. Perfectly reflecting and open boundary terminations may be chosen at the left. An impedance-type boundary condition is also implemented, in addi-tion to these two, at the right terminaaddi-tion.
1'.5
0 02
Figure 5a. The solution of a two-dimensional Poisson equation for a 1 square meter plate (100 x100 space), for the boundary values of (left, right, top, bottom) (1, 1, - 2, -2 ), y = 942, with similar Gaussian charge distributions inside (y:<10-3).
Figure 9. The lowest four modes and their null points.
IEEE Antennas and Propagation Magazine, Vol. 50, No. 1, February 200825
-2
080
Figure 5b. The solution of a two-dimensional Poisson equation for a 1 square meter plate (lO0xlOO space), for the boundary values of (left, right, top, bottom) (0, 0, 1, -2), y = 865, with similar Gaussian charge distributions inside (y: •10-3").
directly traveled between the source and observer. The others were once-reflected, twice-reflected, etc., pulses. The reader may easily identify each pulse in this figure.
Recording this time history and transforming to the frequency domain yields the resonance characteristics of the region. Any closed region forms a resonator. In one-dimensional electromag-netics, the resonance frequencies (i.e., eigenvalues) can be calcu-lated analytically from ff,I), =150n / Z. [MHz], where n is an inte-ger and Zn is the length of the finite region. These resonances belong to the modes (i.e., eigenfunctions), given as
(25)
Figure 7. The front panel of the MATLAB-based FDTD1D vir-tual tool.
Figure 8. The signal as a function of time recorded at the speci-tied observation point and its frequency spectrum, showing the
resonances.
The front panel is divided horizontally into two. Parameters, grouped and located into four blocks, are supplied at the top; the electric field as a function of range is displayed at the bottom. The medium parameters are supplied in the first blocks. The user also specifies the termination conditions at the left and right within this block. The second-left block is reserved for the slab, which can be located vertically in the region, and the third block is used for the source specification. The source may be a Gaussian-pulse injection at anywhere in the region, a plane wave entering from left or right, or CW or rectangular-pulse injections. Finally, the last parameter block is for the operational parameters.
The Plot Sg .vs .Time button is used for offline separate graphs of signal as a function of time and its spectrum (i.e., signal as a function of frequency) at the chosen observation point. An example is given in Figure 8. The region was 100 m long, so the time step was nearly 3.3 ns. It took a pulse 330 ns to travel from one end to the other. The first pulse belonged to the pulse that
252
which are orthonormal wave objects. In this example, Zm, = 100 m, and therefore the first (dominant) resonance frequency was 1.5 MHz, and the rest were integer multiples (i.e., 3.0 MHz, 4.5 MHz, 6.0 MHz, 7.5 MHz, etc.). The bottom plot in Figure 8 shows this spectrum. As observed, the resonances at integer multi-pies of 7.5 MHz were missing (see
[5]
for the mathematical and numerical requirements for the discrete and fast Fourier transfor-mations, DFT, FFT).In order to observe a resonance (an eigenvalue) in the fre-quency spectrum, both the source and the observation points must not lie on null points (i.e., zero crossings) of that mode (eigenfunc-tion). For example, Equation (25) tells us that the dominant mode (n = 1) has no null point; therefore, a source located anywhere in the region excites the dominant mode. On the other hand, the sec-ond mode (n =2) and all other even-order modes (i.e., n = 4, n =6, etc.) have null points at mid-range. This means that if either the source or observation point is located at the midpoint (i.e., at z =50 in), then these modes either are not excited, or are excited but not observed.
Figure 9 plots the first four modes of a one-dimensional reso-nator. A source at point A (at mid-range) excites the dominant mode and the third mode; but even-order modes can not be excited. A source at point B excites all four modes, except for the third mode; at point C all four modes but the fourth are excited. Finally, a source at point D excites all of them. In the above example, the locations of the source and observer were 30 m and 60 mn, respec-tively. This means the source was located at the null point of the tenth mode and its integer multiples (twentieth, thirtieth, fortieth, etc.). The observer was located at nulls of fifth mode and its integer multiples. Therefore, the fifth, tenth, fifteenth, etc., resonances cannot be observed in the frequency spectrum.
5. Conclusions
Wave propagation and numerical propagation may sometimes be used improperly. People who deal with simulations in electro-statics and electrodynamics might refer to different concepts with the same term: numerical propagation. This is because the word iteration has different meanings in the numerical simulation of the Poisson and wave equations. It refers to the convergence of the data for the Poisson equation, but yields the time progress in the wave equation. This tutorial was devoted to the discussion of these terms. Numerical simulations of the Poisson/Laplace and wave equations were taken into account, and these terms were discussed for the discrete iterative solutions of these equations. MATLAB
scripts were also supplied.
IEEE Antennas and Propagation Magazine, Vol. 50, No. 1, February 2008 T
V2 Ir
'Eý11 (0 = L sin
6. Acknowledgement
The author would like to express his gratitude to Qagatay Ului~ik for his contributions in the preparation of the graphical user interface of the MATLAB package.
7. Appendix A:
A Short MATLAB Script for the
One-Dimensional Poisson Equation
% ý- PoissonID.m, Dec 2007 cdc; clear all; close all;
LZ =1; % input('Length of I D Medium [in]:T)
NZ=-100; % input('Number of nodes along Z:T) NI =1000; % inputCNumber of iterations (NI):') u(1) - input('Potential at left boundary (z=0): '); u(NZ) =input(¶Potential at right boundary (z=LZ): ) % Parameters
Eps~l.e-3; dz=LZI(NZ-1); iO=NZI4; aO llsqrt(2.*pi*iO^2);
for i I :NZ % set initial values for zo and u() z(i)-(i-1 )*dz;
end
figure (1); hold on; plot(z,u); xlim([0 LZ]);
xlabel('Z-axis'); ylabei('Potetial [V]'); % Main iteration loop
k 0; ueps-lO0; while ueps>Eps k k+i; ueps=0; for i=2:NZ- I old=u(i); new--u(i); ueps~9Ieps+(abs(new-old))^2; end if k>N I
display('Maximum iteration number is exceeded. break
end
plot(z,u); pause(0.002);
end % End of iteration loop
,plot(z,u,'r, 'Linewidth', 2);
fprintfl'Total. Number of Iterations =%3d ', k);
figure(2); subplot(2, 1, 1)
plot(z,Ui,'k--', 'Linewidth', 3); ylabel('Charge distribution')
subplot(2, 1,2)
plot(z,u,'r', 'Linewidth', 2); xlabel(ZX-axis'); ylabel('Potetial
8. Appendix B:
A Short MATLAB Script for
One-Dimensional First Order Coupled Wave
Equations
%___ FDTD1D~m, Dec 2007 epsO-8.82e-12; muO~pi*4e-7; eta--sqrt(mu0leps0); c-i.Jsqrt(epso*muo); Exoldr=0O; Exoldl-0;rbc-0; % Reflecting boundary at right lbc 1; % Open-boundary at left nt=500; %inputQ'Number of time steps=-? '); zmax~l; %input(QMaximum distance [in] =-?');
ke=10i; %input('Number of range steps, ke
[
) kc=30; %input('Source location, kc[]
=? '); delz-floor(zmax/ke); dt~delz/c; tt-ke/2; t=1 0; ce--dtl(epso*deiz); ch dtl(muO*delz);band-c/(i 0*delz); alfa 3.3*band*band; shift=4./sqrt(alfa);
% (1) put zeros (2) Inject a plane wave for k-i :ke % Initial values along z
Ex(k)=0.0; Hy(k)=0.0; z(k)-k; % (1)
end
for n-i :nt % FDTD time ioop starts t--n*dt;
for k=2:ke-1 % Ex is calculated alon z Ex(k)=Ex(k)+ce*(Hy(k-l)-Hy(k));
end
% Inject Gaussian pulse
Ex(kc)=Ex(kc) + exp(-a~fa*(t-shift)^2); if lbc==0; Ex(1)-Exoldl; end if rbc 0O; Ex(ke)=Exoldr; end
for k-I:ke-1 % Hy is calculated along z Hy(k)=Hy(k)+ch*(Ex(k)-Ex(k+1 ));
end
Exoldr-Ex(ke- 1); Exoldl=Ex(2);
plot(z, Ex);
xlim([i,ke]); ylim([-.iJ.]); xlabel('z axis'); grid,
pause(0.00i)
end % end of time loop
9. Appendix C: A Short Matlab Script for
the One-Dimensional Second-Order
Decoupled Wave Equation
% -. WAVE 1 Dm, Dec 2007
%
Eq:
CA2*uz-
utt=0,
0<zocZm,t>0
% IC: U(z,0)=0, U t(z,0)=0%/ BC: U(0,t) =fl (t), U(Zm,t) = t2(t) (Once-Diff. Gauss) epsO=8.82e-12; muO~pi*4e-7;
eta--sqrt(mu0/eps0); c I ./sqrt(epsO*muo);
Zm= I-1
NZ =100; kmax =500;
%o input('Length of z space, Zm [in]:
%input('Number of nodes, n
[
%input('# of time iterations :% Calculate other parameters (using stability condition) z =0:delz:Zm; delz-Zm/(NZ-1);
delt delz/c; p c*delt/delz; % Prepare 1 D arrays for the iterations u =zeros(1,NZ); % Current time values ue zeros(1 ,NZ); 00 Previous time values
uy = zeros(1,NZ); % Next time values uold 0.0;
% Source parameters
band-c/(l 0*delz); alfa=3.3*band*band; shift=4./sqrt(alfa);
% Locate Gaussian pulse in space (at t-0) ns=NZ/4; nT=NZ/5;
for k =2:NZ-lI end
fork 2:NZ-l % First Time step f2= -2*(k-ns)*exp(-(k-ns)A2/nT)/nT;
uy(k)=(1 -p,'2)*u(k)+delt*f2+0.5*pA2*(u(k-l1)+u(k±1 )); end
ue-u; U uy;
for n-l :Nmax % Time Iteration starts tmn*delt;
% Inject fl(t) from left or f2(t) from right
% u( 1)=-(0.5 *n/ntO)*exp( 1 6.*(n*delt-ntO*delt)A2/(nT*delt)A2); % u(n)=(O.25*n/ntO)*exp( 1
6.*(n*delt-ntO*delt)A2/(nT*delt)A2); u(l)=0.0; u(NZ)=0.0; 00 uold;
for k=2:(NZ-l1)
uy(k)=2 -^)u~)u~)p^2*1
~k1
)+u(k+1 )); enduold u(k-l);l % Inject source in time
% uy(ns) uy(ns)-(0.5*n/nt0)*exp(- 1 6.*(n*delt-nto*delt)^2/(nT*delt)^2); ue u; u uy; % Replace the arrays
% Plot wave vs. x-axis
plot(,',u); xlim([ 1,Zm]); xlabel('x axis'); pause(0.001) end % End of the time loop
10. References
1, C. F. Gerald and P. 0. Wheatley, Applied Numnerical Analysis, Sixth Edition, New York, Addison-Wesley, 1999.
2. K. S. Yee, "Numerical Solution of Initial Boundary Value Problems Involving Maxwell's Equations," IEEE Transactions on Antennas and Propagation, AP-14, May 1966, pp. 302-307. 3. L. Sevgi and Q. Ului~ik, "A MATLAB-Based Transmission-Line Virtual Tool: Finite-Difference Time-Domain Reflectometer," IEEE Antennas and Propagation Magazine, 48, 1, 2006, pp. 141-145.
4. G. Cýakir, M. Qakir, and L. Sevgi, "A Multipurpose FDTD-Based Two-Dimensional Electromagnetic Virtual Tool," IEEE Antennas and Propagation Magazine, 48, 4, 2006, pp. 142-15 1. 5. L. Sevgi, "Numerical Fourier Transforms: DFT and FET," IEEE Antennas and Propagation Magazine, 49, 3, 2007, pp. 238-243.
254 IEEE Antennas and Propagation Magazine, Vol. 50, No. 1, February 2008
