Sinan Zeyneloğlu, Yaprak Civelek,
Ibrahim Sirkeci ISSN 2071-789X
RECENT ISSUES IN SOCIOLOGICAL RESEARCH
Economics & Sociology, Vol. 9, No 1, 2016 139
Sinan Zeyneloğlu, Zirve University, Gaziantep, Turkey,
Regent’s Centre for Transnational Studies,
INTER-REGIONAL MIGRATION
AND INTERMARRIAGE AMONG
KURDS IN TURKEY
Regent’s University, London, UK,
E-mail: [email protected] Yaprak Civelek,
Istanbul Arel University, Istanbul, Turkey, E-mail:
[email protected] Ibrahim Sirkeci,
Regent’s Centre for Transnational Studies,
Regent’s University, London, UK,
E-mail: [email protected]
ABSTRACT. This study examines interregional migration and intermarriage of internal migrant Kurds in Turkey using the latest available census data. Unlike many other studies, birth region is used as a proxy of ethnicity due to the apparent language shift among the Kurds in Turkey. To ensure comparability, only regions where both Turkish and Kurdish populations co-exist are selected for analysis of intermarriage. Analysis of language shift is based on the 2003 Turkish Demographic Health Survey data to ensure temporal comparability with the 2000 Census. Variables used for tabulation are sex, age group, region of residence and educational attainment. As prevalence of intermarriage remains rather constant within each education category, the increase in intermarriage of Kurds to non-Kurds at the aggregate level appears to be a product of rising education. Also the gender gap in favour of males appears to be a construct of differences in educational attainment levels, since Kurdish women out-marry more than their male co-ethnics once they have completed primary education or studied further. A similar picture is also observed among Turks, as the majority, intermarrying to Kurds in Turkey. The findings are in line with the modernization theory as opposed to the exchange theory.
Received: October, 2015 1st Revision: November, 2015 Accepted: December, 2015
DOI: 10.14254/2071-789X.2016/9-1/10
JEL Classification: J12, I20 Keywords: internal migration, intermarriage, language shift, universalism, Kurds, Turkey.
Introduction
This paper focuses on internal migration and intermarriage patterns between Kurds and non-Kurds who moved between regions of Turkey in the last four decades of the 20th century. We aim to assess the spatial and consanguinal boundaries between Kurds and Turks in recent history. Kalmijn (1998) argued that intermarriage is an indication of interaction across group boundaries in that members of different groups accept each other as equals while more recent studies also claim that intermarriage is a sign of boundary blurring (Black, 2013; Horowitz, 2015). Studies as early as Drachsler (1921) or Gordon (1964) have viewed intermarriage as an indication of assimilation while Smits (2010) in his recent review argues
Zeyneloğlu, S., Civelek, Y., Sirkeci, I. (2016), Inter-regional Migration and Intermarriage among Kurds in Turkey, Economics and Sociology, Vol. 9, No 1, pp. 139-161. DOI: 10.14254/2071-789X.2016/9-1/10
Sinan Zeyneloğlu, Yaprak Civelek,
Ibrahim Sirkeci ISSN 2071-789X
RECENT ISSUES IN SOCIOLOGICAL RESEARCH
Economics & Sociology, Vol. 9, No 1, 2016 140
that relatively low levels of intermarriage might be a warning sign of violent conflict and/or future separation. Conversely, relatively higher levels of intermarriage might indicate the continuation of a peaceful coexistence or a non-violent secession.
Due to an evident language shift and widespread bilingualism among Kurds in Turkey (Polat & Schallert, 2013; O’Driscoll, 2014; Zeyneloğlu et al., 2015; Zeyneloğlu et al., 2014) we have introduced, for the first time, birth-region (re: territorial association) as a measure of ethnic origin instead of language as overt questions on ethnic identity or ethnic origin are absent in Turkish censuses and surveys. Our hypothesis is that in a universalistic setting intermarriage of both the minority (Kurds) as well as the majority group (Turks) to each other will correlate with education in line with modernization theory. We refute earlier claims of Gündüz-Hoşgör and Smits (2002) who had concluded that the Turkish-Kurdish intermarriage pattern rather fits exchange theory since neither the dataset (TDHS-Turkish Demography and Health Survey) nor the ethnicity marker (mother tongue) used in that study are suitable for the analysis of intermarriage as is elaborated in the following sections.
The paper is organised as follows: We first introduce the concept of universalism (as opposed to particularism or differentialism) and discuss why and how Kurdish individuals may switch to Turkish identity. We, then discuss the shortcomings of using language as a proxy for ethnicity in the Turkish context drawing on an analysis of the 2003 TDHS data demonstrating language shift among the Kurds. Data and methods are described in the fourth section before general trends of homogamy and in-marriage at the national level are examined. Following the conceptual framework and the context, we discuss the relationships between inter-regional migration, education and intermarriage among Turkey’s Kurds and Turks. We conclude with recommendations.
1. Birth region versus ethnic identity in a universalistic environment
In his seminal work on the ethnic origins of nations, Smith (1986) observed that some ethnic groups were able to vastly extend in size and territory by incorporating other groups though rather with fluid boundaries, while some other ethnie have established sharper cultural markers and physical boundaries between them and the outside world, albeit in much smaller or even peripheral geographies. He labelled this dichotomy as ‘lateral’ versus ‘vertical’ (Smith, 1986, pp. 76-79). While his observations on the lateral versus vertical dichotomy seem precise, his arguments about its reasons remain case-based, are not exhaustive, and contain transitions of the same ethnie between the two main categories, thus straining the initial theory (1986, pp. 82-98, 105-119).
Todd (1985), on the other hand, suggested a bijective link between the anthropological family type prevalent in a region or a nation and its political structure. The concept of equality in Todd’s work is similar to the lateral/vertical dichotomy of Smith. Todd (1985, pp. 7, 28, 55-65) argues that groups where parents treat all brothers as equal and the inheritance is shared equally between the brothers as a sign of this equality have a tendency to assimilate subjugated ethnie. Todd refers to these ethnie as ‘universalistic’ as they possess an a-priori ability to treat other groups as equal to themselves (in practice conditional to acculturation) while ‘particularistic’ ethnie which are marked by traditional primogeniture differentiate themselves from the rest using real or imagined markers (Todd, 1985, pp. 55-58).
This is not to argue that universalistic human groups are more tolerant and open to diversities. On the contrary, most universalistic nations tend to deny ethnic differences and are repressive towards any group which resists assimilation which may even go as far as the complete denial of the very existence of an ethnic group or its presentation as a regional or folkloric element stripped of any ethnic dimension. The responses of the French, Spanish or Turkish states, just to name a few with universalistic core ethnie, towards their ethnic
Sinan Zeyneloğlu, Yaprak Civelek,
Ibrahim Sirkeci ISSN 2071-789X
RECENT ISSUES IN SOCIOLOGICAL RESEARCH
Economics & Sociology, Vol. 9, No 1, 2016 141
‘minorities’ throughout most of their histories as nation-states have been in that line as observed in the cases of the Occitans in France (Field, 1980) and the Kurds in Turkey (Bayır, 2013; Bozarslan, 2014).
It can be expected that educational attainment especially among universalistic ethnie will raise intermarriage in line with the modernization theory since participation in formal education is likely to encourage minority members to associate with the strength and values of the universalistic core ethnie (Smith, 1986, p. 136). For particularistic ethnie which are marked by traditional primogeniture as well as for the Anglo-Saxon communities which in Todd’s analysis form the only anthropological type who have no predetermined disposition on the concept of equality as reflected in their traditionally liberal and choice-based inheritance regime (Todd, 1985, pp. 108-111, 130-131), the relation between education and prevalence of intermarriage may be weaker or even reverse so that intermarriage patterns may rather fit exchange theory. Rosenfeld (2008), using US Census data found that in-marriage of Hispanics significantly decreases with increasing education, and further, that Hispanics, carriers of Spanish universalism according to Todd (2003, p. 110), have lower odds of in-marriage in all education groups compared to the other ‘racial’ groups in the USA. Indeed, the very labelling of the two main population groups as ‘non-Hispanic Whites’ and ‘non-Hispanic Blacks’ in contemporary US census clearly reflects the lack of an a-priori universalism as these categories are based on acquired elements so that neither ‘boundary crossing’ via achieved characteristics (i.e. education), nor a ‘boundary shift’ through a corrective redefinition are expected to occur across such – using Richard Alba’s (2005) terminology – ‘bright’ boundaries, with the sole exception of the bewildering ‘Hispanic’ category with its wide and blurred spectrum.
However, one should not assume that universalism eradicates ethnic or racial preferences in the marriage market. Though racial preferences in partner choice exist in Turkey in that ‘European looks’ are favoured in the marriage market (Magnarella, 1976), the effect of universalism, however, is that an a-priori and lump-sum segregation (such as an anti-miscegenation law in the style of Virginia’s ‘Racial Integrity Act’ of 1924) towards any group with darker skin colour has never been the case in Turkey, similar to almost all other universalistic ethnie. Hence, intermarriage is not rare among Turkey’s Kurds (Gültekin, 2012) and it was even explicitly promoted in the early periods of Turkish nationalism (Uzer, 2013).
While there are important demographic differences between the Turks and the Kurds in aggregate terms (Sirkeci, 2006; Zeyneloğlu et al., 2011), at the individual level they are expected to intermarry due to reciprocal universalism irrespective of the ethnic conflict at the group level. Based on modernization theory, we expect that the propensities of out-marriage of both Kurds (as the minority) and Turks (as the majority) increase with education (i.e. the rejecting exchange theory for the case of Turkey). We also argue that ‘language’ is not a suitable indicator of ethnicity for the analysis of intermarriage patterns due to ongoing language shift among Kurds (Polat & Schallert, 2013; Zeyneloğlu et al., 2015; Zeyneloğlu et
al., 2014). Additionally, we have to mention that even without reciprocal universalism
intermarriage may lead to language shift (Kuo, 1978; Stevens, 1985; Alba et al., 2002). 2. Is language an adequate marker in identifying ethnic groups?
“Scholars persist in regarding language as the distinguishing mark of ethnicity, a standpoint that leads to gross simplification and misunderstanding” (Smith, 1986, p. 27).
Studies on Kurds in Turkey are not spared from this simplification as many studies are data driven, researchers using TDHS or census data have used ‘mother tongue’ or other language questions as a proxy for ethnicity (e.g. Mutlu, 1996; Sirkeci, 2000; Gündüz-Hoşgör and Smits, 2002; Koç et al., 2008).
Sinan Zeyneloğlu, Yaprak Civelek,
Ibrahim Sirkeci ISSN 2071-789X
RECENT ISSUES IN SOCIOLOGICAL RESEARCH
Economics & Sociology, Vol. 9, No 1, 2016 142
However, there are problems with this assumption. The term ‘mother tongue’ carries some ambiguity in Turkish translation. Though the Turkish word ‘anadil’ literally means ‘mother tongue’, it is also used in the meaning of ‘main-language’, i.e. the language currently spoken. In all Turkish census forms since 1927, the explanation for ‘anadil’ is given as ‘the language spoken at home and/or within family’ which for a grown up person can be different from the one learned in childhood. In the 1985 Census questionnaire, this question was even directly formulated as “The language you speak at home and among family?” without using the term anadil at all. While the use of language questions in censuses ceased by 1985 (never released after 1965), the TDHS data includes language variables since 1993.
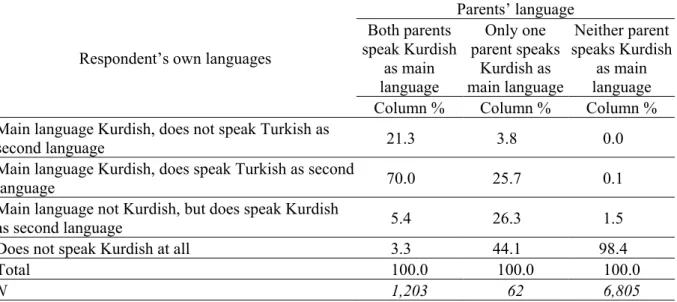
In the TDH Surveys no explanation follows the corresponding question on ‘mother tongue’ leading to uncertainty on this matter. It is assumed that mother tongue in the TDHS data refers to the language first learned in childhood and still understood (Dündar, 1998, pp. 33-34), which is in sharp contrast to the description used in Turkish censuses, and probably also incongruous to the subconscious perception of most members of the general population. While TDHS claims to have collected the language learned first in childhood, many respondents interviewed during the successive surveys may have referred to their current language, which may be different from the one learned first in childhood due to assimilation; or, that the language learned first in childhood may not be identical with that of the parents’ first language due to language shift. Hence, using TDHS data, we present how language shift occurs and how it differs according to educational attainment among the Kurdish ethnie in Turkey as shown in Table 1 and Table 2.
Table 1. Parents’ language versus respondent’s language
Respondent’s own languages
Parents’ language Both parents speak Kurdish as main language Only one parent speaks Kurdish as main language Neither parent speaks Kurdish as main language Column % Column % Column % Main language Kurdish, does not speak Turkish as
second language 21.3 3.8 0.0
Main language Kurdish, does speak Turkish as second
language 70.0 25.7 0.1
Main language not Kurdish, but does speak Kurdish
as second language 5.4 26.3 1.5
Does not speak Kurdish at all 3.3 44.1 98.4
Total 100.0 100.0 100.0
N 1,203 62 6,805
Source: TDHS 2003 data (Please note that respondents are ever married women aged 15-49 in
all tables referring to the TDHS).
More than 3% of children whose both parents speak Kurdish as their main language are reported not to be Kurdish speaking. At the same time, Kurdish speakers are almost non-existent among the children of those who do not speak Kurdish at all. Furthermore, Kurdish is only the second language among about 5% of children whose both parents speak Kurdish as their main language. This figure declines below 2% among the children of persons whose main language is not Kurdish. It appears that some of the children of Kurdish parents have been raised in Turkish or have adopted that language as their main medium of expression at a later time. Education seemingly plays a role in language shift as summarised in Table 2 in
Sinan Zeyneloğlu, Yaprak Civelek,
Ibrahim Sirkeci ISSN 2071-789X
RECENT ISSUES IN SOCIOLOGICAL RESEARCH
Economics & Sociology, Vol. 9, No 1, 2016 143
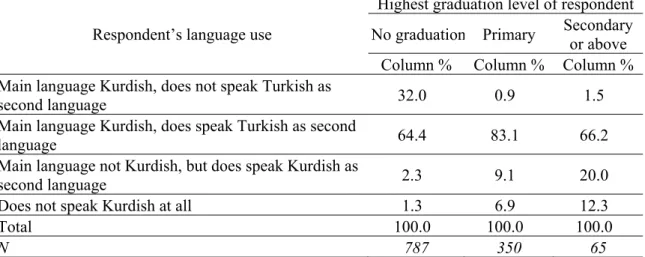
which the cross-tabulation of language and level of education is given only for those respondents whose both parents speak Kurdish as their main language.
Table 2. Educational attainment versus language use (only respondents whose both parents speak Kurdish as mother tongue)
Respondent’s language use
Highest graduation level of respondent No graduation Primary Secondary or above Column % Column % Column % Main language Kurdish, does not speak Turkish as
second language 32.0 0.9 1.5
Main language Kurdish, does speak Turkish as second
language 64.4 83.1 66.2
Main language not Kurdish, but does speak Kurdish as
second language 2.3 9.1 20.0
Does not speak Kurdish at all 1.3 6.9 12.3
Total 100.0 100.0 100.0
N 787 350 65
Source: TDHS 2003 data.
Higher the educational attainment the lower the use of the Kurdish language. Monoglot Kurdish speakers (first category line) are only present in the uneducated group, while monoglot Turkish speakers (last category line) amount to 7% of primary graduates and even surpass 12% in the secondary or above graduation group (including middle school). In all education categories bilinguals (lines 2 and 3) form a clear majority. There appears to be a
strong relationship between going to school and speaking Turkish among Kurds (Smits and
Gündüz-Hoşgör, 2003). Since most Kurds in Turkey are bilingual (Zeyneloğlu et al., 2015; Zeyneloğlu et al., 2014), Turkish may become the main medium of expression during early adulthood of a Kurd in Turkey (especially upon entrance to higher education and/or after intermarriage). Kurdish may drop to second position even if that was the language first learned from parents. Upward social mobility is cited as one of many factors leading to language shift among minorities (Kandler et al., 2010) while Stevens (1985) clearly distinguishes between linguistic homogamy and ethnic endogamy.
The negative association of educational attainment and language retention among Kurds may be a reason why Koç et al. (2008) found strong ‘demographic differentials’ between Turkish and Kurdish speakers. Since the odds of an individual of Kurdish origin stating Turkish as their main language increases with their educational attainment, it is highly probable that Kurds who in terms of demographic indicators are closer to the Turkish population may have been raised in, or later on have shifted to, the Turkish language. In that case, main language, as a marker of ethnicity, will fall short of indicating a possible convergence of Kurds and Turks. Koç et al. (2008) referring to Dündar’s MA Thesis (1998) state that mother tongue/spoken language is only one potential variable… as a proxy for
ethnicity, but in the Turkish context it appears to be quite sufficient, a presumption we laid
bare to be erroneous both theoretically and empirically. Actually Dündar (1998, p. 2) explicitly refrains from equating language to ethnicity, literally stating that mother tongue and
second languages of the respondents ... are not sufficient to identify an individual as belonging to a specific ethnic group. However, Dündar (1998, p. 33) also discloses that for
Sinan Zey Ibrahim S groups’ ...ethnic proxy b based o linking its place and disr analysts extinct j not a pr B in the T the 196 peripher modern proxy o Map 1. (Census 3. Data Birth re A origin’ r 1 Perhaps ranks of K Turkey. yneloğlu, Yapr Sirkeci informatio c backgroun becomes ‘q on a master mother ton e in recent s regarding th s even note
just like Iri rerequisite f By and larg Turkish cont 60s, and pe ral areas of n nation state of ethnicity i Important s, 1965) and metho egion as an As mention referring to s supporting o Kurdish natio rak Civelek, E on on langu nd, because uite sufficie students’ th ngue to ethn studies (Ery he emergen e that the K ish largely h for retention ge, it appear text.1 If the enetration o f the countr es. Therefor in our analy language g ods indicator of ned previous the ‘territor our argument, onalist leaders Economics & uage has b ethnicity is ent’ just be hesis, albeit nicity. It is u yurt and Koç
ce of mono Kurdish lang
has (O'Drisc n of a minor
rs that there ere was such f the nation y since the re, we avoid ysis. groups acco f ethnic orig sly, in this s ry associatio one can note s such as Sela RECEN Sociology, Vo 144 been collect s a ‘sensitiv ecause it st t a very goo unfortunate ç, 2015) bla oglot Turkis guage has r coll, 2014). rity ethnic id e is no bijec h a link in t nal as well 1980s oug d using ana ording to m gin study we us on’ of ethni e that there ar ahattin Demirt NT ISSUES I Vol. 9, No 1, 20 ted during ve issue’. It tands for a od one, who e that this u ankly reject sh speakers reached a c . On the oth dentity (see ctive link b the past, de l as global ht to have e adil (main la main langua se ‘birth reg ie (Smith, 1 re even mono taş, the co-cha
ISS IN SOCIOLO 016 TDHS 199 is difficult t ‘sensitive o herself ab unproven pro
ing the appa among edu critical stage her hand, la Fishman an etween lang ecades of m economy i eroded it sim anguage or m age spoken gion’ as an 986, p. 32). oglot Turkish air of the HDP SN 2071-789X OGICAL RE 93 as a ‘p to apprehen issue’ espe bstains from roposition st arent langu ucated Kurd e and may anguage rete nd Garcia, 2 guage and e mass schooli into even t imilar to mo mother tong other than indicator o . This is app speakers amo P, pro-Kurdis X SEARCH proxy’ of nd how a ecially if m overtly till finds age shift ds. Some become ention is 2010). ethnicity ing since the most ost other gue) as a Turkish f ‘ethnic propriate ong higher sh party in
Sinan Zey Ibrahim S as the K in provi Kars lin lines, th groups a Kirmanc dialects B Turkey sizeable 1996; S armed c large sc 15 years Map 2. interma I Kurdish total of Diyarba languag from Si constitu Bingöl speakers Kurdish ‘predom I during C yneloğlu, Yapr Sirkeci Kurds, as an inces locate ne and east hose as such according to c [Kırmanc as had been By 1965, K with the ex e Kurdish s Sirkeci, 2000 conflict betw cale internal s, though th Regional g arriage (Cen In all censu h speakers ( f 63 at the akır, Mardin ge, forming iirt. Those uted 68% of provinces, s constitute h speakers m minantly Kur In the KSR Census 194 rak Civelek, E autochthon ed in the ea of the Elaz h, are in the o main lang ca], Kirdash n done in the Kurdish sp xception of s speaking po 0). These re ween the PK l displaceme he bulk of th grouping of nsus, 2000) ses in which including al e time) 10 n, Siirt and a unified sp whose main f the popula neighbourin about half o make 92% o rdish speaki R region, pe 45 were alm Economics & ethnic grou astern parts zığ-Urfa line e minority. guages spok h [Kırdaşça e 1945 cens eakers wer small pocke opulation em ecent move KK and the ent of over 9 he Kurdish e f provinces h tabulation ll dialects) c provinces, d Hakkâri pace, which n or second ation in thes ng predomin of the popul of the popul ing region’ r ersons who most exclusiv RECEN Sociology, Vo 145 up within Tu of the coun e. While th Map 1 sho ken as repor a] and Zaza sus booklet ( re mostly c ets in Centr merged in es were part e Turkish ar 900 village ethnie still l used for th n of languag constituted namely A had a majo h the current d language se 10 (later nantly Turk lation. In H ation. These referred to a o had repor vely concen NT ISSUES I Vol. 9, No 1, 20 urkey, have ntry lying so here are Kur ows the dist rted in the 1 a [Zazaca] (SIS, 1950) concentrated ral Anatolia western an tly due to u rmy starting s and 2,000 lives in the he analysis ge is publish the majority Ağrı, Tunce ority of Ku t provinces reported a 12) provinc kish areas t Hakkâri, a pr e 12 provin as ‘KSR’ in rted a main ntrated in u ISS IN SOCIOLO 016 traditionally outh of the rdish popula ribution of 965 Census we have su . d in the ea . Throughou nd southern urbanisation g in 1984. T hamlets in east or has of interregi hed, there we y. In the 19 eli, Bingöl, urdish spea of Batman as Kurdish i ces (SIS, 19 o the north rovince bord ces – out of our analysi n language urban areas SN 2071-789X OGICAL RE ly been conc Erzincan-E ations beyo important l s. Kurdish [ summed as astern prov ut recent de n provinces n coinciding This conflic the followi been born t ional migra ere province 945 census ( Muş, Bitl akers as the and Şırnak in the 1945 950). In Tun h and west, dering Iraq a f 81 – const is (Map 2). other than so that all p X SEARCH centrated Erzurum-ond these language [Kürtçe], Kurdish vinces of ecades, a (Mutlu, g with an ct caused ing 10 to there. ation and es where (out of a lis, Van, eir main seceded 5 census nceli and Kurdish and Iran, titute the Kurdish province
Sinan Zeyneloğlu, Yaprak Civelek,
Ibrahim Sirkeci ISSN 2071-789X
RECENT ISSUES IN SOCIOLOGICAL RESEARCH
Economics & Sociology, Vol. 9, No 1, 2016 146
centres except Hakkari had a majority of Turkish speakers or Arabic in the case of Siirt and Mardin. The rural areas of all mentioned provinces, on the other hand, exhibited a clear Kurdish majority. This urban-rural dichotomy has also been observed in other geographies experiencing language shift such as Ireland in the 19th century (Filppula, 1995) where English got its first foothold in larger towns at a time when major rural areas were still Irish speaking. A significant portion of Turkish speakers in cities were civil servants (according to Census 1945 in which the crosstabulation of main language and occupation is given for each province) who were definitely not expected to be born there as this group resides in the region temporarily. Consequently, we expect that the percentage of Kurdish speakers among persons born in the KSR should exceed the percentage of Kurdish speakers among those who reside there at any time. As a confirmation of this assumption more than 86% of ever married women who have spent most of their 0-12 ages2 in the KSR provinces do speak Kurdish as either main or second language or have parents who do speak Kurdish as their main language according to the 2003 TDHS. Some part of the difference between the TDHS and the census in terms of the share of Kurdish speakers may be due to the occasional practice to record many Kurds as speaking Turkish as main language if they have at least some knowledge of Turkish as mentioned by Mutlu (1996).
3.1. Analysis regions and ‘ethnic’ categories
Marmara is the most industrialised region of Turkey including Istanbul, the largest city and the economic capital of the country, while the Aegean and Mediterranean regions are economically better off than the rest. Central Anatolian region contains the capital Ankara with a limited economic influence zone. The remaining regions are relatively deprived and accommodate many provinces ranked towards the bottom of the socio-economic development levels (Dinçer et al., 2003) and therefore out-migration propensity is higher (Sirkeci et al., 2012). The Black Sea region we have divided in two: the Western Black Sea (WBS) and Eastern Black Sea (EBS). The eastern and southeastern provinces are also separated into the predominantly Kurdish speaking region (KSR) and the rest of Eastern and South Eastern Anatolia (ESA).
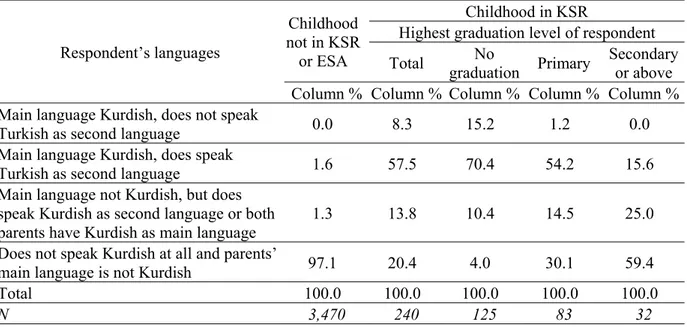
In this study, KSR-born persons are assumed to be of Kurdish origin. We have to note that some portion of ESA-born persons is also of Kurdish origin since ESA is a region where autochthon Kurdish and Turkish populations are intermingled3. As we cannot assume ESA-born persons being either Kurdish or Turkish origin, those born in ESA are left out of the analysis. The practice of leaving out a mixed region in an analysis of intermarriage is common (See Hwang, 1995; Blau et al., 1982). Persons born outside ESA and KSR at ages 25-64 according to census 2000 are assumed to be of non-Kurdish origin in this analysis. This assumption is tested using 2003 TDHS data with a tabulation of language groups in the West and South regions combined according to region of childhood and level of education (Table 3).
Less than 3% of ever-married women living in West and South combined (roughly equal to our Marmara, Aegean and Mediterranean regions) who have not spent their childhood in KSR or ESA provinces do have a connection with the Kurdish language while more than 97% neither speak Kurdish as their main or second language nor have parents speaking Kurdish as their main language. While a large Kurdish population does exist in the western regions it appears that at the beginning of the 21st century most of them still have KSR or ESA as their
2 The individual questionnaire of the TDHS does not include questions on place of birth, however, the longest place of residence before the age of 12 is recorded as such, which we take as more or less equal to birth place. 3 22% of the population living in ESA speaks Kurdish as either main or second language according to Census 1945, while 34% of 15-49 women who have spent most of their 0-12 childhood in the ESA region do so according to the 2003 TDHS.
Sinan Zeyneloğlu, Yaprak Civelek,
Ibrahim Sirkeci ISSN 2071-789X
RECENT ISSUES IN SOCIOLOGICAL RESEARCH
Economics & Sociology, Vol. 9, No 1, 2016 147
birth and/or childhood region. On the other hand, almost 80% of persons living in West and South who spent their childhood in KSR have a connection with the Kurdish language either as main, second or parents’ language. Most of the remaining 20% we also assume of Kurdish origin as supported by the tabulation differentiated according to education. In the less-than-primary category only 4% have no connection to the Kurdish language which roughly corresponds to the Arabic or Syriac speaking KSR population. Among primary school graduates this proportion rises to 30% while almost 60% of KSR-origin residents in western regions with secondary or above graduation (including middle school) have not expressed personal or parental usage of Kurdish. We believe that this is a sign of language shift. Hence, in the 2000 Census data the vast majority of KSR-born persons are of Kurdish origin while residents of western regions not born in ESA or KSR can be assumed as non-Kurdish.
Table 3. Language groups in West and South regions according to region of childhood
Respondent’s languages
Childhood not in KSR or ESA
Childhood in KSR
Highest graduation level of respondent Total No
graduation Primary
Secondary or above Column % Column % Column % Column % Column % Main language Kurdish, does not speak
Turkish as second language 0.0 8.3 15.2 1.2 0.0 Main language Kurdish, does speak
Turkish as second language 1.6 57.5 70.4 54.2 15.6 Main language not Kurdish, but does
speak Kurdish as second language or both parents have Kurdish as main language
1.3 13.8 10.4 14.5 25.0 Does not speak Kurdish at all and parents’
main language is not Kurdish 97.1 20.4 4.0 30.1 59.4
Total 100.0 100.0 100.0 100.0 100.0
N 3,470 240 125 83 32
Source: TDHS 2003 data.
We also have to underline that in the 2003 TDHS data, among residents of the Western and Southern regions who have spent their childhood in KSR, only 32 respondents had completed some secondary level education. Only 23 among those stated to have parents with Kurdish as main language. This makes the TDHS data unsuitable for analysis of intermarriage due to its relatively small sample size which was not designed to capture ethnic variety.
3.2. Data source for migration and intermarriage
The 2000 census data is the latest available in Turkey4. We have obtained detailed commissioned tables from the Turkish Statistics Institute. As we have used the entire Census dataset, all tables sourced from the 2000 census are free of sampling bias.
Since non-married people constitute large portions of those aged younger than 25 and older than 64, we have focused our intermarriage analyses to those aged between 25 and 64.
4 The data of the ‘2011 Housing and Population Survey’, misleadingly presented as a ‘census’, was still not available as of May 2015apart from its published report, while the yearly tabulations from the ‘Address Based Population Registration System’ since 2007 (again misleadingly marketed as a ‘census’) are merely a headcount of population according to place of residence and thus are unsuitable for analysis.
Sinan Zeyneloğlu, Yaprak Civelek,
Ibrahim Sirkeci ISSN 2071-789X
RECENT ISSUES IN SOCIOLOGICAL RESEARCH
Economics & Sociology, Vol. 9, No 1, 2016 148
Also a sizeable portion of those aged 15-24 are counted within the institutional population (such as students in dormitories, recruits of compulsory military service) and these are not necessarily movers to the region where they were present on census day. After excluding persons born abroad and those with unknown birthplaces, the final data we used contains 29,083,058 persons aged 25-64. The analysis of interregional migration is based upon the information of these persons and the married ones form the basis for analysis of intermarriage. The 2000 census data allows matching spouses only if one of them is the household head. However, 79% of domestically born married men aged 25 to 64 are also household heads (10,385,129 persons), thus, we assume, that this group is representative of all married men. In rare cases of households where men have more than one spouse under the same roof, the first in the household list has been selected for analysis. Finally, after excluding couples where their educational attainment data is missing for either partner, we were left with 10,336,082 couples for analysis.
3.3. Measures of interregional migration and intermarriage
We have adopted Newell’s (1989, p. 85) ‘life time migration’ definition to identify persons living outside their birth region. Only those regions where sizeable KSR-born and ‘non-Kurdish’ (that is persons not born in KSR or ESA regions) population groups coexist are considered in the analysis of intermarriage to ensure both groups are exposed to the opportunity of intermarriage.
Intermarriage is presented as percentage of out-marriage successively from the perspective of the minority and the majority, that is KSR-born married household heads or spouses of household heads having a partner not born in KSR or ESA as a proportion of all KSR-born married household heads or their spouses and vice versa in each gender, age group, education, and region of residence category. Percentages of out-marriage are always given in parentheses. To compute levels of in-marriage free of the effect of group size odds-ratios are also presented differentiated according to the educational level of spouses in the corresponding section.
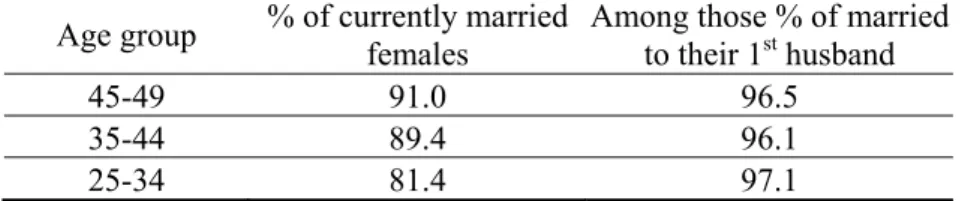
Table 4. Percentage of married women and the share among those still married to their 1st husband
Age group % of currently married females
Among those % of married to their 1st husband
45-49 91.0 96.5
35-44 89.4 96.1
25-34 81.4 97.1
Source: TDHS 2003 household members’ data for first data column, TDHS 2003 ever
married female data for second data column.
Ideally ‘incidence’ measures are preferred over ‘stock’ data which indicates prevalence only at the time of data collection (Kalmijn, 1998). The census data constitutes stock data, however, given the rarity of divorce and remarriage at the time, we can employ age group of married persons as a proxy of marriage cohort, an incidence measure, so that an analysis of trends becomes possible. According to TDHS 2003, 97% of currently married females at ages 25-34 were still with their first husbands. As they reach the ages 45 to 49 this proportion remains at 96% (Table 4). Consequently, taking into account average ages at first marriage in Turkey, we assume that most couples aged 25 to 34 on the census day have
Sinan Zeyneloğlu, Yaprak Civelek,
Ibrahim Sirkeci ISSN 2071-789X
RECENT ISSUES IN SOCIOLOGICAL RESEARCH
Economics & Sociology, Vol. 9, No 1, 2016 149
married during the 1990s, while those couples aged 35 to 44 have married during the 1980s, the couples aged 45 to 54 have married during the 1970s, and finally, those couples aged 55 to 64 have married during the 1960s. Since the age difference between the sexes in marriage is fairly low we use only husband’s age group to define the age of the couple for convenience and simplicity5.
4. General trends of homogamy and in-marriage at the national level
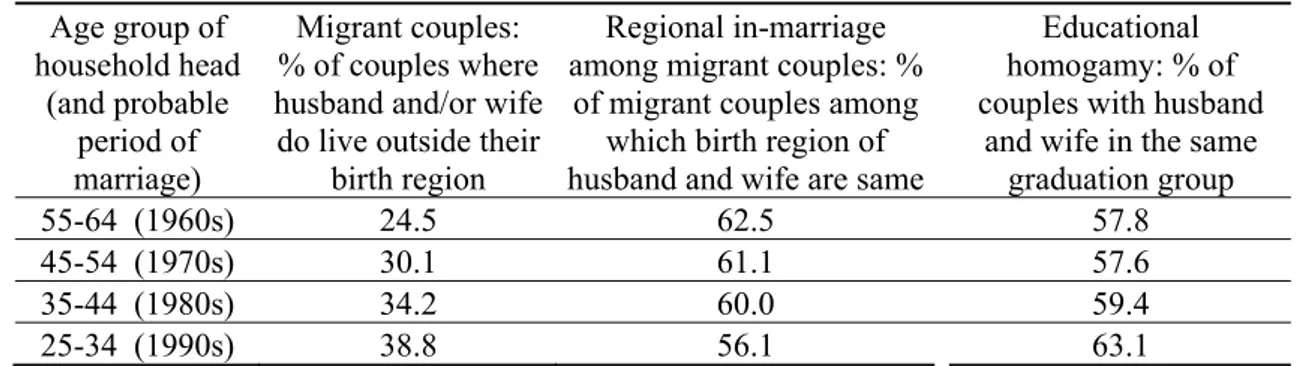
If Turkey has followed the path envisaged by Gordon’s (1964) modernization theory it should have reduced its in-marriage among groups based on ascribed features, while homogamy based on achieved characteristics should have risen. Using census 2000 data, a broad picture is presented in Table 5 utilising birth region as an example of an ascribed attribute while educational attainment is employed as an achieved trait. Regional in-marriage is based on the eight regions described above and educational attainment is measured in three categories: less-than-primary, primary school graduation and secondary school or above. Only for migrant couples, that is for pairs in which at least one partner lives outside his/her birth region, a rate of in-marriage has been computed to equate the opportunity of successive generations for intermarriage regarding differences in the prevalence of interregional migration.
Table 5. Regional in-marriage and educational homogamy a Age group of household head (and probable period of marriage) Migrant couples: % of couples where husband and/or wife do live outside their
birth region
Regional in-marriage among migrant couples: %
of migrant couples among which birth region of husband and wife are same
Educational homogamy: % of couples with husband
and wife in the same graduation group
55-64 (1960s) 24.5 62.5 57.8
45-54 (1970s) 30.1 61.1 57.6
35-44 (1980s) 34.2 60.0 59.4
25-34 (1990s) 38.8 56.1 63.1
a Only couples where husband is household head, excluding foreign-born population
Source: The 2000 Census data.
Interregional migration in Turkey has risen dramatically in the four decades prior to the 2000 census. While among the 55-64 year olds, less than a quarter of couples had either wife and/or husband living outside their birth region, this figure rose to 39% among the 25-34 year olds. Among these migrant couples, ‘regional in-marriage’6 declines over time; from 63% in the 55-64 age group to 56% for the 25-34 year old age group. At the same time, educational homogamy of all couples nationwide increased from 58% among the 55-64 age group to 63% among the 25-34 aged. Although the educational and spatial categories used here are quite broad, the trend is towards increasing homogamy among people with similar educational levels and falling regional in-marriage over the second half of the 20th century, a period characterised by massive uprooting due to rapid urbanisation and mass migration. This is in line with the modernization theory. The central question of this study is whether KSR-born persons (Kurds) who live outside their birth region and also Turks who live in those regions have followed this trait or not.
5 According to TDHS-2003 the median age at first marriage for 25-49 women was 20.0, while their husbands had a median age of 23.7 at marriage. In 1988, the age difference had been estimated as 4.4 (HUIPS, 1989, p. 30). 6 We take regional in-marriage as the percentage of migrant couples with husband and wife having the same birth region (which is, by definition, different from the region of residence) among all migrant couples.
Sinan Zeyneloğlu, Yaprak Civelek,
Ibrahim Sirkeci ISSN 2071-789X
RECENT ISSUES IN SOCIOLOGICAL RESEARCH
Economics & Sociology, Vol. 9, No 1, 2016 150
5. Interregional migration
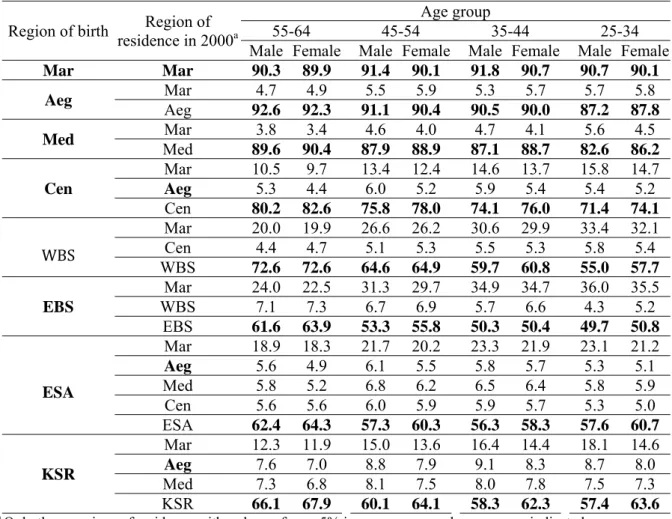
Established migrant receiving regions seemingly retain their native born population as out-migration rates are very low (Table 6). For example, 90% of the population in all analysed cohorts and for both sexes born in Marmara region continues to live there. The corresponding figures for Aegean and Mediterranean regions are about 90%. In Central Anatolia, it goes down to 80% among the 55-64 age group, while more than a quarter of both sexes aged 25 to 34 has out-migrated. Among persons born in the WBS, only 73% of the 55-64 old have remained. Out-migration increases for younger age groups in the WBS as only 55% of men and 58% of women aged 25 to 34 have remained in their birth region. The figures for persons born in EBS are similar to their western neighbour although the level of out-migration is more severe in that only half of the 25-34 age group has remained in that region. Also for ESA the percentage of those remaining in their birth region is below two thirds for all age groups and each gender. The percentage of KSR-born population still living in their birth region ranges from 57% to 68% depending on age and sex. This means two thirds of the population of Kurdish origin continues to live in their traditional geography, while one third is living in the rest of the country as a result of internal migration over decades also confirmed by Mutlu’s analysis (1996).
Table 6. Distribution of population born in regions according to region of residence and age groups (column % within each region of birth)
Region of birth residence in 2000Region of a
Age group
55-64 45-54 35-44 25-34
Male Female Male Female Male Female Male Female
Mar Mar 90.3 89.9 91.4 90.1 91.8 90.7 90.7 90.1
Aeg Mar 4.7 4.9 5.5 5.9 5.3 5.7 5.7 5.8
Aeg 92.6 92.3 91.1 90.4 90.5 90.0 87.2 87.8
Med Med Mar 3.8 3.4 4.6 4.0 4.7 4.1 5.6 4.5 89.6 90.4 87.9 88.9 87.1 88.7 82.6 86.2 Cen Mar 10.5 9.7 13.4 12.4 14.6 13.7 15.8 14.7 Aeg 5.3 4.4 6.0 5.2 5.9 5.4 5.4 5.2 Cen 80.2 82.6 75.8 78.0 74.1 76.0 71.4 74.1 WBS Mar 20.0 19.9 26.6 26.2 30.6 29.9 33.4 32.1 Cen 4.4 4.7 5.1 5.3 5.5 5.3 5.8 5.4 WBS 72.6 72.6 64.6 64.9 59.7 60.8 55.0 57.7 EBS Mar 24.0 22.5 31.3 29.7 34.9 34.7 36.0 35.5 WBS 7.1 7.3 6.7 6.9 5.7 6.6 4.3 5.2 EBS 61.6 63.9 53.3 55.8 50.3 50.4 49.7 50.8 ESA Mar 18.9 18.3 21.7 20.2 23.3 21.9 23.1 21.2 Aeg 5.6 4.9 6.1 5.5 5.8 5.7 5.3 5.1 Med 5.8 5.2 6.8 6.2 6.5 6.4 5.8 5.9 Cen 5.6 5.6 6.0 5.9 5.9 5.7 5.3 5.0 ESA 62.4 64.3 57.3 60.3 56.3 58.3 57.6 60.7 KSR Mar 12.3 11.9 15.0 13.6 16.4 14.4 18.1 14.6 Aeg 7.6 7.0 8.8 7.9 9.1 8.3 8.7 8.0 Med 7.3 6.8 8.1 7.5 8.0 7.8 7.5 7.3 KSR 66.1 67.9 60.1 64.1 58.3 62.3 57.4 63.6
a Only those regions of residence with a share of over 5% in any age or gender group are indicated.
Sinan Zeyneloğlu, Yaprak Civelek,
Ibrahim Sirkeci ISSN 2071-789X
RECENT ISSUES IN SOCIOLOGICAL RESEARCH
Economics & Sociology, Vol. 9, No 1, 2016 151
The out-migrating populations from ESA and KSR are dispersed to several regions compared to those from Black Sea regions, who almost exclusively went to Marmara region. While 18% of males and 15% of females at ages 25-34 born in KSR live in Marmara region, 9% of males and 8% of females do so in the Aegean. Furthermore, 8% of KSR-born males and 7% of females in the same age group live in the Mediterranean.
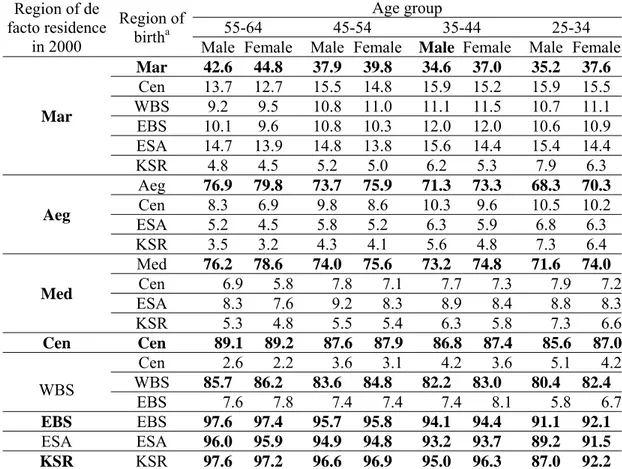
Table 7 summarises the distribution of population by region of residence and region of
birth. In other words, it shows the origins of the population in each region. Marmara region, as the economic centre of Turkey, has the most diversified population with 8% of men and 6% of women aged 25-34 born in KSR. In the Aegean, 7% of men and 6% of women among the 25-34 aged were born in KSR while in the Mediterranean the share of KSR-born persons in the 25-34 population is 7% for both men and women. We found very few KSR-born persons in Central Anatolia and the Black Sea regions.
It appears that KSR and ESA as well as EBS are the least desirable destinations for movers in Turkey. An interesting difference between age groups in KSR is that while in the groups above age 35 more than 95% of the population has been born in KSR, among men aged 25-34 this percentage drops to 87% but is 92% among women in the same age group. This might be a result of large numbers of government officials and troops stationed in the region fulfilling their compulsory service. They are not only temporarily residing in the region but also live in isolation in governmental and military accommodation. This offers very limited opportunity to interact and marry with the native born population in the KSR.
Table 7. Distribution of population living in regions according to region of birth and age groups (column % within each region of residence)
Region of de facto residence in 2000 Region of birtha Age group 55-64 45-54 35-44 25-34
Male Female Male Female Male Female Male Female
Mar Mar 42.6 44.8 37.9 39.8 34.6 37.0 35.2 37.6 Cen 13.7 12.7 15.5 14.8 15.9 15.2 15.9 15.5 WBS 9.2 9.5 10.8 11.0 11.1 11.5 10.7 11.1 EBS 10.1 9.6 10.8 10.3 12.0 12.0 10.6 10.9 ESA 14.7 13.9 14.8 13.8 15.6 14.4 15.4 14.4 KSR 4.8 4.5 5.2 5.0 6.2 5.3 7.9 6.3 Aeg Aeg 76.9 79.8 73.7 75.9 71.3 73.3 68.3 70.3 Cen 8.3 6.9 9.8 8.6 10.3 9.6 10.5 10.2 ESA 5.2 4.5 5.8 5.2 6.3 5.9 6.8 6.3 KSR 3.5 3.2 4.3 4.1 5.6 4.8 7.3 6.4 Med Med 76.2 78.6 74.0 75.6 73.2 74.8 71.6 74.0 Cen 6.9 5.8 7.8 7.1 7.7 7.3 7.9 7.2 ESA 8.3 7.6 9.2 8.3 8.9 8.4 8.8 8.3 KSR 5.3 4.8 5.5 5.4 6.3 5.8 7.3 6.6 Cen Cen 89.1 89.2 87.6 87.9 86.8 87.4 85.6 87.0 WBS Cen 2.6 2.2 3.6 3.1 4.2 3.6 5.1 4.2 WBS 85.7 86.2 83.6 84.8 82.2 83.0 80.4 82.4 EBS 7.6 7.8 7.4 7.4 7.4 8.1 5.8 6.7 EBS EBS 97.6 97.4 95.7 95.8 94.1 94.4 91.1 92.1 ESA ESA 96.0 95.9 94.9 94.8 93.2 93.7 89.2 91.5 KSR KSR 97.6 97.2 96.6 96.9 95.0 96.3 87.0 92.2
a Only those regions of birth with a share of over 5% in any age or gender group are indicated
Sinan Zeyneloğlu, Yaprak Civelek,
Ibrahim Sirkeci ISSN 2071-789X
RECENT ISSUES IN SOCIOLOGICAL RESEARCH
Economics & Sociology, Vol. 9, No 1, 2016 152
In summary, two large interregional migration flows are observed in Turkey: a) moves from EBS to Marmara (with WBS as both sender and receiver in between), and b) moves from ESA and KSR to the Mediterranean, Aegean and Marmara regions (Map 2). The three regions which have significant populations of Kurdish origin besides having Turkish majorities, namely Marmara, Aegean and the Mediterranean, are the focus of our analysis of intermarriage patterns presented in the following section.
6. Intermarriage between Kurds and non-Kurds and the effect of education
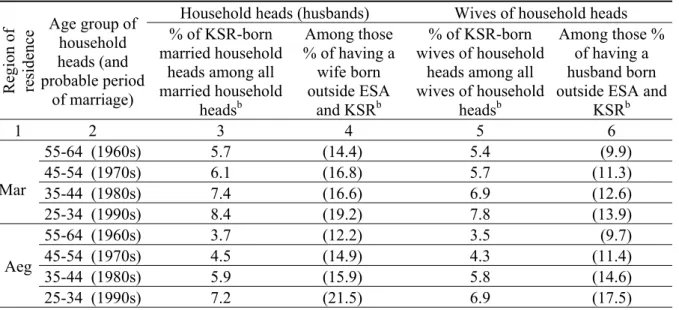
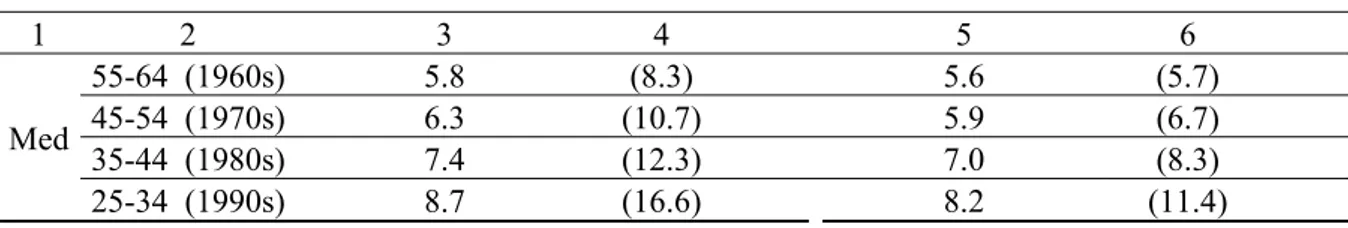
The prevalence of intermarriage of KSR-born persons (only household heads and their wives) to partners born outside ESA and KSR varies by region of residence and age group (Table 8). In each region and for each sex, the propensity of intermarriage increases in younger age groups. The gender gap seems stable across all regions and age groups, as KSR-born men intermarry more often than KSR-KSR-born women.
When educational attainment is factored in, a different picture emerges (Table 9). First, the gap between education categories is consistently much larger than the differences between gender, age groups, and regions observed among persons within the same educational attainment level. Second, in almost all educational attainment levels, KSR-born women out-marry more than their male counterparts at the same educational attainment level. For those who are illiterate or drop-outs from primary school (the ‘no graduation’ group), figures are rather close. However, for the remaining, it is clear that higher the educational attainment the more frequent is intermarriage among KSR-born women, compared to men, across all ages and regions. At the lower-than-primary education level the proportion of out-married KSR-born persons, both for men and women, ranges between 3% and 9% across age groups. At the primary school level the figures for men vary between 9% and 16% while among the women they range from 9% to 18%. Finally, at the secondary or above education category the percentages of out-marriage among KSR-born men fluctuate between 25% and 38% whereas for women the figures are in the range of 35% to 46%. Overall, across the regions, prevalence of out-marriage among both men and women in any age group is lower among the least educated. There are also very clear differences between those with primary education and those who attended secondary school or above in each region, gender and age group.
Table 8. Prevalence of intermarriage of KSR-born persons living outside their birth region with partners born outside ESA and KSRa
Region of residence Age group of household heads (and probable period of marriage)
Household heads (husbands) Wives of household heads % of KSR-born
married household heads among all married household headsb Among those % of having a wife born outside ESA and KSRb % of KSR-born wives of household
heads among all wives of household
headsb
Among those % of having a husband born outside ESA and
KSRb 1 2 3 4 5 6 Mar 55-64 (1960s) 5.7 (14.4) 5.4 (9.9) 45-54 (1970s) 6.1 (16.8) 5.7 (11.3) 35-44 (1980s) 7.4 (16.6) 6.9 (12.6) 25-34 (1990s) 8.4 (19.2) 7.8 (13.9) Aeg 55-64 (1960s) 3.7 (12.2) 3.5 (9.7) 45-54 (1970s) 4.5 (14.9) 4.3 (11.4) 35-44 (1980s) 5.9 (15.9) 5.8 (14.6) 25-34 (1990s) 7.2 (21.5) 6.9 (17.5)
Sinan Zeyneloğlu, Yaprak Civelek,
Ibrahim Sirkeci ISSN 2071-789X
RECENT ISSUES IN SOCIOLOGICAL RESEARCH
Economics & Sociology, Vol. 9, No 1, 2016 153 1 2 3 4 5 6 Med 55-64 (1960s) 5.8 (8.3) 5.6 (5.7) 45-54 (1970s) 6.3 (10.7) 5.9 (6.7) 35-44 (1980s) 7.4 (12.3) 7.0 (8.3) 25-34 (1990s) 8.7 (16.6) 8.2 (11.4) a Only household heads and their wives
b Excluding ESA-born spouses in totals
Source: Census 2000 data.
Table 9. Prevalence of intermarriage of KSR-born persons living outside their birth region with partners born outside ESA and KSR according to graduation group of spousesa
Region of residence Age group of household heads (and probable period of marriage)
% of KSR-born husbands married to a wife born outside ESA and KSRb
according to husband’s level of education
% of KSR-born wives having a husband born outside ESA and KSRb
according to wife’s level of education No graduation Primary Secondary or above No graduation Primary Secondary or above Mar 55-64 (1960s) (3.1) (9.9) (37.0) (4.2) (13.3) (41.2) 45-54 (1970s) (2.8) (9.8) (30.1) (4.1) (12.1) (36.9) 35-44 (1980s) (3.3) (9.6) (30.1) (4.0) (12.7) (37.3) 25-34 (1990s) (5.6) (12.9) (32.7) (4.3) (12.9) (38.1) Aeg 55-64 (1960s) (3.0) (9.6) (34.7) (5.2) (14.1) (43.8) 45-54 (1970s) (2.7) (10.3) (30.8) (5.7) (13.2) (36.3) 35-44 (1980s) (4.2) (10.1) (31.1) (7.9) (16.1) (40.1) 25-34 (1990s) (9.2) (16.3) (37.8) (8.5) (17.8) (45.5) Med 55-64 (1960s) (3.4) (9.0) (26.7) (2.8) (12.7) (40.6) 45-54 (1970s) (3.1) (8.5) (27.2) (3.0) (9.3) (35.0) 35-44 (1980s) (5.1) (9.2) (25.3) (3.5) (11.4) (35.4) 25-34 (1990s) (7.5) (13.7) (30.9) (5.8) (12.8) (40.2) a Only household heads and their wives
b Excluding ESA-born spouses in totals
Source: Census 2000 data.
In other words, when tabulated according to educational attainment, gender and age regional differences in intermarriage are small. Nevertheless, the Aegean region has relatively higher out-marriage proportions in all educational categories among women, and in the primary and secondary categories among men. The Aegean region, known as the most liberal part of Turkey along with a rich history of migration, seems to comfort Kurds to intermarry more compared to other regions.
Another minor variation is the slightly higher prevalence of intermarriage in the 1990s compared to the 1980s (see age groups 35-44 and 25-34) observed in every education category for both gender and in all regions. In that respect, we have to note that the children of the first wave of KSR-born migrants from the late 1960s and 1970s will be among the non-KSR-born 25-34 age group in 2000, so that some portion of 25-34 aged non-non-KSR-born persons are actually of Kurdish origin. Therefore, our results need to be cautioned as a small portion of partners of intermarried KSR-born might be children of past migrants from KSR. Nevertheless, with the exception of 25-34 age group, similar intermarriage percentages are observed in each education category over time (i.e. across cohorts). As the educational attainment levels among Kurdish migrants rise, the aggregate level of intermarriage increases. In that vein, the gender differences in intermarriage appear to be a result of the difference in
Sinan Zeyneloğlu, Yaprak Civelek,
Ibrahim Sirkeci ISSN 2071-789X
RECENT ISSUES IN SOCIOLOGICAL RESEARCH
Economics & Sociology, Vol. 9, No 1, 2016 154
educational attainment levels between men and women, so that the distribution across education categories deserves separate illustration (Table 10).
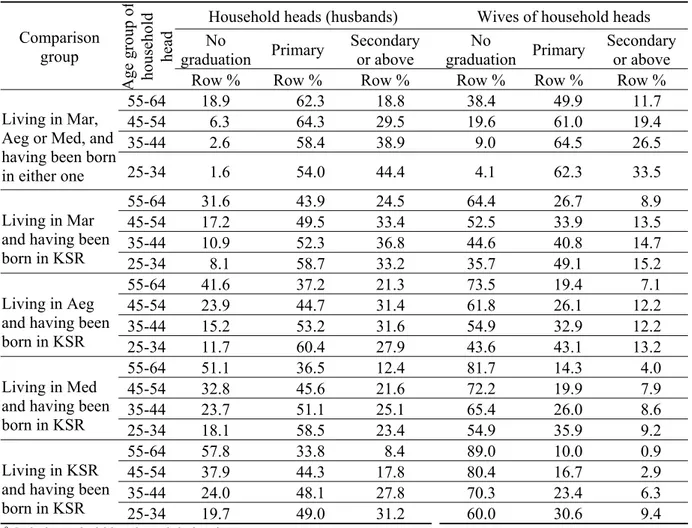
Table 10. Educational attainment of men and women a according to local versus migrant groups Comparison group A ge group of household head
Household heads (husbands) Wives of household heads No graduation Primary Secondary or above No graduation Primary Secondary or above Row % Row % Row % Row % Row % Row % Living in Mar,
Aeg or Med, and having been born in either one 55-64 18.9 62.3 18.8 38.4 49.9 11.7 45-54 6.3 64.3 29.5 19.6 61.0 19.4 35-44 2.6 58.4 38.9 9.0 64.5 26.5 25-34 1.6 54.0 44.4 4.1 62.3 33.5 Living in Mar and having been born in KSR 55-64 31.6 43.9 24.5 64.4 26.7 8.9 45-54 17.2 49.5 33.4 52.5 33.9 13.5 35-44 10.9 52.3 36.8 44.6 40.8 14.7 25-34 8.1 58.7 33.2 35.7 49.1 15.2 Living in Aeg
and having been born in KSR 55-64 41.6 37.2 21.3 73.5 19.4 7.1 45-54 23.9 44.7 31.4 61.8 26.1 12.2 35-44 15.2 53.2 31.6 54.9 32.9 12.2 25-34 11.7 60.4 27.9 43.6 43.1 13.2 Living in Med
and having been born in KSR 55-64 51.1 36.5 12.4 81.7 14.3 4.0 45-54 32.8 45.6 21.6 72.2 19.9 7.9 35-44 23.7 51.1 25.1 65.4 26.0 8.6 25-34 18.1 58.5 23.4 54.9 35.9 9.2 Living in KSR
and having been born in KSR
55-64 57.8 33.8 8.4 89.0 10.0 0.9 45-54 37.9 44.3 17.8 80.4 16.7 2.9 35-44 24.0 48.1 27.8 70.3 23.4 6.3 25-34 19.7 49.0 31.2 60.0 30.6 9.4 a Only household heads and their wives
Source: Census 2000 data.
Among the local population of the three western regions of interest (Marmara, Aegean, and Mediterranean) the percentage of non-graduates has fallen to trivial levels for both sexes in the 25-34 age group while the proportion of graduates of secondary or above level has risen to 44% for males and 34% for females at the same age group. At the other end of the spectrum, in the KSR, although the level of illiteracy is traditionally high, there is clear evidence of increasing educational attainment. Percentage of non-graduate males has decreased from almost 58% in the 55-64 age group to 20% in the 25-34 group. For women in the KSR, the corresponding figures are 89% and 60% respectively. Even in the youngest age group (25-34), the share of women with secondary education and/or above comprises less than 10% whereas this figure is 31% for men.
The situation of migrant Kurds is somewhat in between the ones who stayed behind in the KSR and that of the locals of the host regions, especially among females which is expected as mentioned by Lee (1966, p. 57). If we look at the proportion of secondary school or higher graduates, a consistent ranking of the three host regions can be observed. Without exception, the KSR-born in the Marmara region have higher percentages of secondary or above graduates in comparison to the corresponding age groups in other regions. Also without
Sinan Zeyneloğlu, Yaprak Civelek,
Ibrahim Sirkeci ISSN 2071-789X
RECENT ISSUES IN SOCIOLOGICAL RESEARCH
Economics & Sociology, Vol. 9, No 1, 2016 155
exception, migrant Kurds in the Mediterranean region have lower percentages of secondary or above graduates compared with the corresponding age groups in other regions. Kurds in the Aegean rank in between Marmara and Mediterranean. A reverse regional ranking is valid for percentages of non-graduates. The Mediterranean region is the nearest one to KSR and provides employment opportunities for unskilled workers in agriculture, construction, tourism and services, apart from its pleasant climate and cheap living costs. The Marmara region, on the other hand, requires skilled labour for its heavy industries and advanced level services apart from being the most distant to the KSR and its higher living costs.
Interestingly, older migrant Kurdish men in both Marmara and the Aegean have higher levels of secondary or above education than the local male residents of the host regions. For instance, 25% of KSR-born men aged 55 to 64 in Marmara region are at secondary or above education level (21% in the Aegean) whereas only 19% of local men at the same age group are. However, in the younger age groups the situation reverses so that Kurdish males at the 25-34 age group in all three regions have lower levels of secondary or above graduation compared to local residents. Furthermore, the proportion of secondary or above graduates among 25-34 aged Kurdish males appears to have decreased in all host regions compared to the 35-44 age group. This decrease may be due to the influx of internally displaced persons in the early 1990s which had posed a challenge for both the social services in these host regions as well as for the ‘migrants’ themselves. In similar fashion, a deceleration of the spread of secondary graduation can be observed among local males in the KSR region. While for 45-54 males in the KSR the proportion of secondary or above graduates had risen to 18% compared to 8% among the 55-64 olds, and further to 28% in the 25-44 age group, for the 25-34 aged it was only measured as 31%. Though this figure is higher compared to migrant Kurds of the same ages, the slowing-down of the increase of secondary education leads us to suspect that at the group level Kurds (or at least a large portion of them) are diverging from the rest of Turkey while this has not inhibited intermarriage as a form of attachment at the individual level.
The above given picture of distribution across education categories has to be kept in mind for proper evaluation of intermarriage of the majority members to the minority. Prevalence of intermarriage of persons born outside ESA and KSR (non-Kurds) to persons born in the KSR (Kurds) is presented in Table 11. As expected the percentages are much lower than those computed for the minority7, however, important regularities can still be observed. The gender differences are similar between Turks and Kurds. With the exception of primary school graduates aged 35 to 44 in the Aegean region, in all other regions and age groups females with primary or above levels of education have higher propensities of intermarriage compared to males. On the other hand, again similar to Kurds, among the least educated Turks, females are less inclined to intermarry than males in the same education category. With only two exceptions in the Mediterranean region (age groups 55-64 and 25-34), the percentages of intermarriage among the least educated is higher for males than females in all other regions and age groups.
7 For instance, if a minority has a 10% share among the total population and 10% of that minority is intermarrying then slightly more than 1% of the majority (comprising 90% of the population) will have intermarried.
Sinan Zeyneloğlu, Yaprak Civelek,
Ibrahim Sirkeci ISSN 2071-789X
RECENT ISSUES IN SOCIOLOGICAL RESEARCH
Economics & Sociology, Vol. 9, No 1, 2016 156
Table 11. Prevalence of intermarriage of non KSR and ESA-born persons with partners born in KSR according to graduation group of spousesa
Region of residence Age group of household heads (and probable period of marriage)
% of non KSR and ESA-born husbands married to a wife born in KSRb according to husband’s level of
education
% of non KSR and ESA-born wives having a husband born in KSRb
according to wife’s level of education No graduation Primary Secondary or above No graduation Primary Secondary or above Mar 55-64 (1960s) (0.4) (0.4) (1.0) (0.3) (0.7) (2.5) 45-54 (1970s) (0.6) (0.5) (1.0) (0.3) (0.7) (2.7) 35-44 (1980s) (1.1) (0.7) (1.2) (0.5) (0.8) (2.6) 25-34 (1990s) (1.6) (1.1) (1.3) (1.5) (1.3) (2.5) Aeg 55-64 (1960s) (0.3) (0.2) (0.8) (0.2) (0.4) (1.9) 45-54 (1970s) (0.7) (0.3) (0.8) (0.3) (0.5) (1.9) 35-44 (1980s) (1.7) (0.7) (1.0) (0.8) (0.6) (2.0) 25-34 (1990s) (2.9) (1.2) (1.3) (2.7) (1.2) (2.5) Med 55-64 (1960s) (0.3) (0.2) (0.7) (0.4) (0.5) (1.5) 45-54 (1970s) (0.6) (0.3) (0.7) (0.5) (0.5) (1.6) 35-44 (1980s) (1.3) (0.4) (0.8) (1.2) (0.7) (1.5) 25-34 (1990s) (3.5) (0.9) (1.1) (3.9) (1.2) (1.8)
a Only household heads and their wives b Excluding ESA-born spouses in totals
Source: Census 2000 data.
Comparable to Kurds, graduates of secondary or higher schools are more inclined to intermarry than primary school graduates in each region, age group and gender. Excluding the 25-34 age group for the time being, less than 1% of primary school graduate Turkish males as well as females have intermarried to KSR-born partners while in the secondary or above category around 1% of males and up to almost 3% of females have done so. In the Marmara region more than 2.5% of females at the secondary or above category have intermarried, in the Aegean the mentioned propensity is observed around 2% and in the Mediterranean around 1.5%. The mentioned ranking of regions is also valid among males though the differences in percentage points are less articulate. Thus, for Turks, intermarriage is lowest in the Mediterranean as it is for Kurds, while Marmara ranks highest among Turks though Aegean was the champion of intermarriage among Kurds.
The most striking finding, however, is the considerable variation of intermarriage propensities within the less-than-primary education category. For the 55-64 as well as the 45-54 age groups the percentages of intermarriage to Kurds are lower than the corresponding figures in the secondary or above category without exception and for females also lower than the figures among the primary school graduates. This ranking was also observed among Kurds and is in accordance with our hypothesis in line with modernization theory. Starting with the 34-45 age group this relationship gets distorted and in the 25-34 age group (with the sole exception of the females in Marmara) non-graduates have higher propensities of intermarriage compared to both primary as well as secondary graduation groups. Another reversal changes the regional ranking: Within the 25-34 age group, the non-graduates exhibit the highest proportions of intermarriage in the Mediterranean and lowest in Marmara for both males and females. At first glance, these results are confusing and insinuate dynamics of exchange theory. This perception, however, would be a misapprehension and can be clarified considering the relative sizes of each educational category among Turks within each age group. As has been revealed in Table 10 among older ages (both males and females) a
Sinan Zeyneloğlu, Yaprak Civelek,
Ibrahim Sirkeci ISSN 2071-789X
RECENT ISSUES IN SOCIOLOGICAL RESEARCH
Economics & Sociology, Vol. 9, No 1, 2016 157
sizeable share of locals (Turks) as well as migrant and non-migrant Kurds has no educational degree at all. Among the younger age groups, on the other hand, the ‘no graduation’ group shrinks to trivial levels within the local (Turkish) group for both males and females while among Kurds a considerable group has no graduation even in the 25-34 age group. Among the local population of the western regions the proportion of non graduates in the 25-34 age group vary across the three regions between 1.2% to 1.9% for males and between 3.9% to 6.2% for females (not shown separately in Table 10). In both the 25-34 and the 35-44 age group well above 90% of Turks are graduates of primary school or above. In other words, for the vast majority of Turkish males and females in the younger age groups intermarriage increases with education as secondary or above graduates exhibit higher proportions of intermarriage than primary graduates. The small group of non-graduates within younger age groups do not alter the general picture, moreover, as it has been disclosed before, it is probable that the children of the first wave of KSR-born migrants from the late 1960s and 1970s will be among the non-KSR-born 25-34 age group in 2000, so that a small portion of 25-34 aged non-non-KSR-born persons are actually of Kurdish origin. This presumption is supported by the increase of intermarriage from the 1980s to the 1990s in all regions and both gender also observed among Kurds (Table 9). But even this blurring of ‘ethnic’ categories in the 25-34 age group does not alter the similarity of the intermarriage patterns of both ethnicities: In both groups better educated females out-marry more than males while only in the ‘no graduation’ group females out-marry less than males. Furthermore, with the exception of the trivial group of younger Turks without graduation, intermarriage increases with education for both males and females among the two ethnic groups as envisaged by modernization theory.
Previously, Gündüz-Hoşgör and Smits (2002) using TDHS data had concluded that the Kurdish-Turkish intermarriage pattern conforms to exchange theory in that the propensity of Turks intermarrying to Kurds decreases with education while for Kurds it is in the opposite direction. This finding is probably due to the absence of Kurds at secondary or above graduation level within the TDHS data caused by language shift occurring especially in cases of participation in higher education and/or intermarriage. Apart from that, the extremely rare cases of Turks in the less-than-primary category might also have obscured their analysis. We strongly believe that unless ethnic identity and/or ethnic origin are openly asked for in the TDHS, its data is not suitable for the analysis of intermarriage. While the categorization based on birth region presented in this paper definitely has its shortcomings, we have attempted to disclose these and to point out cases where this distinction appears problematic.
Until this point we have presented percentages of intermarriage of Kurds and Turks separately. Nevertheless, proportions of intermarriage of the minority or the majority group to each other are strongly affected by group size (Kalmijn, 1998; Smits, 2010), thus, odds ratios, as a measure independent of group size, have been computed as well (Table 12). Odds ratios reflect the odds of in-marriage divided by the odds of out-marriage (inter-marriage) across groups. The higher the incidence of Turkish-Turkish or Kurdish-Kurdish marriages relative to Kurdish-Turkish or Turkish-Kurdish marriages, the higher the ratio will be. In other words, the lower the odds ratio the higher the prevalence of intermarriage is.
We have computed odds ratios for all regions and age groups, but also separately for couples in which one spouse is in a particular education category. In all regions odds ratios drop from older to younger ages indicating increase in intermarriage over time. Moreover, with the minor exception of the 25-34 age group in the Aegean, the Mediterranean region has the highest odds ratios while Marmara exhibits the lowest ones. In other words, Marmara as the most central and cosmopolitan region has the highest levels of intermarriage while the Mediterranean which developed relatively late and is characterised by Yörük8 culture has the
Sinan Zeyneloğlu, Yaprak Civelek,
Ibrahim Sirkeci ISSN 2071-789X
RECENT ISSUES IN SOCIOLOGICAL RESEARCH
Economics & Sociology, Vol. 9, No 1, 2016 158
lowest. The most striking differences, however, are between education categories within each region, age group and gender. Without exception the odds ratios for in-marriage are lower for couples in which either husband or wife is in the secondary or above graduation category compared to couples in which either husband or wife are at the primary or less-than-primary level. In almost all cases the odds ratios in the primary category are also much lower than the figures of the less-than-primary group with the exception of the 25-34 age group in the Mediterranean for both gender together with the 35-44 Mediterranean males and the 25-34 Aegean males. The reason of this reversal is probably related to the increased existence of local-born ‘Kurds’ in the younger age groups as has been elaborated previously.
Table 12. Odd ratios of in-marriage relative to out-marriage according to graduation group of husband and wifea
Region of residence Age group of household heads (and probable period of marriage) All couples
Only couples with husband at the mentioned education level
Only couples with wife at the mentioned education level No graduation Primary Secondary or above No graduation Primary Secondary or above Mar 55-64 (1960s) 1085 8746 2324 166 9010 972 55 45-54 (1970s) 752 5501 2005 183 7251 1039 61 35-44 (1980s) 553 2514 1311 197 4346 819 64 25-34 (1990s) 366 1016 634 161 1460 521 63 Aeg 55-64 (1960s) 2127 11599 4211 232 11026 1640 67 45-54 (1970s) 1171 4941 2769 267 5655 1432 92 35-44 (1980s) 611 1294 1185 220 1418 840 73 25-34 (1990s) 291 328 429 128 393 386 47 Med 55-64 (1960s) 3298 9478 4579 367 9767 1515 96 45-54 (1970s) 1962 5230 4108 386 6715 1891 113 35-44 (1980s) 1147 1386 2204 357 2153 1157 117 25-34 (1990s) 491 344 723 200 404 561 79 a Only household heads and their wives
Source: Census 2000 data.
The gender difference observed among percentages is also valid for odds ratios: For couples in which the female has primary or secondary graduation the odds of in-marriage relative to out-marriage is lower than for couples where the male is at the corresponding levels without exception. On the other hand, with the minor exception of the 55-64 age group in the Aegean, the odds ratios for couples where the females have no graduation are higher than for couples where the male is in that category. By and large, the general picture assessed through proportions of out-marriage is confirmed by odds ratios in that intermarriage increases with education as expected due to reciprocal universalism among Kurds and Turks alike in conjunction with modernization theory.
Conclusion
In this study, we have explored the spatial and consanguinal boundaries between Kurds and Turks in Turkey through the analysis of interregional migration and intermarriage. We have also shown that in a universalistic environment, these boundaries are lowered over time especially by increasing levels of educational attainment across the two major ethnic groups.