DOI 10.1007/s00296-016-3485-4
Rheumatology
INTERNATIONALVALIDATION STUDIES
Evidence for reliability, validity and responsiveness of Turkish
Foot and Ankle Ability Measure (FAAM)
Derya Çelik1 · Melih Malkoç2 · RobRoy Martin3
Received: 26 December 2015 / Accepted: 21 April 2016 / Published online: 2 May 2016 © Springer-Verlag Berlin Heidelberg 2016
P = 0.001) of the SF-36. The weakest associations were found between the FAAM-T ADL, FAAM-T Sport sub-scales and the SF-36 the vitality (r = 0.27, P = 0.008 and
r = 0.28, P = 0.01, respectively).
Conclusions The study provides preliminary evidence that the FAAM-T is reliable, valid and responsive outcome measurement of patients with foot and ankle pathologies.
Keywords Cross-cultural adaptation · Ankle and foot ·
Outcome measurement · Psychometric properties
Introduction
Self-reported outcome instruments have been used by clini-cians and by researchers to assess the effect of treatment interventions directed at individuals with foot- and ankle-related pathologies and following impairments. If treat-ment outcomes are to be appropriately measured, clini-cians and researchers need to select a suitable instrument and properly interpret the obtained scores [1]. Many self-reported outcome instruments have been developed for the assessment of foot and ankle pathologies such as Foot and Ankle Ability Measure (FAAM), Foot and Ankle Disability Index (FADI), Foot Function Index (FFI), Foot Health Sta-tus Questionnaire (FHSQ) and Lower Extremity Function Scale (LEFS) [2–6]. Of these, the FAAM was developed as a self-reported instrument to comprehensively assess physi-cal performance among individuals with a range of leg, foot and ankle musculoskeletal disorders [6].
Before using a self-reported outcome instrument in a society other than that in which the outcome measure was developed, it should be translated and culturally adapted. Additionally, the psychometric properties of the translated version of the self-reported outcome instrument need to be
Abstract
Purpose To translate and culturally adapt the Foot and Ankle Ability Measure (FAAM) into Turkish and assess the psychometric properties of the translated version.
Methods The FAAM was translated into Turkish accord-ing to Beaton’s recommendations and it is called FAAM-T. Ninety-eight patients (39 males, mean ± SD age 35.0 ± 14.0 years; range 16–71 years) with different foot and ankle complaints were included, and the score was completed twice by each participant after 7 days of the first assessment to assess test–retest reliability based on the inter-rater correlation coefficient, whereas Cronbach’s alpha evaluated internal consistency. External validity was evaluated with correlations between the FAAM-T, Foot Function Index (FFI) and Short Form-36 (SF-36). The dis-tribution of floor and ceiling effects was determined.
Results The test–retest reliability was 0.90 for both FAAM-T subscales. Cronbach’s alpha coefficient was 0.95 and 0.91 for FAAM-T activity of daily living (ADL) and FAAM-T Sport subscales, respectively. The FAAM-T ADL and Sport subscales demonstrated very good correlation with the FFI (r = 0.70 and 0.63, respectively). The FAAM-T ADL and Sport subscales had a high level of association with physical functioning and the physical component scale (r = 0.71, r = 0.70 and r = 0.51, r = 0.55, respectively;
* Derya Çelik [email protected]
1 Division of Physiotherapy and Rehabilitation, Faculty
of Health Science, Istanbul University, 34740 Bakirkoy, Istanbul, Turkey
2 Department of Orthopedics and Traumatology, Medipol
University, Istanbul, Turkey
assessed and compared to those of the original version. The self-reported outcome instruments that have been trans-lated into Turkish and psychometrically tested only include the Foot and Ankle Outcome Score (FAOS) and FFI [7,
8]. The FAOS has been shown to have poor psychometric properties.
The FAAM is used extensively to evaluate the foot and ankle disorders, and the psychometric characteristics have been demonstrated [6]. It has been translated to different cultural settings and into many languages, including Dutch, Italian, Persian, German, French and Japan [9–13]. Data obtained from the cross-culturally adapted versions con-tribute to a better understanding of the measurement prop-erties of the FAAM. The translated versions of the FAAM were found to be reliable and valid for patients with a vari-ety of foot and ankle injuries [9–13]. Therefore, a Turkish version of the FAAM would likely be a useful self-reported outcome instrument for the management of the Turkish-speaking population with foot and ankle injuries. The pur-pose of this study was to translate and culturally adapt the English version of the FAAM into Turkish and to investi-gate the reliability, validity and responsiveness of the trans-lated version and compare these properties to the Turkish versions of the FFI and the Short-Form Health Survey.
Methods
Translation and cross-cultural adaptation
Translation and cross-cultural adaptation of the FAAM were performed in five stages, consistent with the stages recommended by Beaton [14]. In the first stage, two Turk-ish individuals with a good command of EnglTurk-ish were responsible for the literal and conceptual translation of the FAAM. The informed translator was a physical therapist, and the uninformed translator was a teacher. Both trans-lators were fluent in English and spoke Turkish as their mother tongue. The translations were completed indepen-dently. In the second stage, both translations were com-pared and reviewed by a bilingual individual who high-lighted any conceptual errors or inconsistencies in the translations to establish the first Turkish translation. Once the first Turkish translation was decided upon, in the third stage, two native English speakers with a good command of Turkish separately translated the finalized Turkish trans-lation back into English. Both translators were unaware of the purpose of the study and had no access to the original English version. In the fourth stage, the back-translated version of the FAAM was compared to the initial Eng-lish version of the FAAM by a committee consisting of a methodologist, a language professional and the four trans-lators. The committee evaluated the four translations and
compared the discrepancies. After discussing the discrep-ancies, the committee finalized and approved the Turkish version of the FAAM. In the final stage, preliminary testing was performed to determine comprehension of the Turkish version and it is named as FAAM-T.
Self-reported outcome instruments
The FAAM is an evaluative self-reported instrument to comprehensively assess physical function of individuals with musculoskeletal disorders of the foot and ankle [6]. It consists of an ADL ADL) and Sports (FAAM-Sport) subscale, containing 21 and 9 items, respectively. Standardized answer options are given in five-point Likert boxes, ranging from 0 (unable to do) to 4 (no difficulty). The sixth option is not applicable, which will not be taken into account when counting the percentage scores. Accord-ing to Martin et al. [6], we only calculated a total subscale if ≤2 items were missing (or inapplicable) in the FAAM-ADL and if ≤1 item was missing (or inapplicable) in the FAAM-Sport domain. A higher score represents a higher level of function in each subscale.
The FFI consists of 23 items grouped together into three subscales including activity limitation (five items), disabil-ity (nine items) and pain (nine items). Visual analog scales that are divided into ten equal segments, with assigned values from zero to nine, are used to score each ques-tion. A subscale score is obtained by totaling the score for each question, dividing it by the maximum attainable sub-scale score and then multiplying it by 100. If a question is marked not applicable or not answered, it is excluded from the total. Subscale scores range from zero to 100. A total foot function score is obtained by averaging the subscale scores together. A higher score is representative of greater impairment and a lower level of functioning [4].
The Short-Form Health Survey is a generic score, which is used to establish a health profile. It consists of eight scaled scores, where each scale is directly transformed into a scale from 0 to 100 to identify the patient’s physi-cal and mental state. These eight sections include physiphysi-cal functioning (PF), physical role functioning (RP), bodily pain (BP), general health perceptions (GH), vitality (VT), social function (SF), role emotional functioning (RE) and mental health (MH). In addition, sum of the PF, RP, BP and GH generates physical component scale (PCS), and sum of the VT, SF, RE and MH generates mental component scale (MCS). Standardized scores range from 0 to 100, with higher scores indicating better health status [15].
Participants
Before inclusion in the study, potential participants were asked to read and sign an informed consent form, which
was approved by the Ethics Committee at Medipol Uni-versity at Department of Orthopedics and Traumatol-ogy (IRB: 1084400987-112). The study was performed between March 2013 and January 2015. The eligibility cri-teria were: (1) 16 years of age or older; (2) foot and ankle pathology, including plantar fasciitis, achilles tendinopathy, osteoarthritis, calcaneal spur, hallux valgus, diabetic foot and ankle sprain; (3) ability to read and write in Turkish. Patients with systematic inflammatory rheumatic disease, neurological or vascular diseases, cancer and psychiat-ric problems were excluded. Diagnoses were established by two orthopedic surgeons based on the history, physical examination and diagnostic imaging. The diagnosis given by the physician was recorded for the purpose of this study. Age, gender, occupations, involved side and diagnosis of the participants were recorded.
Preliminary testing
Preliminary testing was conducted on 30 patients (16 males, mean ± SD age 38.4 ± 9.3, range 18–62 years, body mass index (BMI) 28.3 ± 5.1 kg/m2) who fulfilled
the eligibility criteria of the study to determine comprehen-sion of the Turkish vercomprehen-sion. Diagnosis of the patients was osteochondral lesions of the talus (n = 4), chronic ankle instability (n = 8), surgery of lateral malleolar fracture (n = 4), degenerative arthritis (n = 10), achilles tendinopa-thy (n = 4). Following completion of the questionnaire by each patient, the physical therapists performed an interview during which they were asked whether they had any dif-ficulties in understanding the questions. The questions that were difficult to understand were noted, and the patients were asked for their recommendations for revisions.
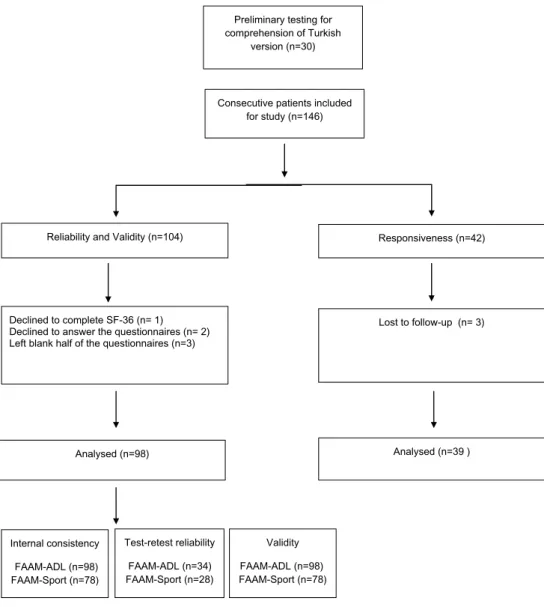
Fig. 1 Flowchart of the study
design
Consecutive patients included for study (n=146)
Analysed (n=98) Declined to complete SF-36 (n= 1) Declined to answer the questionnaires (n= 2) Left blank half of the questionnaires (n=3)
Reliability and Validity (n=104)
Lost to follow-up (n= 3) Responsiveness (n=42) Analysed (n=39 ) Internal consistency FAAM-ADL (n=98) FAAM-Sport (n=78) Test-retest reliability FAAM-ADL (n=34) FAAM-Sport (n=28)
Preliminary testing for comprehension of Turkish
version (n=30)
Validity FAAM-ADL (n=98) FAAM-Sport (n=78)
One hundred and four consecutive patients with a variety of foot and ankle pathologies were asked to complete the Turk-ish version of the FAAM (Fig. 1) and the previously validated Turkish versions of the FFI and SF-36 [16, 17]. The patients were also asked to complete the FAAM-T again 7 days after their first completion to determine test–retest reliability. To minimize the risk of short-term clinical change, no treatment was provided during this period. Responsiveness was assessed in 42 patients who were diagnosed with plantar fasciitis. The patients were treated for 3 weeks at the clinic and followed with a home exercises program for 3 months. The assessment was performed at 3-month and 1-year follow-up.
Statistical analysis
All statistical analyses were performed with the Statisti-cal Package for the Social Sciences (SPSS) 20.0 (SPSS Inc, Chicago, IL, USA). The level of significance was set at
P ≤ 0.0.05. Descriptive statistics were calculated for all varia-bles. These included frequency counts and the percentage for nominal variables and measures of central tendency (means and medians) and dispersion (standard deviations and ranges) for continuous variables. Before the statistical analysis, the Kolmogorov–Smirnov test was used to test for normal distri-bution of data. Dependent variables were compared using an analysis of variance for repeated measures. The measurement properties analyzed in this study for the instruments included internal consistency, test–retest reliability, agreement, con-struct validity, ceiling and floor effects responsiveness.
Internal consistency
Internal consistency was assessed using Cronbach’s alpha. This test indicates the homogeneity between the items within a questionnaire or the subdomains of a question-naire. The test was used to determine the interrelatedness among the items of the FAAM-T. An inter-item correlation matrix was used to indicate whether one of the items did not correlate positively with the other items. A Cronbach’s alpha value ranging from 0.70 to 0.95 was considered to be adequate [19]. Excessively high values are not neces-sarily desirable because this may indicate a redundancy of the questionnaire items. In this study, data from the patients included in the first administration of the FAAM-T were used to assess internal consistency.
Test–retest reliability
Test–retest reliability represents a scale’s ability to yield consistent results when administered on separate occasions during a period when an individual’s status has remained stable [11]. Intraclass correlation coefficients (ICCs) were calculated using a two-way, mixed-model under
consistency. Values of 0.4 or greater were considered satis-factory (ICC = 0.81–1.0, excellent; 0.61–0.80, very good; 0.41–0.60, good; 0.21–0.40, fair; and 0.00–0.20, poor) [18].
Agreement
Agreement was assessed with the standard error of meas-urement (SEM) and minimal detectable change (MDC). The ICC was used to calculate the standard error of meas-urement (SEM), which is an index of measmeas-urement preci-sion. The SEM is calculated as the SD of the scores time the square root of (1-ICC). The minimal detectable change (MDC) refers to the minimal amount of change that is within the measurement error. The SEM was used to deter-mine the minimum detectable change at the 95 % limits of confidence (MDC 95 %) and was calculated as the SEM times 1.96 time the square root of 2 [19].
Validity
Validity is represented by the extent to which a score retains its intended meaning and interpretation [20]. In this study, we examined three aspects of validity: construct, conver-gent/divergent and content validity. Evidence for construct validity of the FAAM-T was provided by determining its relationship with the FFI. The physical functioning, physi-cal role functioning and PCS domains of the SF-36 were used to assess convergent validity. Evidence for divergent validity was provided by determining the relationships with the mental health, emotional role functioning and MCS domains of the SF-36 that were calculated to assess con-struct and convergent/divergent validity. It was hypothesized that there will be moderate to strong correlations (r ≥ 0.6) between FAAM-T ADL and Sports scores and concurrent measures of physical function and low correlations (r ≤ 0.3) between FAAM-T ADL and Sports scores and concurrent measures of mental health emotional function. Content validity was assessed by the distribution of the scores and occurrence of ceiling and floor effects. Floor and ceiling effects of the FAAM-T at the first and second completion of the form were assessed by calculating the proportion of patients scoring the minimum or maximum values on the scale relative to the total number of patients. We consid-ered scores between 0 and 10 % to be minimum scores and scores between 90 and 100 % to be maximum scores. Floor and ceiling effects were considered to be relevant if >30 % of the patients had a score at the limits of the scale [20].
Responsiveness
Responsiveness determines whether an instrument can detect clinical changes. It was assessed in 42 patients who diagnosed by plantar fasciitis. The patients were treated
conservatively for 3 weeks (nine sessions) at the clinic. They performed a home exercises program for following 3 months. Effect sizes (ES) were determined by calculating the differences in the means of baseline and follow-up data at 3 months and 1 year, divided by the standard deviation at baseline demonstrated [6]. Values between 0.20 and 0.50 were considered to be small effects; those between 0.51 and 0.80 moderate effects; and those higher than 0.80 large effects demonstrated [21].
Results
Translation and cross-cultural adaptation
During the translation process, translators have some dif-ficulties to find a right Turkish word for “landing” and “cut-ting lateral movements.” Upon discussion with the original author, a consensus was reached on the translation so that the meaning of the questions did not change. The prelimi-nary testing did not show any difficulty in patients’ under-standing of these words. The patients required approxi-mately 10 min to complete the Turkish FAAM.
Measurement properties and testing
Table 1 provides the demographic and clinical characteris-tics of the patients. All outcome measures used in this study were found to be normally distributed, so a parametric test was used for statistical analysis. The descriptive statistics for the scores at baseline and at the second administration of the FAAM-T are provided in Table 2. The mean ± SD duration of symptoms was 20.8 ± 24.9 months. Among all patients included in the study, two patients declined to answer any of the questionnaires, one declined to complete the SF-36, and three left half of the questionnaires incom-plete. The remaining 98 patients (39 males, mean ± SD age 35.0 ± 14.0 years; range 16–71 years; body mass index (BMI): 30.1 ± 1.3 kg/m2) included in the study:
20 of them declared that they do not perform any sport so they did not answer Sport subscales and the remaining 78 patients (33 males, mean ± SD age 31.9 ± 12.0 years; range 17–64 years; body mass index (BMI): 31.2 ± 2.3 kg/ m2) completed only Sports subscales of the FAAM-T at the
first assessment. Thirty-four of the 98 patients and 28 of the 78 patients returned for the second assessment of the ADL and Sports subscales, respectively, for test–retest reliability analysis (Fig. 1).
Internal consistency
The internal consistency of the first assessment of the FAAM-T ADL and FAAM-T Sport was strong, with a
Cronbach’s alpha value of 0.95 and. 91. The inter-item cor-relation matrix did not show any low or negative inter-item correlation. The results of internal consistency and compar-isons with other translated versions of the FAAM are pro-vided in Table 3.
Test–retest reliability
The mean ± SD of the FAAM-T subscales of the first and second assessments are given in Table 2. The interval between the two assessments was 7 days. Test–retest reli-ability was 0.90 for both the ADL and Sports subscales.
Agreement
The SEM and MDC were determined to be 5.6 and 15.5 for FAAM-T ADL and 2.4 and 6.6 for FAAM-T Sport.
Construct validity
The FAAM-T ADL and Sport subscales demon-strated very good correlation with the FFI (r = 0.70 and 0.63, respectively). The correlations between
Table 1 Patient demographics
Characteristic Value Age, mean (SD) 35.0 (14.0) Female gender [n (%)] 59 Occupation [n (%)] Housewife 21 (21.4) Retired 8 (8.2) Labor 48 (49.0) White collar 5 (5.1) Student 16 (16.3) Involved side [n (%)] Right leg 56 (57.1) Diagnosis [n (%)] Ankle sprain 24 (24.4)
Plantar heel pain 10 (10.2)
Calcaneal spur 5 (5.1) Achilles tendinopathy 9 (9.1) Fracture 8 (8.1) Hallux valgus 2 (2.0) Osteoarthrosis 8 (8.1) Diabetic foot 3 (3.1)
Complex regional pain syndrome 5 (5.1)
Rheumatoid arthritis 5 (5.1)
Osteochondral lesions 6 (6.1)
Chronic ankle instability 7 (7.1)
the FAAM-T and SF-36 are presented in (Table 4). In sum, the FAAM-T ADL and Sport subscales were most strongly associated with the PF and the PCS (r = 0.71, r = 0.70 and r = 0.51, r = 0.55, respectively;
P = 0.001) of the SF-36. The weakest associations were found between the FAAM-T ADL, FAAM-T Sport
subscales and the SF-36 VT (r = 0.27 and r = 0.28, respectively).
Floor and ceiling effects
Floor and ceiling effects and the number of items answered were identical during the test and retest examination. None of the patients’ scores were at the maximal or minimal value, indicating no floor or ceiling effect.
Responsiveness
Three patients dropped out before treatment. There-fore, baseline assessment on the FAAM-T was compared with the conservative treatment of the plantar fasciitis at 3-month and 1-year follow-up for 39 patients (28 females, age 45.5 ± 8.5, range 30–66 years, BMI 23.01 ± 4.2 kg/ m2). The mean and standard deviation of the baseline,
at 3-month and 1-year follow-up values of the FAAM-T ADL subscale were 50.39 ± 18.5, 78.66 ± 16.4 and 85.25 ± 19.86, respectively. The FAAM-T ADL subscale indicated a large effect size for 3-month and 1-year follow-up ES of 1.4 (95 % CI 1.02, 1.82) and 1.9, respectively (95 % CI 1.38, 2.24).
Discussion
The aim of this study was to translate and culturally adapt the FAAM into Turkish and provide reliability, validity and responsiveness data for the translated version based on a sample of Turkish-speaking patients with foot and ankle pathologies. Based on our sample, FAAM-T demonstrated acceptable levels of reliability, validity and responsiveness to be used as a self-reported outcome instrument for Turk-ish-speaking individuals with a variety of foot and ankle pathologies.
Internal consistency of the FAAM-T, using Cronbach’s alpha, was excellent for both ADL and Sports subscales, which is similar to values previously reported for the Eng-lish and other translated versions of the FAAM [9–13]. Test–retest reliability for the FAAM-T was also excellent and comparable to what has been previously reported in the literature [9–13]. The interval between repeat administra-tions for a patient-reported outcome measure should be rel-atively brief (3–7 days) when the condition being measured is expected to change rapidly. In the literature, the reported intervals for the estimation of test–retest reliability of the FAAM range from 2 days to 4 weeks [9–13]. We repeated the test 7 days apart to ensure an individual’s condition had not changed. We believe that short test–retest intervals such as 2 days carry the risk of patients “becoming familiar with
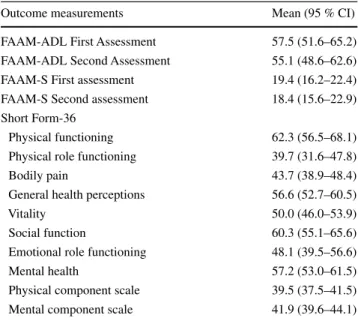
Table 2 Descriptive statistics for the patient-reported outcome
meas-ures
FAAM Foot and Ankle Ability Measure, ADL activity of daily living, S sport
Outcome measurements Mean (95 % CI)
FAAM-ADL First Assessment 57.5 (51.6–65.2)
FAAM-ADL Second Assessment 55.1 (48.6–62.6)
FAAM-S First assessment 19.4 (16.2–22.4)
FAAM-S Second assessment 18.4 (15.6–22.9)
Short Form-36
Physical functioning 62.3 (56.5–68.1)
Physical role functioning 39.7 (31.6–47.8)
Bodily pain 43.7 (38.9–48.4)
General health perceptions 56.6 (52.7–60.5)
Vitality 50.0 (46.0–53.9)
Social function 60.3 (55.1–65.6)
Emotional role functioning 48.1 (39.5–56.6)
Mental health 57.2 (53.0–61.5)
Physical component scale 39.5 (37.5–41.5)
Mental component scale 41.9 (39.6–44.1)
Table 3 Reliability of the FAAM, including the Turkish version
ICC intraclass correlation coefficient, FAAM Foot and Ankle Ability Measure, ADL activity of daily living
Language versions Test–retest reliability (ICC) FAAM-ADL (n = 34) FAAM-Sports (n = 28) Cronbach’s alpha FAAM-ADL (n = 98) FAAM-Sports (n = 78) Martin [13] English 0.89 0.87 – – Sartorio [18] Italian 0.98 – 0.96 – Uematsu [20] Japan 0.86 0.75 0.87 0.91 Weel [21] Dutch 0.86 0.62 0.98 0.95 Nauck [16] German 0.59–0.91 0.91–0.97 0.49–0.91 0.91–0.97 Mazaheri [15] Persian 0.98 0.98 0.97 0.94 Borloz [4] French 0.97 0.94 0.97 0.97 Present study Turkish 0.90 0.90 0.95 0.91
the questions” and simply answering based on memory of the first assessment.
The MDC was determined to be 15.5 and 6.6 for the ADL and Sports subscales, meaning that a change of less than this value on repeated administrations of the FAAM-T should be considered a reflection of measurement error rather than a true change in the patient’s condition. The MDC value for the FAAM-T ADL was higher than that of the English (MDC = 5.7), French (MDC = 7) and Persian (MDC = 8.7) versions, but FAAM-T Sport sub-scale was lower than that of English (MD = 12.3), French (MDC = 18) and Persian (MDC = 9.8) versions [6, 9,
13]. This is attributed to the high standard deviation of the FAAM-T ADL and low standard deviation of FAAM-T Sport subscale data of our sample when compared to the English FAAM.
The validity of the English version and other translated versions of the FAAM has been investigated by determin-ing its relationship with many other self-reported outcome instruments including the Numeric Rating Scale for Pain (NRS), Foot and Ankle Outcome Score (FAOS) and Lower Extremity Functional Scale (LEFS) [3, 5, 22]. In these stud-ies, the highest levels of association were with the FAAM-ADL and FAOS-FAAM-ADL (r = 0.81) and the lowest level of association being observed with the FAAM-ADL and FAOS-Sport (r = −0.34) [13]. The LEFS was showed good correlation with FAAM-ADL (r = 0.66) as well [11]. In addition to these self-reported outcome instruments, Nauck et al. [8] used the ankle laxity classification system to determine construct validity of FAAM. The authors found strong correlation with FAAM subscales and ankle laxity classification system (ρ = −0.81 to −0.86). In this study, evidence for construct validity was obtained by determin-ing the relationship between the FAAM-T and the FFI-T. The correlation coefficients between the FAAM-T ADL
and Sports subscales and the FFI-T were strong (r = 0.70 and r = 0.63, respectively). Ours is the only study, to our knowledge that used the FFI to provide evidence for the construct validity of the FAAM.
The relationship between the FAAM-T and concur-rent measures of physical function showed strong corre-lation compared with recorre-lationship between the FAAM-T and concurrent measures of mental health [15]. This pro-vides evidence that the FAAM-T is a measure of physi-cal function as opposed to mental function. The correla-tion between the FAAM-T ADL and Sports subscales and SF-36 PF and SF-36 PCS values were lower than for the English (r = 0.84, r = 0.78 and r = 0.78, r = 0.80, respec-tively), Dutch (r = 0.78, r = 0.61 and r = 0.75, r = 0.57, respectively) and French (r = 0.85, r = 0.72 and r = 0.81,
r = 0.72, respectively) versions of the FAAM but higher than that noted with the Persian (r = 0.60, r = 0.53 and
r = 0.61, r = 0.48, respectively) versions [6, 9, 13]. The slightly lower correlation between the FAAM-T ADL and Sports Subscale and the SF-36 PF and SF-36 PCS may be attributed to lower level of function of our population. The level of association between the FAAM and the men-tal domains of the SF-36 compared favorably to the results found with other translated versions [9–13]. Responsive-ness based on the completion of the FAAM-T at 3-month and 1-year follow-up of the conservative treatments of the patients with plantar fasciitis indicated large ES. To our knowledge, ours is the only study that provided respon-siveness of the FAAM in those specifically with plantar fasciitis.
Study limitations
While demonstrating sufficient reliability, validity and con-sistency to merit ongoing use of the FAAM-T, these data
Table 4 Correlation between different versions of the FAAM-T and the domains of the SF-36
BP bodily pain, GH general health perceptions, MCS mental component scale, MH mental health, PCS physical component scale, PF physical functioning, RE emotional role functioning, RP physical role functioning, SF social function, VT vitality
* Significant (P < 0.001)
FAAM-ADL (n = 98) Original version of the FAAM-ADL FAAM-Sport (n = 78) Original version of the FAAM-Sport
SF-36 (PF) 0.71* 0.84 0.51* 0.78 SF-36 (RP) 0.51* 0.50* SF-36 (BP) 0.53* 0.52* SF-36 (GH) 0.41 0.38 SF-36 (VT) 0.27 0.28 SF-36 (SF) 0.50* 0.40* SF-36 (RE) 0.48* 0.45* SF-36 (MH) 0.32 0.18 0.30 0.11 SF-36 (PCS) 0.70* 0.84 0.55* 0.80 SF-36 (MCS) 0.30 0.05 0.33 −0.02
should be generated from high number of patients. In addi-tion, we only assess responsiveness of the FAAM-T on patients with plantar fasciitis. However, it is necessary to assess responsiveness with other foot and ankle injuries. Future studies should also determine the minimal clinically important difference for the FAAM-T for different foot and ankle pathologies.
Conclusion
The translation of the English version of the FAAM into Turkish and its cross-cultural adaptation to a Turkish-speaking population were done successfully without any major inconsistencies. Our result showed that the FAAM-T is a reliable, valid and responsive self-reported outcome instrument to evaluate in these patients with variety of foot and ankle pathologies.
Compliance with ethical standards
Ethical standard All procedures performed in studies involving
human participants were in accordance with the ethical standards of the institutional and/or national research committee and with the 1964 Helsinki Declaration and its later amendments or comparable ethical standards.
Conflict of interest No benefits in any form have been or will be
received from a commercial party related directly or indirectly to the subject of this manuscript.
References
1. Martin RL, Irrgang JJ (2007) A survey of self-reported outcome instruments for the foot and ankle. J Orthop Sports Phys Ther 37(2):72–84
2. Bennett PJ, Patterson C, Wearing S, Baglioni T (1998) Develop-ment and validation of a questionnaire designed to measure foot-health status. J Am Podiatr Med Assoc 88:419–428
3. Binkley JM, Stratford PW, Lott SA, Riddle DL (1999) The Lower Extremity Functional Scale (LEFS): scale development, measurement properties, and clinical application. North Ameri-can Orthopaedic Rehabilitation Research Network. Phys Ther 79:371–383
4. Budiman-Mak E, Conrad KJ, Roach KE (1991) The Foot Func-tion Index: a measure of foot pain and disability. J Clin Epide-miol 44:561–570
5. Martin RL, Burdett RG, Irrgang JJ (1999) Development of the Foot and Ankle Disability Index (FADI). J Orthop Sports Phys Ther 29:A32–A33
6. Martin RL, Irrgang JJ, Burdett RG, Conti SF, Van Swearingen JM (2005) Evidence of validity for the foot and ankle ability measure (FAAM). Foot Ankle Int 26:968–983
7. Karatepe AG, Günaydin R, Kaya T, Karlibas¸ U, Özbek G (2009) Validation of the Turkish version of the foot and ankle outcome score. Rheumatol Int 30:169–173
8. Nauck T, Lohrer H (2011) Translation, cross-cultural adap-tion and validaadap-tion of the German version of the foot and ankle ability measure for patients with chronic ankle instability. Br J Sports Med 45:785–790
9. Borloz S, Crevoisier X, Deriaz O, Ballabeni P, Martin RL, Luthi F (2011) Evidence for validity and reliability of a French version of the FAAM. BMC Musculoskelet Disord 8(12):40
10. Mazaheri M, Salavati M, Negahban H, Sohani SM, Taghiza-deh F, Feizi A, Karimi A, Parnianpour M (2010) Reliability and validity of the Persian version of foot and ankle ability measure (FAAM) to measure functional limitations in patients with foot and ankle disorders. Osteoarthr Cartil 18:755–759
11. Sartorio F, Vercelli S, Bravini E, Bargeri S, Moroso M, Plebani G, Ferriero G (2014) Foot and ankle ability measure: cross-cul-tural translation and validation of the Italian version of the ADL module (FAAM-I/ADL). Med Lav 105:357–365
12. Uematsu D, Suzuki H, Sasaki S, Nagano Y, Shinozuka N, Suna-gawa N, Fukubayashi T (2015) Evidence of validity for the Japa-nese version of the foot and ankle ability measure. J Athl Train 50:65–70
13. Beaton DE, Bombardier C, Guillemin F, Ferraz MB (2000) Guidelines for the process of cross-cultural adaptation of self-report measures. Spine (Phila Pa 1976) 25:3186–3191
14. Ware JE, Sherbourne CD (1992) The MOS 36-Item Short-Form Health Survey (SF-36). I. Conceptual framework and item selec-tion. Med Care 30:473–483
15. Koçyiğit H, Aydemir Ö, Fis¸ek G, Ölmez N, Memis¸ A (1999) Reliability and validity of Turkish version of Short Form 36: a study of patients with rheumatoid disorder. Drug Ther 12:102–106
16. Yalıman S¸E, Eskiyurt N, Budiman-Mak E (2014) Turkish trans-lation and adaptation of foot function index in patients with plan-tar fasciitis. Turk J Phys Med Rehab 60:212–222
17. Terwee CB, Bot SD, de Boer MR (2007) Quality criteria were proposed for measurement properties of health status question-naires. J Clin Epidemiol 60:34–42
18. de Vet HC, Terwee CB, Bouter LM (2003) Current challenges in clinimetrics. J Clin Epidemiol 56:1137–1141
19. Nunnally JC, Bernstein IH (1994) Psychometric theory, 3rd edn. McGraw-Hill, New York
20. Kane RL (1997) Outcome measures. In: Understanding health care outcomes research. Aspen Publishers, Gaithersburg, pp 17–18
21. Gagliese L, Weizblit N, Ellis W, Chan VW (2005) The measure-ment of postoperative pain: a comparison of intensity scales in younger and older surgical patients. Pain 117:412–420
22. Weel H, Zwiers R, Azim D, Sierevelt IN, Haverkamp D, van Dijk CN, Kerkhoffs GM (2014) Validity and reliability of a Dutch version of the foot and ankle ability measure. Knee Surg Sports Traumatol Arthrosc 24(4):1348–1354