DEVELOPMENT OF AN EXPERIMENTAL
IMAGE PROCESSING TOOL AND
FLOW-CYTOMETRY BASED
ELECTROMAGNETIC SCATTERING
ANALYSIS FOR MEDICAL DIAGNOSIS OF
RED BLOOD CELL PATHOLOGY
a dissertation submitted to
the graduate school of engineering and science
of bilkent university
in partial fulfillment of the requirements for
the degree of
doctor of philosophy
in
electrical and electronics engineering
By
Polat G¨
okta¸s
Development of an Experimental Image Processing Tool and Flow-Cytometry Based Electromagnetic Scattering Analysis for Medical Diagnosis of Red Blood Cell Pathology
By Polat G¨okta¸s August 2020
We certify that we have read this dissertation and that in our opinion it is fully adequate, in scope and in quality, as a dissertation for the degree of Doctor of Philosophy.
Vakur Beh¸cet Ert¨urk(Advisor)
Ayhan Altınta¸s(Co-Advisor)
Ergin Atalar
Salih Aksu
Tolga C¸ ukur
Yahya B¨uy¨uka¸sık
Approved for the Graduate School of Engineering and Science:
Ezhan Kara¸san
ABSTRACT
DEVELOPMENT OF AN EXPERIMENTAL IMAGE
PROCESSING TOOL AND FLOW-CYTOMETRY
BASED ELECTROMAGNETIC SCATTERING
ANALYSIS FOR MEDICAL DIAGNOSIS OF RED
BLOOD CELL PATHOLOGY
Polat G¨okta¸s
Ph.D. in Electrical and Electronics Engineering Advisor: Vakur Beh¸cet Ert¨urk
Co-Advisor: Ayhan Altınta¸s August 2020
The morphological, biophysical and biochemical properties of biological cells are critical markers for many fields, including life sciences, medical diagnosis, etc. Label-free, high-throughput classification and detection of cellular information at the single-cell level are invaluable for medical diagnostics. In particular, an effi-cient algorithm for image analytics plays an important role in biomedical research and in vitro diagnostics with grow importance for healthcare. Morphological/bio-physical alterations in single biological cells have been associated with hemato-logic diseases, such as sickle cell disease. Anemia, which has multiple causes, such as iron deficiency, chronic blood loss and hemolysis, is a prevalent health problem affecting an estimated two billion people or 30% of the world’s population. The ability to measure hemoglobin concentration in anemic patients continuously has significant potential to facilitate hemoglobin monitoring, improve the detection of acute anemia, and avoid the complications and expense. Currently, a ma-jor challenge in many clinical laboratories, quantification of cellular information at the single-cell level requires complex laboratory sample preparation and data analysis procedures. Here, we demonstrate that the combination of a novel in-cubation procedure with rapid gas exchange, image-based flow cytometry (IFC) and a computational cell morphology framework, based on the boundary integral equation method (with the use of Muller Boundary Integral Equation Method) is presented to improve the accuracy of classification of red blood cells (RBCs) subtypes (including normal, intermediate and sickled RBCs) as they appear in time under low oxygen. In this dissertation, the results of the following numeri-cal simulations and experiments are presented: We have investigated the changes in time to follow the rate of sickling with IFC as cells undergo deoxygenation.
iv
We have proposed a new shape quantification feature criteria as a Sickle Index parameter obtained from a user-defined custom mask in the IFC data to pro-vide better identification of “true” normal, intermediate and sickle cell region boundaries in IFC. Especially, the main merit of the study lies in showing for the first time that the light scattering analysis based on boundary shape structures is correlated with the measured side scattering (SSC-A) pattern realized by IFC to provide the refractive index distribution for each RBC subtypes. Moreover, we applied different ionic strengths and osmolarity conditions to control the ratio of Discocyte/Stomatocyte/Echinocyte (D/S/E) subtypes in murine RBCs. Analysis of samples were performed using conventional and image-based flow cytometry (FC). The predicted cellular information showed good agreement with the ex-pected results of our experimental data extracted from bright-field and dark-field images in IFC. The rich information on the predicted scattering pattern makes our angle-resolved light scattering technique for the purpose of the automatic RBC morphological profile in conventional FC, and discover RBC subpopulation target areas for the label-free analysis of conventional FC data. With this ap-proach, we are able to notably reduce the data analysis procedure to identify RBC subtypes from a cell population in a given experiment through IFC or con-ventional FC with an angle-resolved light scattering method. Our approach could lead to replacing current manual protocols in the clinical procedure to avoid com-plex laboratory processes, and manual gating analysis and fluorescent stains in light microscopy or FCs. This study shows that our method has the potential to be used robust and objective characterization, and follow-up care of anemia status, and to provide a rapid action for the conditions that would lead to chronic anemia condition causing to a reduced lifespan, organ damage or painful crisis, and will be useful for the evaluation of anti-sickling agents which are currently proposed or are in clinical trials.
Keywords: Light scattering, image processing, flow cytometry, red blood cells, anemia, sickle cell disease, medical diagnosis, precision and personalized patient-oriented medicine.
¨
OZET
KIRMIZI KAN H ¨
UCRES˙I PATOLOJ˙IS˙IN˙IN TIBB˙I
TES
¸H˙IS
¸ ˙I ˙IC
¸ ˙IN DENEYSEL G ¨
OR ¨
UNT ¨
U ˙IS
¸LEME
ARACININ VE AKIS
¸-S˙ITOMETR˙I ESASLI
ELEKTROMANYET˙IK SAC
¸ ILIM ANAL˙IZ˙IN˙IN
GEL˙IS
¸T˙IR˙ILMES˙I
Polat G¨okta¸s
Elektrik ve Elektronik M¨uhendisli˘gi, Doktora Tez Danı¸smanı: Prof. Vakur Beh¸cet Ert¨urk ˙Ikinci Tez Danı¸smanı: Prof. Ayhan Altınta¸s
A˘gustos 2020
Biyolojik h¨ucrelerin morfolojik, biyofiziksel ve biyokimyasal ¨ozellikleri ya¸sam bil-imleri, tıbbi te¸shis gibi bir¸cok alan i¸cin kritik biyobelirte¸clerdir. ˙I¸saretsiz, y¨uksek verimli sınıflandırma ve h¨ucresel bilgilerin tek h¨ucre d¨uzeyinde tespiti tıbbi te¸shis i¸cin ¸cok de˘gerlidir. ¨Ozellikle, g¨or¨unt¨u analiti˘ginde etkin bir algoritma biyomedikal ara¸stırmalarında ve sa˘glık alanında ¨onemi giderek artan laboratuvar ortamındaki te¸shislerde ¨onemli bir rol oynamaktadır. Tek biyolojik h¨ucrelerdeki morfolo-jik/biyofiziksel de˘gi¸siklikler orak h¨ucre hastalı˘gı gibi hematolojik hastalıklarla ili¸skilendirilmektedir. Demir eksikli˘gi, kronik kan kaybı ve hemoliz gibi birden fazla nedeni olabilecek anemi (kansızlık), tahmini iki milyar insanı veya d¨unya n¨ufusunun %30’unu etkileyen yaygın bir sa˘glık sorunudur. Anemik hastalarda hemoglobin konsantrasyonunun s¨urekli olarak ¨ol¸c¨ulebilme yetene˘gi, hemoglobin izlenmesini kolayla¸stırması, akut anemi tespitini iyile¸stirmesi, komplikasyonları ve masrafları ¨onlemek i¸cin ¨onemli bir potansiyele sahiptir. S¸u anda, bir¸cok klinik laboratuvarında h¨ucresel bilgilerin tek h¨ucre d¨uzeyinde ¨ol¸c¨ulmesindeki zorluk, karma¸sık laboratuvar ¨orne˘ginin hazırlanması ve veri analizi prosed¨urlerini gerek-tirir. Burada, d¨u¸s¨uk oksijen altında zaman i¸cinde g¨or¨und¨ukleri gibi kırmızı kan h¨ucrelerinin (KKH’lerin) alt t¨urlerinin (normal, orta ve oraklı KKH’ler dahil) sınıflandırılmasının do˘grulu˘gunu geli¸stirmek i¸cin sınır integral denklem y¨ontemine (Muller Sınır ˙Integral Denklem Y¨ontemi ile) dayanan bir hesapla-malı h¨ucre morfolojisi yapısı, g¨or¨unt¨u tabanlı akı¸s sitometrisi (GAS) ve yeni bir kulu¸ckalama prosed¨ur¨un¨un hızlı gaz de˘gi¸simi deneysel protokol¨u ile kombinasy-onu sunulmaktadır. Bu ¸calısmada, ¸su sim¨ulasyonlar ve deneyler i¸cin sonu¸clar verilmektedir: H¨ucreler deoksijenasyona maruz kaldık¸ca, g¨or¨unt¨uleme tabanlı
vi
bir akı¸s sitometrisi ile orak oranını takip etmek i¸cin zamandaki de˘gi¸sikliklerini inceledik. GAS’daki “ger¸cek” normal, orta ve orak h¨ucre b¨olgesi sınırlarının daha iyi tanımlanmasını sa˘glamak i¸cin GAS verilerindeki kullanıcı tanımlı ¨ozel bir maskeden elde edilen yeni bir ¸sekil niceleme ¨ozelli˘gi ¨ol¸c¨ut¨u olarak Orak In-deksi parametresi ¨onerilmektedir. ¨Ozellikle, ¸calı¸smanın esas de˘geri, literat¨urde ilk kez olarak sınır ¸sekil yapılarına g¨ore esas alınan ı¸sık sa¸cılım analizinin her bir KKH alt t¨ur¨u i¸cin kırılma indisi da˘gılımını sa˘glamak ¨uzere GAS tarafından ¨
ol¸c¨ulen yan sa¸cılım (YSC-A) deseni ile ¨ort¨u¸st¨u˘g¨u g¨osterilmektir. Ayrıca, Balb/cJ fare t¨ur¨unden alınan KKH’lerde Discocyte/Stomatocyte/Echinocyte (D/S/E) alt t¨urlerinin oranını kontrol etmek i¸cin farklı iyonik g¨u¸cler ve ozmolarite ko¸sullarını uyguladık. Alınan ¨orneklerin analizi, analitik (yani geleneksel) ve g¨or¨unt¨u bazlı akı¸s sitometrisi (AS’ler) kullanılarak yapıldı. Tahmin edilen h¨ucresel bilgiler, GAS’deki parlak ve karanlık alan g¨or¨unt¨ulerinden elde edilen deneysel veriler-imizin beklenen sonu¸cları ile iyi bir uyum g¨osterdi. Ong¨¨ or¨ulen sa¸cılım mod-elindeki detaylı bilgi, geleneksel AS’lerde otomatik KKH morfolojik ¨or¨unt¨us¨un¨u elde etmek amacıyla a¸cı ile ¸c¨oz¨ulm¨u¸s ı¸sık sa¸cılım tekni˘gimizin kullanılmasına ve geleneksel AS verilerinin i¸saretsiz analizi i¸cin KKH alt t¨ur hedef alanlarının ke¸sfetilmesine olanak sa˘glar. A¸cı ile ¸c¨oz¨ulm¨u¸s ı¸sık sa¸cılım y¨ontemi ve GAS yada geleneksel AS aracı˘gıyla belirli bir deneyde bir h¨ucre pop¨ulasyonundan elde edile-cek KKH alt t¨urlerini tanımlamak i¸cin kullanılacak veri analiz prosed¨ur¨un¨u be-lirgin ¸sekilde azaltabiliriz. Bu yakla¸sımımız, karma¸sık laboratuvar i¸slemlerinden, ı¸sık mikroskobunda veya AS’lerdeki manual yolluklama analizi ve floresan boya-masından ka¸cınmak i¸cin klinik prosed¨ur¨unde kullanılan mevcut manual protokol-lerin de˘gi¸stirilmesine yol a¸cabilir. Bu ¸calı¸sma, y¨ontemimizin sa˘glam ve objektif karakterizasyonun ve anemi durumunun takibinde kullanılma potansiyeline sahip olmasını ve ya¸sam s¨uresinin azalmasına, hasar veya acı verici krizlere neden olan kronik anemiye yol a¸cacak durumlar i¸cin hızlı bir eylem sa˘glama potansiyeline sahip olmasını g¨ostermektedir ve ayrıca ¸su anda ¨onerilen veya klinik ¸calı¸smalarda kullanılan anti-orakla¸sma ajanların de˘gerlendirilmesinde de faydalı olacaktır.
Anahtar s¨ozc¨ukler : I¸sık sa¸cılımı, g¨or¨unt¨u i¸sleme, akı¸s sitometri, kırmızı kan h¨ucresi (eritrosit), anemi (kansızlık), orak h¨ucre anemi, tıbbi te¸shis, hastaya y¨onelik hassas ve ki¸sile¸stirilmi¸s tıp.
Acknowledgement
There are several individuals that I would like to acknowledge for contributing to various aspect of this dissertation. Firstly, I would like to express my gratitude to Prof. Ayhan Altınta¸s and Prof. Vakur Beh¸cet Ert¨urk from Department of Electrical and Electronics Engineering, Bilkent University for acting as supervi-sors during my PhD studies. I would also like to thank Prof. Seok-Hyun (Andy) Yun from Massachusetts General Hospital, Wellman Center for Photomedicine at Harvard Medical School, and Prof. ¨Ozlem Yal¸cın from Department of Physiol-ogy, School of Medicine, Ko¸c University, for providing me with such an incredible research opportunity. Their passion, guidance and scientific intitution inspired and motivated me to achieve many goals within the thesis. Working closely with them, I had a chance to learn many interesting things about a completely different discipline, which I am sure will help me in many diffferent ways.
I would like to thank all the members of Andy and Yal¸cın Reseach groups for their help and friendship. My sincere gratitude goes to whole friends for helping me to get through the difficult times with their emotional support and eternal friendship.
This Ph.D. dissertation is the product of a multidisciplinary study combining electrical, computer science, biology, molecular genetics and life sciences. My Fulbright Ph.D. researcher fellowship to Harvard Medical School and subsequent collabration, and also my work with Prof. Kuypers at Children’s Hospital Oak-land Research Institute, Prof. Yal¸cın at Ko¸c University and Dr. Sukharevsky at the Technical University of Munich have exposed me to research in diverse laboratories, which has given me a broader view of research.
I would like to thank Prof. Ergin Atalar from Department of Electrical and Electronics Enginering, Bilkent University and Prof. Salih Aksu from School of Medicine, Hacettepe University in my thesis monitoring committe and also for reading and evaluating my dissertation.
I would also like to thank Prof. Yahya B¨uy¨uka¸sık from School of Medicine, Hacettepe University and Assoc. Prof. Tolga C¸ ukur from Department of Elec-trical and Electronics Enginering, Bilkent University for agreeing to evalute my dissertation as jury members.
viii
I would like to thank the Turkish Scientific Technical Reserach Council for fellowship support (for both TUBITAK BIDEB 2211-A and 2224-A) for during my Ph.D. study. I am also grateful to the IEEE AP-S (Institute of Electrical and Electronics Engineers, Antennas and Propagation Society) Doctoral Research Grant for the 2017-18 year. With their grant for purchasing materials and partic-ipating conferences, I had an opportunity to present my research at international conferences in Denver and Boston, and received good comments from other par-ticipants, which were useful in writing my dissertation. Also I wish to thank the Fulbright Foundation who provided me with a Ph.D. researcher scholarship to gain greater experience both academically and socially in the U.S.A. In addition, I gratefully acknowledge the funding received from the 2019 Leopold B. Felsen Excellence in Electromagnetics award.
The final thanks - and the word seems so inadequate - goes to my family, who have supported me in everyting I have done in my life. I am sure that it would be impossible to complete this thesis without their encouragement.
To my family members, dear friends and supportive colleagues, a sincere and hearty thank you to all mentioned above.
Contents
1 Introduction 1
1.1 Blood and Red Blood Cells (RBCs) . . . 3
1.2 Optical Hematology Technologies to Examine RBCs . . . 19
1.2.1 Light Microscopy . . . 19
1.2.2 Convetional Flow Cytometry . . . 20
1.2.3 Image-based Flow Cytometry (IFC) . . . 22
1.3 Optical Properties of RBCs and Hb . . . 26
1.4 Optical Modeling Techniques of RBCs . . . 27
1.5 Outline of This Thesis . . . 28
2 Methodology 30 2.1 Theoretical Bakground: Light Scattering Modeling . . . 30
2.1.1 Maxwell’s Equations . . . 30
2.1.2 Our Problem Formulation and MBIE Method . . . 33
2.1.3 Scattering Characteristics . . . 38
2.1.4 Numerical Results . . . 39
2.2 Image Processing Procedure . . . 47
2.2.1 Overview of Data Analysis Workflow in IDEAS . . . 47R 2.2.2 Image Segmentation in IDEAS . . . 52R 3 Using Image-Based Flow Cytometry and Angle-Resolved Light Scattering to Define the Sickling Process 63 3.1 Sample Preparation and Image Data Collection . . . 64
CONTENTS x
3.2.1 Finding an Optimal Shape Quantification Factor for
De-oxygenated SS-RBCs in IFC . . . 66
3.3 Optical Modeling of SS-RBCs . . . 88
3.4 Comparison with Experiment and Simulation . . . 91
4 Label-Free Classification of Cellular Information in Conventional Flow Cytometry (FC) 94 4.1 Materials & Methods . . . 95
4.1.1 Sample Preparation . . . 95
4.1.2 Conventional FC Experimental Procedure and Data Analysis 96 4.1.3 IFC Experimental Procedure . . . 96
4.1.4 IFC Data Analysis . . . 98
4.1.5 Classification Analysis . . . 98
4.1.6 Statistical Analysis . . . 99
4.2 Label-Free Analysis Workflow in FC . . . 99
4.3 Optical Modeling of Murine RBCs . . . 102
4.4 FSC/SSC-based Subpopulation Characterization for Murine RBCs 107 4.5 Label-Free Identification of Cellular Information from FSC/SSC Data in Conventional FC . . . 112
List of Figures
1.1 Future prospect of the field of image-based flow cytometry, taken from [1]. . . 4 1.2 Cross sectional shapes of the average RBC and other cellular
in-formation as reported by Evans and Fung [2]. . . 6 1.3 Schematic representation of the red blood cells membrane, taken
from [3]. . . 7
1.4 2-D cross sections of Discocyte-Stomatocyte-Echinocyte RBCs,
taken from [4]. . . 7 1.5 Comparison of currently existing optical hematology techniques in
the clinic. . . 11 1.6 Classification of anemia [5]. . . 13
1.7 Hemoglobin S and red cell membrane changes. Polymerization of
sickle hemoglobin under low oxygen tension changes red cell mor-phology, separates the lipid bilayer from the membrane skeleton, taken from [6]. . . 16
1.8 Four subtypes of SS-RBCs. Scanning electron microscopy images
of the four subtypes of sickle RBCs in oxygenated and doxygenated conditions, taken from [7]. . . 17
1.9 Blood smear components. A sample microscopy image of the whole
blood. . . 19 1.10 The configuration of the flow cytometry. (A) The flow cytometry’s
hydrodynamic force, created by sheath fluid, passes cell suspen-sions through a laser bean sensing area, (B) Simplified illustration of flow cytometry optical system, taken from [8]. . . 21
LIST OF FIGURES xii
1.11 Simplified illustration of image-based flow cytometry system, taken from [9]. . . 23 1.12 Spectral features of IFC, including channel bandwidths and
appli-cable dyes for available lasers, taken from [9]. . . 24 1.13 Simplified illustration of the TDI method, taken from [9]. . . 25 1.14 Complex refractive index spectra of oxygenated and deoxygenated
RBCs, taken from [10]. . . 27
2.1 Problem geometry and the parametrization of the contour. . . 33
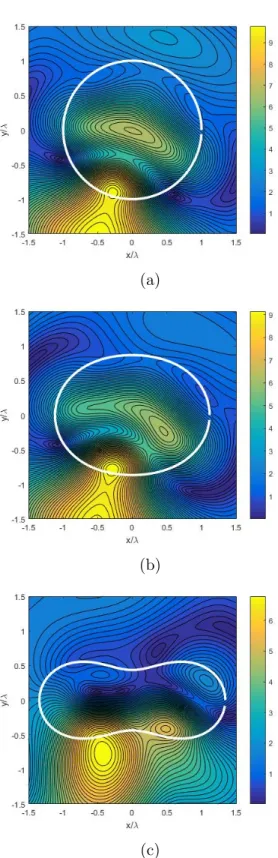
2.2 Representative cell shape models by (2.23): a) a = 1, b = 0 (Cir-cular), b) a=1, b=0.5 (Elliptical), and c) a=1, b=0.9 (Dumbell-shaped cell models). . . 40
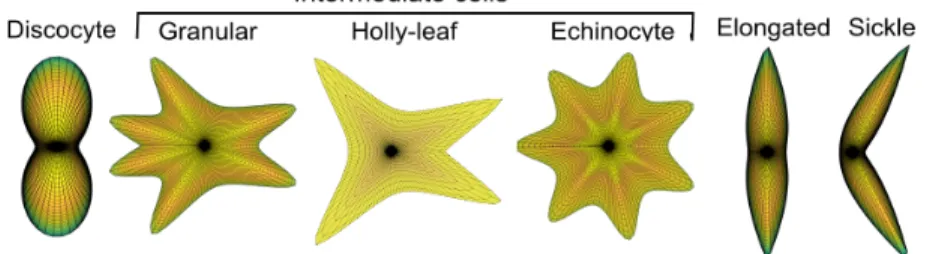
2.3 2-D cross sections of RBCs in pathology population obtained by
(2.22). RBC shape models ranging from biconcave to elongated, and to typical sickle cell shapes are modelled as a homogenous di-electric particle with losses, whose shape is determined by choos-ing the correspondchoos-ing a, b, m, α, β and γ coefficients as follows: Discocyte (a=0.99, b=0.99, m=2, α=1, β=8 and γ=8), Granu-lar (a=1.2, b=2.4, m=5, α=3, β=24 and γ=4), Holly-leaf (a=1.2, b=2.4, m=7, α=1.3, β=1.3 and γ=2.1), Echinocyte (a=2.1, b=2.1, m=7, α=3, β=6 and γ=6), Elongated (a=1.07, b=1.07, m=2, α=24, β=128 and γ=128) and Sickle (a=1, b=1, m=2, α=36, β=128 and γ =512). . . 41 2.4 Near-field values of a single RBC; k0a = 3.14, E-wave excitation:
a) a = 1, b = 0 (Circular), b) a = 1, b = 0.5 (Elliptical), and c) a = 1, b = 0.9 (Dumbell-shaped cell model). . . 42 2.5 Bistatic RCS values of a single RBC; E-wave excitation at all
in-cidence angles: a) Circular-, b) Elliptical-, and c) Dumbell-shaped cell model. . . 43 2.6 The difference plots of bistatic RCS patterns for Circular- and a)
Elliptical-, b) Dumbell-shaped cell model. . . 44 2.7 Bistatic RCS values of a single RBC; E-wave excitation at all
inci-dence angles: a) Dumbell-shaped (Discocyte), b) Elongated-, and c) Sickle cell-shaped cell model. . . 45
LIST OF FIGURES xiii
2.8 The difference plots of bistatic RCS patterns for Dumbell-shaped (Discocyte) and a) Elongated-, b) Sickle cell-shaped cell model. . 46 2.9 Sample schematic representation of the file format process
work-flow for generating a default IDEAS template. Adapted from [9]. 49R
2.10 Sample layout of a .daf file created by a template file for the analy-sis of sickle RBCs. This layout includes the image gallery, analyanaly-sis area that generates plots and associated statistics area. . . 51 2.11 Masking strategy to identify the cell region boundary in the
sam-ple. Representative BF image overlaid with the mask (cyan color). The left image shows the BF image with no mask. . . 53 2.12 Masks define a region of interest. The IDEAS application pro-R
vides a large selection of masks for analyzing images. Adapted from [9]. . . 54 2.13 Default masking strategy to identify cell region boundary in
sam-ple. Representative BF images overlaid with the masks (cyan
color). The default mask contain a region of interest corresponding to objects in the imagery using the Object mask or System mask with a weight of 5. The left image shows the BF image with no mask. . . 55 2.14 Representative user interface for creating a new, custom mask on
the IDEAS mask manager; all default masks and newly createdR functions are available to make adjustments with Boolean commands. 55 2.15 The IDEAS application provides a large selection of features forR
analyzing images. Adapted from [9]. . . 57 2.16 Representative user interface for selecting multiple features for
the analysis of Ch01 images; the user-defined custom mask, Range(System(Object(M01, Ch01, Tight), Ch01, 81), 350-1200, 0.3-1) is chosen for the region of interest detection. . . 58 2.17 Representative user interface for creating a custom feature, e.g.,
Sickle Index shape quantification feature, for the analysis of Ch01 images with the use of the user-defined custom mask, Range(System(Object(M01, Ch01, Tight), Ch01, 81), 350-1200, 0.3-1). . . 59
LIST OF FIGURES xiv
2.18 Representative user interface for selecting parameters in the statis-tics area. . . 62
3.1 Our schematic diagram of the experimental procedure for
image-based flow cytometry. A micro controller and valve system regu-lates the oxygen tension to which blood is exposed in a custom-designed spinning incubator. . . 65 3.2 Masking strategy to identify normal, intermediate and sickle cell
region boundaries in deoxygenated SS-RBCs. Representative BF images of SS-RBCs overlaid with the respective boundary masks (cyan color). The left column shows the BF image with no mask. The second column shows the default M01 mask, which contains a small particle in the masked area. The third column reveals the user-defined custom mask, Range(System(Object(M01, Ch01, Tight), Ch01, 81), 350-1200, 0.3-1). This custom BF mask reaches a tighter fit to the actual contour of the BF region, resulting in an accurate measurement of cellular information for the individual cell. (Reprinted, with permission, from “Image-Based Flow Cy-tometry and Angle-Resolved Light Scattering to Define the Sick-ling Process,” by P. Goktas, I.O. Sukharevsky, S. Larkin, F. A.
Kuypers, O. Yalcin and A. Altintas, Cytometry Part A, 2019) . . 70
3.3 Discrimination of focused cells from all events. The inital gating sequence excludes images that are likely to be incorrectly charecter-ized, such as blurry images. . . 71
3.4 Discrimination of parent population from focused RBCs. . . 71
3.5 The shape quantification features, such as Aspect Ratio (=Minor Axis/Major Axis), Elongation Index (=Height/Width) and Shape Ratio (=Thickness Minimum/Length), obtained by bright-field im-ages in IFC. . . 72 3.6 Representative normalized frequency curve of Sickle Index
param-eter for SS-RBCs upon deoxygenation. The representative sample of Sickle Index feature values are shown in the upper right side of each BF image. . . 72
LIST OF FIGURES xv
3.7 Normal and abnormal (including intermediate and sickle cell re-gion boundaries) are identified with the use of (A) Shape Ratio versus Circularity as a current data analysis protocol in the clinic, (B) Shape Ratio feature with a cut-off range on the combination of default and custom BF mask [11] and (C) our proposed Sickle In-dex versus Circularity criterion [12] obtained from the user-defined custom BF mask. . . 73 3.8 (A) Our sample normal, intermediate and sickle cell region
bound-aries are identified with the use of Shape Ratio versus Circular-ity and Sickle Index versus CircularCircular-ity features obtained from the user-defined custom BF mask. (B) The representative sample of Shape Ratio and Sickle Index feature values are shown in the up-per left side of each BF image. (Reprinted, with up-permission, from “Image-Based Flow Cytometry and Angle-Resolved Light Scatter-ing to Define the SicklScatter-ing Process,” by P. Goktas, I.O. Sukharevsky, S. Larkin, F. A. Kuypers, O. Yalcin and A. Altintas, Cytometry Part A, 2019) . . . 74
3.9 Sample bright-field (BF/Ch-01) and dark-field (SSC/Ch-06)
im-ages for normal cell region boundary acquired by image-based flow cytometry of deoxygenated SS-RBCs, obtained using the IDEAS R software. The representative sample of Sickle Index feature values are shown in the upper right side of each BF image. . . 75 3.10 Sample bright-field (BF/Ch-01) and dark-field (SSC/Ch-06)
im-ages for intermediate cell region boundary (irregularly or abnor-mal shaped cells, such as echinocyte, holly-leaf and granular struc-tures) acquired by image-based flow cytometry of deoxygenated SS-RBCs, obtained using the IDEAS software. The representa-R tive sample of Sickle Index feature values are shown in the upper right side of each BF image. . . 76
LIST OF FIGURES xvi
3.11 Sample bright-field (BF/Ch-01) and dark-field (SSC/Ch-06) im-ages for sickled cell region boundary acquired by image-based flow cytometry of deoxygenated SS-RBCs, obtained using the IDEAS R software. The representative sample of Sickle Index feature values are shown in the upper right side of each BF image. . . 77 3.12 The quantitation of “percent abnormal cells & ratio abnormal
to normal cells (upper side)” and “percent sickled cells & ra-tio sickled to normal cells (bottom side)” obtained with the cri-terion of Shape RatioDef ault (M 01) M ask, Shape RatioCustom M ask,
Shape RatioCut−of f level, Custom M ask and Sickle IndexCustom M ask
features acquired by IFC. (Reprinted, with permission, from “Image-Based Flow Cytometry and Angle-Resolved Light Scatter-ing to Define the SicklScatter-ing Process,” by P. Goktas, I.O. Sukharevsky, S. Larkin, F. A. Kuypers, O. Yalcin and A. Altintas, Cytometry Part A, 2019) . . . 78 3.13 Morphological/physical response of normal and sickle RBCs of
SCD as a function of exposure time to low oxygen acquired by IFC. Morphological/physical parameters obtained with the cri-terion of Sickle Index feature on the user-defined Range mask (Sickle IndexCustom M ask) as a function of reaction time of
deoxy-genation. The dots in each case represent the mean value, whereas the vertical error bar represent the standard deviation of the corre-sponding cellular information. (Reprinted, with permission, from “Image-Based Flow Cytometry and Angle-Resolved Light Scatter-ing to Define the SicklScatter-ing Process,” by P. Goktas, I.O. Sukharevsky, S. Larkin, F. A. Kuypers, O. Yalcin and A. Altintas, Cytometry Part A, 2019) . . . 81
LIST OF FIGURES xvii
3.14 Morphological/physical features obtained with the criterion of Shape RatioCut−of f level, Custom M ask and Sickle IndexCustom M ask
features as a function of reaction time of deoxygenation. The dots in each case represent the mean value of the corresponding cellu-lar information. (Reprinted, with permission, from “Image-Based Flow Cytometry and Angle-Resolved Light Scattering to Define the Sickling Process,” by P. Goktas, I.O. Sukharevsky, S. Larkin, F. A. Kuypers, O. Yalcin and A. Altintas, Cytometry Part A, 2019) 82 3.15 Morphological/physical features obtained with the criterion of
Shape RatioCut−of f level, Custom M ask and Sickle IndexCustom M ask
features as a function of normal and sickle cell region . The dots in each case represent the mean value of the corresponding cellu-lar information. (Reprinted, with permission, from “Image-Based Flow Cytometry and Angle-Resolved Light Scattering to Define the Sickling Process,” by P. Goktas, I.O. Sukharevsky, S. Larkin, F. A. Kuypers, O. Yalcin and A. Altintas, Cytometry Part A, 2019) 83 3.16 Representative IFC images of SS-RBCs upon deoxygenation. (A)
Representative images of deoxygenated SS-RBCs acquired by bright-field (BF/Ch-01) and dark-field (SSC/Ch-06) channels in
IFC, obtained using the IDEAS software. BF objects wereR
masked using an investigator-defined custom mask (System 80, Object Tight, Range-Area 350-1200 and Range-Aspect Ratio 0.3-1). Scale bar, 7µm. (B) 2-D cross sections of SS-RBC shape mod-els obtained from Eq. 2.22. (Reprinted, with permission, from “Image-Based Flow Cytometry and Angle-Resolved Light Scatter-ing to Define the SicklScatter-ing Process,” by P. Goktas, I.O. Sukharevsky, S. Larkin, F. A. Kuypers, O. Yalcin and A. Altintas, Cytometry Part A, 2019) . . . 89
LIST OF FIGURES xviii
3.17 Representative simulated optical signature of SS-RBCs upon de-oxygenation. The simulated light scattering profile of
individ-ual SS-RBCs with the use of MBIE method at nr = 1.38 and
E -polarization conditions. (Reprinted, with permission, from
“Image-Based Flow Cytometry and Angle-Resolved Light Scatter-ing to Define the SicklScatter-ing Process,” by P. Goktas, I.O. Sukharevsky, S. Larkin, F. A. Kuypers, O. Yalcin and A. Altintas, Cytometry Part A, 2019) . . . 90 3.18 Angle-resolved light scattering approach in IFC allows for
label-free, non-invasive classification of morphological RBC subpopula-tion region boundaries in the deoxygenated SS-RBCs. (A) The scatter histogram plots of measured SSC-A patterns as a func-tion of cell diameter and orientafunc-tion for SS-RBCs at t = 0 and 20 minutes of deoxygenation obtained from bright- and dark-field images in IFC. (B) The difference plots of the simulated SSC-A patterns between (Left:) Discocyte and Elongated, and (Right:) Discocyte and Sickle shaped RBC models. (Reprinted, with per-mission, from “Image-Based Flow Cytometry and Angle-Resolved Light Scattering to Define the Sickling Process,” by P. Goktas, I.O. Sukharevsky, S. Larkin, F. A. Kuypers, O. Yalcin and A. Altintas, Cytometry Part A, 2019) . . . 92 3.19 The comparison between simulated and measured SSC-A patterns
for the case of 1.36 ≤ nr ≤ 1.41 and average radius, d = 8µm in
normal and sickle cell region boundaries of SS-RBCs. (Reprinted, with permission, from “Image-Based Flow Cytometry and Angle-Resolved Light Scattering to Define the Sickling Process,” by P. Goktas, I.O. Sukharevsky, S. Larkin, F. A. Kuypers, O. Yalcin and A. Altintas, Cytometry Part A, 2019) . . . 93
LIST OF FIGURES xix
4.1 Label-free analysis workflow. First the scattered light (for exam-ple, FSC-A and SSC-A cross-section values) from RBC suspen-sion solutions is measured by a conventional FC. To obtain a truth dataset, the bright-field and dark-field images of the corresponding cells are acquired by an IFC. Then we apply a kNN classification method to obtain the cell morphology and biophysical features in conventional FC data. For this purpose, we need a predicted light scattering dataset for the cell structures that are observed in the experimental environment. The light scattering pattern is calcu-lated by using the MBIE technique, and a normalization procedure is applied to calculate the predicted FSC-A and SSC-A. Finally, we obtain Discocyte/Stomatocyte/Echinocyte (D/S/E) subpopula-tions for the experimental condisubpopula-tions at the single-cell level. . . . 101
4.2 Representative microscopy and cytometry images of the murine
RBCs at different tonicity conditions. (a) Bright-field micrographs of RBCs were obtained using Keyence BZ-X710 fluorescence mi-croscope (Keyence Corporation of America) with an objective of magnification 40X. Scale bar, 10 µm. (b) Representative images of morphological RBC subtypes obtained from bright-field (BF/Ch-01) and dark-field (SSC/Ch-06) channels in IFC, generated using the IDEAS data analysis software. BF objects were masked us-R ing an Adaptive-Erode mask as %89. Scale bar, 7 µm. . . 103 4.3 2-D cross sections of Discocyte/Stomatocyte/Echinocyte
(D/S/E)-shaped RBC models obtained from (2.22). (a) Discocyte: (m= 2, α= 1, β= 8, γ=8), (b) Stomatocyte: (m= 2, α= 1.5, β= 4, γ=24), and (c) Echinocyte: (m= 7, α= 3, β= 6, γ=6). . . 104 4.4 The simulated optical signature of single RBCs. The effect of shape
variations on light scattering pattern: angular dependence. The intensity (in arbitrary units, a.u.) corresponds to the TM-polarized component to the scattering plane. . . 105
LIST OF FIGURES xx
4.5 The difference plots of SSC-A scattering cross-section patterns between Discocyte and b) Stomatocyte (upper side), and c) Echinocyte-shaped RBC models (lower side); Left : at nr= 1.42
and 5.5 ≤ r ≤ 7.0µm conditions, and Right : at r = 6.0µm and 1.38 ≤ nr ≤ 1.42 conditions. . . 106
4.6 FSC/SSC-based subpopulation characterization of murine RBCs
in the Isotonic solution. (a) We used a forward scatter height (FSC-H) versus forward scatter area (FSC-A) graph to discrimi-nate doublets from individual population in the conventional FC data. The percentage of singlet RBCs is 79.67%. The scatter histogram plots show the SSC-A pattern as a function of cell ori-entation and diameter based on bright-field and dark-field images in IFC. (b-c) We found cellular refractive index values making the comparison between experimental data obtained from IFC and pre-dicted scattering data computed by the angle-resolved light scat-tering technique. Red points indicate the experimental data for stomatocyte-shaped RBCs at 6.5µm and 7µm diameters. (d) The box plots show the relative error values between the predicted and measured SSC-A values for each orientation step. The minimum of mean relative error values was observed at nr= 1.39, and nr=
1.42 at 6.5µm and 7µm diameters, respectively. (e) Quantification of predicted and measured morphological RBC subpopulations in Isotonic tonicity solution. . . 109
LIST OF FIGURES xxi
4.7 FSC/SSC-based subpopulation characterization of murine RBCs
in the Hype3 solution. (a) We used a forward scatter height
(FSC-H) over forward scatter area (FSC-A) graph to discriminate dou-blets and debris in conventional FC data. The percentage of singlet RBCs is 82.89%. We observed that there was variability in the de-gree of the intensity shift on the SSC-A pattern obtained from the conventional FC data. Echinocyte-shaped RBC structures result in an increase in the values of diameter and SSC-A pattern in IFC. (b-c) Representative refractive index spectra making the compar-ison between experimental data obtained from IFC and theoreti-cal data predicted by the angle-resolved light scattering technique. Red points denote the experimental data for echinocyte-shaped RBCs at 6.5µm and 7µm diameters. (d) The box plots show the relative error rates between the predicted and measured SSC-A values for each orientation step. The minimum of mean relative error parameters was observed at nr= 1.38 and nr=1.40 at 6.5µm
and 7µm diameters, respectively. (e) Quantification of predicted and measured morphological RBC subtypes in Hypertonic tonicity solution. . . 110 4.8 The measured statistics of various cell types for the case of murine
RBCs at different tonicity conditions. (a-d) The shape quantifi-cation features, such as (a) aspect ratio (minor axis/major axis), (b) shape ratio (thickness minimum/length), (c) elongation index (height/width) and (d) circularity were obtained by bright-field im-ages in IFC. Bars represent the minimum to maximum range for the case of sample scenarios. (*P <0.33, **P <0.02, ***P <0.001, and n.s. P <0.12 using one-way ANOVA with Bonferroni post-test method). The scenarios used in the statistical analysis are as fol-lows: Hypo (ionic strength: 45.01mM, and osmolarity: 146mOsm); Ist (ionic strength: 94.98mM, and osmolarity: 146mOsm); Hype (ionic strength: 243.30mM, and osmolarity: 146mOsm). . . 111
LIST OF FIGURES xxii
4.9 Label-free classification of subpopulation contents of murine RBCs in the conventional FC data. (a) Angle-resolved light scattering classification technique allows for label-free classification of sub-population contents based on only the optical signature of RBCs in the conventional FC data. (b) The bar graphs show the percent of predicted subpopulations for each experimental scenario. (c) The predicted and measured statistics of various cell types for the case of different tonicity solutions in murine RBCs. . . 113
List of Tables
1.1 Composition and content of blood [13]. . . 5 1.2 Global anaemia prevalence and number of individuals affected in
the worldwide [14]. . . 8 1.3 Normal ranges for clinical laboratory tests used to diagnose and
classify anemia [15–17]. . . 12 1.4 Various types and interpretations of RBCs observed in the
periph-eral blood smear technique [18]. . . 14 2.1 Overview of features of IFC data file types. . . 50
2.2 Names, descriptions and parameters of the masks available on
IDEAS application. . . 56R 2.3 Names, descriptions and parameters of the features available on
IDEAS application [9]. . . 60R 2.4 Names, descriptions and parameters of the features available on
IDEAS application (continued) [9]. . . 61R
3.1 The quantitation of number of SS-RBCs that are measured for
each reaction time of deoxygenation, obtained from the criterion of features used in this study. (Reprinted, with permission, from “Image-Based Flow Cytometry and Angle-Resolved Light Scatter-ing to Define the SicklScatter-ing Process,” by P. Goktas, I.O. Sukharevsky, S. Larkin, F. A. Kuypers, O. Yalcin and A. Altintas, Cytometry Part A, 2019) . . . 79
LIST OF TABLES xxiv
3.2 The quantitation of percentage of SS-RBCs that are measured for each reaction time of deoxygenation, obtained from the criterion of features used in this study. (Reprinted, with permission, from “Image-Based Flow Cytometry and Angle-Resolved Light Scatter-ing to Define the SicklScatter-ing Process,” by P. Goktas, I.O. Sukharevsky, S. Larkin, F. A. Kuypers, O. Yalcin and A. Altintas, Cytometry Part A, 2019) . . . 80
3.3 The quantitation of morphological/physical parameters that
are measured for each reaction time of deoxygenation, ob-tained from the criterion of features used in this study. (for Shape Ratio feature with the use of the default M01 mask (Shape RatioDef ault (M 01) M ask)) (Reprinted, with permission,
from “Image-Based Flow Cytometry and Angle-Resolved Light Scattering to Define the Sickling Process,” by P. Goktas, I.O. Sukharevsky, S. Larkin, F. A. Kuypers, O. Yalcin and A. Altintas, Cytometry Part A, 2019) . . . 84
3.4 The quantitation of morphological/physical parameters that
are measured for each reaction time of deoxygenation, ob-tained from the criterion of features used in this study. (for Shape Ratio feature with the use of user-defined Range mask (Shape RatioCustom M ask)) (Reprinted, with permission, from
“Image-Based Flow Cytometry and Angle-Resolved Light Scatter-ing to Define the SicklScatter-ing Process,” by P. Goktas, I.O. Sukharevsky, S. Larkin, F. A. Kuypers, O. Yalcin and A. Altintas, Cytometry Part A, 2019) . . . 85
LIST OF TABLES xxv
3.5 The quantitation of morphological/physical parameters that are
measured for each reaction time of deoxygenation, obtained from the criterion of features used in this study. (for Shape Ratio feature with the cut-off of below 0.5 on the combination of Default and user-defined Range mask (Shape RatioCut−of f level, Custom M ask))
(Reprinted, with permission, from “Image-Based Flow Cytometry and Angle-Resolved Light Scattering to Define the Sickling Pro-cess,” by P. Goktas, I.O. Sukharevsky, S. Larkin, F. A. Kuypers, O. Yalcin and A. Altintas, Cytometry Part A, 2019) . . . 86
3.6 The quantitation of morphological/physical parameters that
are measured for each reaction time of deoxygenation, ob-tained from the criterion of features used in this study. (for Sickle Index feature with the use of user-defined Range mask (Sickle IndexCustom M ask)) (Reprinted, with permission, from
“Image-Based Flow Cytometry and Angle-Resolved Light Scatter-ing to Define the SicklScatter-ing Process,” by P. Goktas, I.O. Sukharevsky, S. Larkin, F. A. Kuypers, O. Yalcin and A. Altintas, Cytometry Part A, 2019) . . . 87 4.1 Ionic strength and osmolarity of the working suspension solutions,
Chapter 1
Introduction
The morphological, biophysical and biochemical properties of cells play a major role in both, fundamental research and medical diagnostics [20]. Optical technolo-gies for the examination of cells include various microscopy techniques [21–23], conventional and image-based flow cytometry [24–26], spectroscopic [27] and red blood cell (RBC) deformability [28, 29] measurements, and also optical trapping and streching techniques [30]. Many applications of optical techniques to retrieve and analyze cells usually rely on methods requiring specific labels with fluorescent dyes or genetic encoding of fluorescent proteins [31, 32], to identify the desired cells. This labelling process could be frequently complex and time-consuming processes. Moreover, the labels used in the experiment are costly materials.
Thus; label-free, high-throughput classification and detection of cellular infor-mation at the single-cell level are invaluable for medical diagnostics. Morpho-logical/biophysical alterations in single biological cells have been associated with hematologic diseases, such as sickle cell anemia [33]. Currently, a major chal-lenge in many clinical laboratories, quantification of cellular information at the single-cell level requires complex laboratory sample preparation procedures [34].
Some paragraphs in this chapter are reprinted, with permission, from “Image-Based Flow Cytometry and Angle-Resolved Light Scattering to Define the Sickling Process,” by P. Goktas, I.O. Sukharevsky, S. Larkin, F. A. Kuypers, O. Yalcin and A. Altintas, Cytometry Part A, vol. 95, no. 5, pp. 488-498 (2019).
For example, the blood smear procedure of characterizing the morphology of RBCs and white blood cells (WBCs) involves laborious manual preparation and visual inspection of cross-section structures by light microscopy. Microscopy does not provide the information to describe large numbers of highly heterogeneously shaped RBCs observed in a typical blood film [35]. The blood smearing technique might also lead to alter morphological RBC structures especially for irregularly or abnormally shaped cells, and induces error-prone procedure for the classification of the “true” morphology profile of RBCs. Moreover, qualitative rapid diagnos-tic tests, instead, do not require extensive sample preparation, provide detection limits comparable to microscopic thick smear analysis, and provide highly sen-sitive results within 20 minutes [36]. However, the lack of quantitative cellular information determination and the high costs per test are significant limitations for diagnostics at the single-cell resolution.
In contrast to light microscopy, conventional flow cytometers (FCs) can detect cells of interest that are fluorescently labeled and provide automatic cell sorting by capturing the scattered light and fluorescence intensity values [25]. On the case of these optical mesaurement methods, many fall within the spectrum of linear optics and elastic light scatttering that they rely on the complex refractive index of the cells. However, the optical signature of conventional FCs is only based on the light scattered from individual particles at fixed observation angles (e.g.; forward (FSC-A) and side (SSC-A) scattering), and yields limited information about morphology and biophysical properties of cells.
Apart from these conventional methods, alternative label-free approaches for hematologic diseases detection and characterization have been explored with promising results. With the combined advantages of optical microscopy and flow cytometry, image-based flow cytometry (IFC) has quickly become an established tool for performing cytometric analysis in diverse areas of biology including mi-crobiology, immunology, and stem cell biology areas [26, 37]. The availability of image data produced by IFC is well aligned with the pressing need for pro-gressively larger biomedical datasets for efficient and accurate data analysis with the help of computational tools (e.g., compressive imaging, data mining, ma-chine/deep learning) to make better decisions in biomedical research and clinical
settings. The field of IFC is expected to grow further in the next decade or so (see Figure 1.1) [1]. It is expected that there are several driving factors that push the frontier of IFC and expand its utility in diverse areas of biology and medicine. However, the data analysis procedure in IFC could be frequently complex and time-consuming processes.
This chapter is composed of three major subjects: overview of red blood cells (RBCs), optical techniques to examine RBCs and optical properties of blood and blood components, and light scattering methods and image processing pro-cedures to analyze scattering characteristics and cellular information of RBCs. Generally, the introduction chapter reviews some aspects that movitave and re-veal the scientific interest in RBCs, also known as erythrocytes, over the last decades. To begin with, the role and composition of blood, and functional prop-erties of RBCs are discussed. Subsequently, an overview on morphology and on main properties of hematological diseases, such as sickle cell anemia is given in the context of morphological alterations in RBCs. The second section provides a brief introduction to the optical techniques to examine RBCs. Qualitative observations and quantitative measurements for RBCs in light microscopy, conventional flow cytometry and image-based flow cytometry are summarized. The third section shows that the clarification and better understanding of the experiements per-formed on RBCs requires numerical studies and necessitates a reasonable compu-tational cell classification framework based on a light scattering model with the use of the optical technique’s data. The section is ended by an overview on opti-cal properties of blood and blood components, and on existing numeriopti-cal models. The objectives and outline of this thesis are provided in the final section.
1.1
Blood and Red Blood Cells (RBCs)
Blood is a body fluid that is responsible for vital tasks in the human body. The functions of the blood include transport of nutrients, oxygen and waste products such as carbon dioxide out of the organism to expulsion in the kidneys, lungs or spleen; immune function; distribution of heat throughout the organism
Figure 1.1: Future prospect of the field of image-based flow cytometry, taken from [1].
and blood clotting. The average human has about 4.5-6 liters of blood in his or her body, which figures out approximately 6-10% of his or her body weight.
Blood is composed of blood elements (RBCs, WBCs and platelets) suspended in a liquid [38, 39]. Blood components can be seperated from blood plasma using centrifugal force. The cellular components typically make up about 45% of the whole blood volume, and the liquid as the major part of the blood, called blood plasma makes up 55%. The liquid consists of dissolved proteins, such as serum albumins, fibrinogen, hormones and nutrients. Below the plasma layer is the buffy coat layer, which consists of WBCs or leukocyte and platelets or thrombocytes, and makes up less than 1% of the total blood volume. WBCs can be differentiated into Lymphocytes, Monocytes, Granulocytes including Neutrophil, Eosinophil, and Basophil. The remaining part of the whole blood contains RBCs which make up around 45% of the blood. The volume of RBCs in a donor sample of the blood is named as hematocrit (Ht). Ht values change depending on sex, environment, and health status - in men, the value ranges about 44 ± 5% of the blood volume, and in women about 40 ± 4% of the blood volume. Table 1.1 presents information on the content of blood [13].
Table 1.1: Composition and content of blood [13].
Cell Name Amount (µL−1) Size (µm) Shape Number Fraction RBC 5.1 × 10⁶ 7.2-8.4 Biconcave 0.94 WBC 7000 ∼ Spherical 1.3 × 10⁻³ Lymphocyte 2185 6-8 4.0 × 10⁻⁵ Neutrophil 4150 9-16 7.6 × 10⁻⁵ Eosinophil 165 12-17 3.0 × 10⁻⁴ Basophil 44 10-14 8.1 × 10⁻⁵ Monocyte 456 12-20 8.4 × 10⁻³ Platelets 350 000 2-3 Biconvex 6.4 × 10⁻²
Red Blood Cells (RBCs)
RBCs or erythrocytes are the most common cellular constituents of blood, and they occupy more than 99% of the particulate matter in blood and 40 to 45% of blood by volume. Mature RBCs are anucleate cells established by a membrane enclosing the fluid and cytoplasm. The purpose of RBCs is to deliver oxygen
to tissues and CO2 back to the lungs. RBCs travel more than 200 km in the
circulatory system during their around 100 days life span. 1 mm3 or 1 µl of
blood contains 4 to 6 million RBCs.
In their resting state, RBCs have a biconcave shape with a typical diameter of 6-8 µm and a thickness of 2-3 µm. Evans and Fung [2] observed that an average-sized RBC can more accurately be described by a biconcave-shaped model (see Figure 1.2). Other models introduced by the Kuchel and Fackerell [40], Yurkin [41], Borovoi [42] and Skalak [43] have also been used in the literature.
RBCs membrane is a complex structure composed by a phospholid bilayer, an internal cytoskeletal network and membrane proteins (see Figure 1.3). The membrane and lipid layer skeleton help to maintain the biconcave shape of the cell at rest. Briefly, the lipid layer provides with the membrane its resistance against bending while the cytoskeleton provides with the membrane its resistance against shear deformations [3].
RBCs are known to exist in other cell structures than the biconcave shape due to genetic or pathological conditions. Figure 1.4 represents a sequence of distinct
subtypes of RBCs [4].
Figure 1.2: Cross sectional shapes of the average RBC and other cellular infor-mation as reported by Evans and Fung [2].
Figure 1.3: Schematic representation of the red blood cells membrane, taken from [3].
Figure 1.4: 2-D cross sections of Discocyte-Stomatocyte-Echinocyte RBCs, taken from [4].
Anemia
Anemia is a manifestation of the insufficient capacity of oxygen carrying RBCs in the body’s organ [44]. It has numerous causes including iron deficiency, nu-tritional deficiencies for folate, vitamin B12, chronic inflammations and parasitic infections which are rather straightforward to treat and cure, to rarer genetic causes, such as sickle cell or beta thalassemia diseases, which result in chronic anemia that requires frequent monitoring.
World Health Organization Global Database on Anemia shows that over two billion people suffer from anemia globally [14], more than ten million people die of all kinds of diseases caused by anemia every year. The report provides a comprehensive and comparable assessment of global anaemia prevalence and number of individuals affected. Anemia have an effect on 1.62 billion people (95% Confidence Interval (CI): 1.50–1.74 billion), which corresponds to 24.8% of the population (95% CI: 22.9–26.7%). The highest occurence is in preschool-age children (as 47.4%, 95% CI: 45.7–49.1%), and the lowest occurence is in men (as 12.7%, 95% CI: 8.6–16.9%). However, as outlined in Table 1.2, the population group with the greatest number of individuals affected is non-pregnant women category (as 468.4 million, 95% CI: 446.2–490.6 million) [14].
Table 1.2: Global anaemia prevalence and number of individuals affected in the worldwide [14].
Population group Prevalence of anaemia Population affected
Percent 95% CI Number (millions) 95% CI Preschool-age children 47.4 45.7-49.1 293 283-303 School-age children 25.4 19.9-30.9 305 238-371 Men 12.7 8.6-16.9 260 175-345 Non-pregnant women 30.2 28.7-31.6 468 446-491 Pregnant women 41.8 39.9-43.8 56 54-59 Elderly 23.9 18.3-29.4 164 126-202 Total population 24.8 22.9-26.7 1620 1500-1740
While the onset of anemia can be acute or chronic, hemoglobin concentra-tions in patients have been found to fall below the 95th percentile of healthy
populations due to several reasons such as: blood loss or reduced production of hemoglobin [45]. Prolonged and uncontrolled anemia have been observed to cause manifestations of fatigue, low immunity, insomnia and dementia [46]. The ability to measure hemoglobin (Hb) concentration in anemic patients noninvasively and continuously has significant potential to assist hemoglobin monitoring, improve the detection of acute anemia, and avoid the complications, expense and pain associated with invasive blood draws. Therefore, the most efficient way to screen out anemia patients is desirable.
The findings obtained in the patient’s anamnesis, physical examination and laboratory findings are evaluated to reach a definitive opinion in an anemic pa-tient. Detection of anemia involves either anemia diagnosis or screening, and both require different degrees of measurement accuracy. Clinically, subjective assess-ment of pallor of the conjunctiva, nail beds, tongue and/or palms have been used as clinical signs indicating the presence of anemia, with a wide range of estimated sensitivities and specificities [45, 46]. Although the finding of pallor on clinical examination is associated with anemia, inter-observer variability in the clinic is high and definitive diagnosis of anemia requires a blood sample. In the clinic, the gold standard for anemia diagnosis is ex-vivo measurement of Hb concentration in whole blood via a complete blood count (CBC). However, these procedures are invasive and painful, can cause infection of patients and healthcare workers, and generate biohazardous waste [47].
In addition, there exist a number of semi non-invasive methods to measure Hb concentration. HemoCue (HemoCue Hb 201+, Angelholm, Sweden) is a portable device that uses an azide-methemoglobin reaction and photometric absorbance to measure Hb level outside the laboratory [48]. It can produce results in about a minute by dropping small amounts of capillary blood samples (≈10 µL) into disposable containers. However, these semi invasive devices used in non-laboratory environments are not sensitive for personalized medical purposes and for the differentiation of anemias in the rating and follow-up of the disease [49]. Generally, the shortcomings of conventional laboratory techniques need to draw blood which increase pain of patients and cause the spread of infectious diseases of the blood and body fluids easily; feedback is slow, and it is difficult to achieve
continuous real-time monitoring. Thus, there is an increasing interest and re-search on non-invasive methods in the assessment of anemia.
There exist a number of non-invasive optical methods to indirectly measure the amount of Hb in blood. These include photoplethysmography [50], reflectance spectroscopy [51] and fluorescence spectroscopy of tissue [52]. These non-invasive systems can be relatively expensive and are difficult to move from place to place which makes them all the more inaccessible to the geographies. To ad-dress this issue, Wang et al. presented a smartphone-based application named as HemaApp [53]. They used incandescent and LED lights to enlighten the finger-tip and analyzed RGB (Red, Green, and Blue) pixels from the captured video. Among these, the majority have involved optical measurement of blood in the fingertip. These non-invasive methods are less accurate than the gold standard technique and represent trade-offs between invasiveness, time, cost and accuracy. We have provided comparison of currently existing optical hematology techniques in the clinic as highlighted in Figure 1.5. Details about optical hematology tech-nologies to examine RBCs are provided in Section 1.2.
The classification of anemia is based on mean corpuscular volume (MCV) and mean corpuscular hemoglobin concentration (MCHC) of CBC. The Hb is part of the CBC report, which also consists of the WBC and RBC counts, Ht, platelet count and indices. The most useful parts of the CBC are the Hb and MCV (see Table 1.3) [15–17]. The MCV is the average volume of RBCs in a specimen. The MCV parameter is used to classify the anemia into three sub-groups as microcytic (MCV < 80 fl), normocytic (MCV, 80 - 100 fl), or macrocytic (MCV > 100 fl), which helps to guide diagnosis and classification of anemia [5, 18] (see Figure 1.6). In addition, the changes in cell diameter, shape and Hb content can be used to differentiate both microcytic and macrocytic cells as the patterns of some abnormal RBCs from normocytic RBCs [18] (see Table 1.4). Specifically, high or low MCV values may indicate the presence of microcytic and macrocytic cells, respectively. However, MCV measurement techniques are usually inadequate for a reliable diagnosis, and so blood smears are neeeded. Nevertheless, in the clinic, peripheral blood smears remain as the gold standard for diagnosis microcytes and macrocytes, as for sickle cells and spherocytes. Based on our results provided
Figure 1.5: Comparison of curren tly existing optical hematology tec hniques in the clinic.
in the thesis, we have proposed a fast and reliable measurement and analysis technique to detect and classify RBC subtypes in a blood sample for the purpose of label-free, high-throughput classification and detection of cellular information at the single-cell level.
Table 1.3: Normal ranges for clinical laboratory tests used to diagnose and classify anemia [15–17].
White blood cells (WBCs) 5000 - 10 000/mm3
Red blood cells (RBCs) Male: 4.7 − 6.1 × 10
12/L Female: 4.2 − 5.4 × 10¹²/L Hematocrit (Ht) Male: 42% - 52% Female: 37% - 47% Hemoglobin (Hb) Male: 13 - 17.4 g/dL Female: 12 - 16 g/dL
Mean corpuscular volume (MCV) 80 - 100 fL
Reticulocyte count 0.5 % - 1.5%
Red cell distribution width (RDW) 11 % - 14.5%
Iron Male: 80 - 180 mcg/dL
Female: 60 - 160 mcg/dL
Total iron binding capacity 250 - 460 mcg/dL
Ferritin Male: 12 - 300 ng/mL
Female: 10 - 150 ng/mL
Folic acid 5 - 25 ng/mL
Vitamin B12 160 - 950 pg/MI
Figure 1.6: Classification of anemia [5].
T able 1.4: V arious typ es and in terpretations of RBCs observ ed in the p eriphera l blo o d smea r tec hniqu e [18]. The patterns of some abnormal RBCs Prop ert y Macro cyte Larger than nor mal (> 8.5 µ m diameter) Micro cyte Smaller than n ormal (< 7 µ m diameter) Sphero cyte Loss of cen tral pallor, stains more densely , often micro cytic. Ellipto cyte Ov al to cigar sha p ed. Hereditary ellipto cytosis and certain anemias (particularly vitamin B12 and folate defici ency) T arget cell Hyp o chromic with cen tral “target” of hemoglobin. Liv er disease, thalassemia and HbD. Stomato cyte Slit-lik e area of cen tral pallor in RBC. Liv er disease, malignancies and hereditary stomato cyt osis. Acan tho cyte Fiv e to ten spicules of v arious lengths and at irregular in terv als on surface of RBCs. Ec hino cyte Ev enly distributed spicules on surface of RBCs, usually 10-30. Uremia, p yruv ate kinase deficiency and p eptic ulcer. Sic kle cell Elongated cell w ith p oin ted ends. HbS a nd certain typ es of HbC.
Sickle Cell Anemia
Sickle Cell Anemia, an inherited RBC disorder, was defined as the first molecu-lar disease [54]. The simple point mutation in beta globin generates a Hb molecule that polymerizes under low oxygen tension changing the discoid morphology of the RBC to the shapes that gave the disorder its name, an altered the cell rigid-ity, altered cell surface, adhesion, a short life span, and intravascular hemolysis and inflammation [6, 7, 33, 55–58] (see Figure 1.7). The polymerization of de-oxygenated hemoglobin S (HbS) promotes RBC sickling. Hence, the process of morphology change (sickling) of RBC from sickle cell patients (SS-RBCs) is the fundamental pathophysilogical hallmark of the vasculopathy, and organ damage that defines sickle cell disease (SCD).
Kaul et al. revelaed four subtypes of sickle RBCs in terms of their rheological and hemodynamic characteristics [59]. Figure 1.8 presents four subtypes of sickle RBCs as I = reticulocytes, II = discocytes, III = dense discocytes and IV = ir-reversibly sickled cells under oxygenated and deoxygenated conditions. However, throughout this thesis, we have characterized the RBC morphological profile as discocyte, sickle, elongated, as well as irregularly or abnormal RBC shaped cells, including echinocytes, holly-leaf, and granular structures of SS-RBCs upon de-oxygenation, obtained from IFC’s bright- and dark-field data [12].
Sickled RBCs have reduced deformability and increased adhesiveness to the vascular wall, hence triggering frequent and recurrent vaso-occlusions. Although sickling is a reversible process upon re-oxygenation, RBC deformability remains reduced even when sickle cells are normally oxygenated. This reduction in RBC deformability under normal oxygen levels can be due to the persistence of HbS polymers, the low solubility of HbS and RBC membrane damages. The decreased deformability and increased fragility of sickled RBCs are at the origin of the en-hanced hemolysis in SCD patients [60–63]. Perhaps more importantly, the rate by which sickling takes place is significant. A decrease in the rate of polymerization-induced sickling is thought to have a profound effect on the clinical outcome of patients.
Figure 1.7: Hemoglobin S and red ce ll mem brane changes. P olymerization of sic kle hem oglobin under lo w o xyg en tension changes red cell morphology , separates the lipid bila y er from the mem brane sk eleton, tak en from [6].
Figure 1.8: F our subt yp es of SS -RBCs. S canning electron microscop y images of the four subt yp es of sic kle RBCs in o xygenated and do xygenated conditions, tak en from [7].
There are unfortunately, only a few methods to cure sickle cell patients [33]. Firstly, the blood and bone marrow transplant are the main encourage hope for most patients. However, most patients who have sickle cell disease either are too old for a transplant or do not have a relative who is a good enough genetic match to be a donor. Therefore, most sickle cell disease transplants are currently performed in children who have had complications such as strokes, acute chest crises, and recurring pain crises and generally use a matched donor. However, only about one in 10 children who have sickle cell disease have a matched donor without sickle cell disease in their families. Therefore, even if one of the most usual methods is transplantation, it is not a method that can target the entire whole patient population. There is another treatment method that is focused on increasing hemoglobin F (HbF) concentration in SCD patients by increasing nitric oxide levels. Although the mechanism of the drug is not clear, hydroxyurea or hy-droxycarbamide causes guanyl cyclase activation with ascending cyclic guanosine monophosphate (cGMP). Moreover, the reagent causes gamma globulin gene and syntheses HbF. Increased HbF, which is not affected by mutated HbS, respon-sible for sickle cell disease, provides some protection against the effects of HbS. However, hydroxyurea can cause the white cell count or platelet count to drop. So, it may result in worsen anemia. These side effects usually go away quickly if a patient stops taking the medication. In addition to them, it is still unclear whether hydroxyurea then causes long-term problems in lifelong sickle cell pa-tients. Thus, our proposed measurement and analysis methodology could assist in the evaulation of treatments that include the use of anti-sickling agents, gene threpay-based hemoglobin modifications, as well as other approaches to improve the quality of life of sickle cell patients [12].
1.2
Optical Hematology Technologies to
Exam-ine RBCs
1.2.1
Light Microscopy
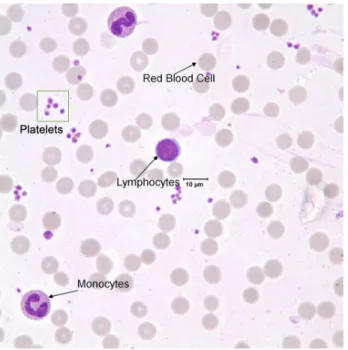
A conventional optical microscopy combines a light source and optics that are used to illuminate the specimen under observation, and an objective lens, which collects light transmitted through and/or scattered, reflected and/or emitted through sample [24]. Bright-field microscopy is the simplest of a range of tech-niques used for illumination of samples in light microscopes. To capture images with suitable contrast and resolution, samples are typically fixed and smeared [64]. The sample microscope image of the whole blood usually consists of three com-ponents, at least: the platelets, the RBCs and WBCs, as shown in Figure 1.9. This has been performed in many clinical labs and settings to provide additional information to the traditional complete blood count test.
Figure 1.9: Blood smear components. A sample microscopy image of the whole blood.
An observer at a light microscope moves different cells in the slide into and out of the field of view under any circumstances, much slower than cells are transported through the observation region. For example, the blood smear pro-cedure of characterizing the morphology of RBCs and WBCs involves laborious manual preparation and visual inspection of cross-section structures by light mi-croscopy. Microscopy does not provide the information to describe large numbers of highly heterogeneously shaped RBCs observed in a typical blood film [35]. The blood smearing technique might also lead to alter morphological RBC structures especially for irregularly or abnormally shaped cells, and induces error-prone pro-cedure for the classification of the “true” morphology profile of RBCs. The lack of quantitative cellular information determination and the costs per test are a significant limitation for diagnostics at the single-cell resolution.
1.2.2
Convetional Flow Cytometry
In flow cytometry (FC), the measurements are made as biological cells flow through the instrument in a fluid stream [65]. FC is most commonly used for both benign and malignant hematologic processes, inlcuding diagnosis, treatment plans and monitoring of the disease [66, 67]. It consists of four systems including fluidics, optics, electronics, and computer interface. In the first step as fluidics, a cell passing through the chamber is typically illuminated for somewhere around ten seconds. As the sample enters the chamber, it is covered by a sheath fluid that encloses the sample stream to the center of the chamber [68]. The labeled cells in liquid suspension pass individually and rapidly through a laser beam sensing area [65]. Each cell in the blood sample pass through the laser source(s) in the optics system. Optics comprises the light-amplication source as the laser, which emits light of a specified wavelength. Once the suspension passes the laser, the scattering detection are made. Generally, light is scattered in a manner that is dependent on the cellular information as the size and granularity [65]. The scat-tering can be categorized into forward (FSC) and side (SSC) scatter [24,69]. FSC is the light that scatters in the same direction as the laser. The FSC detector measures the light scattered away from the cell surface in an angle between 0.5o
and 10o. SSC is the light that is scattered at a 90o angle from the direction of
the laser and is proportional to the granularity and internal heterogenity of the cells. In order to capture both forward and side scattered light, one detector is positioned in line with the laser source, while the other detector lies orthogonal to the laser source. The detector is usually a photomultiplier tube (PMT) as the electronics part of the flow cytometry. PMTs are semiconductors that produce electrical current based on the light detection [65,70]. The data and graphic anal-ysis of the blood sample can be interpreted in one-, two-, or three-dimensional images with the gating procedure [65]. The main issue in the conventional FC is that the optical signature of conventional FCs is only based on the light scattered from individual particles at fixed observation angles (e.g.; FSC and SSC scatter-ing), and yields limited information about morphology and biophysical properties of cells. Figure 1.10 provides a schematic of the flow cytometry system [8].
Figure 1.10: The configuration of the flow cytometry. (A) The flow cytometry’s hydrodynamic force, created by sheath fluid, passes cell suspensions through a laser bean sensing area, (B) Simplified illustration of flow cytometry optical sys-tem, taken from [8].
1.2.3
Image-based Flow Cytometry (IFC)
In 2005, the first image-based flow cytometry was introduced by Anmis Cor-poration, Seattle, WA, USA, part of Millipore Sigma [9]. With the combined advantages of optical microscopy and flow cytometry, IFC has quickly become an established tool for performing cytometric analysis in diverse areas of biology including microbiology, immunology, and stem cell biology areas [26, 37]. The availability of image data produced by IFC is well aligned with the pressing need for progressively larger biomedical datasets for efficient and accurate data analysis with the help of computational tools (e.g., compressive imaging, data mining, machine/deep learning) to make better decisions in biomedical research and clinical settings.
With the IFC, researchers have captured and analyzed bright- and dark-field and fluorescent images of cell populations [71]. IFC provides information re-garding cellular structures, such as cell size, shape, orientation, signal intensity, location and texture for each cell with high statistical validity through bright- and dark-field channels, which require no staining procedures, and fluorescence chan-nels [72]. Generally, IFC comprises a bright-field and laser light source placed, in line with and orthogonal to one microscope objective. Objects passing through the ImageStream are illuminated in different directions by lasers and/or bright-field LEDs. Light emitted from the object is focused through an objective lens and relayed to a spectral decomposition element, which divides the light into six spectral bands located side-by-side across a charge-coupled detector, as shown in the Figure 1.11 [9]. Thus, six image channels are available to collect the signals of different spectral bands for each camera. Two channels are used for bright-field images, while one channel is used for SSC images. Figure 1.12 presents infor-mation about the spectral ranges of each channel for the IFC [9]. ImageStream system uses time delay integration (TDI) technique that light is detected in the first pixel row and transferred to the pixel below in exact synchrony with the velocity of the cell as it goes streaming by. In the TDI, light is integrated over the entire height of the detector to achieve high photonic sensitivity. Figure 1.13 provides an illustration of the TDI method [9].
Figure 1.11: Simplified il lustration of image-based flo w cytometry system , tak en from [9].
Figure 1.12: Sp ectral features of IF C, including channel bandwidths and applicable dy es for a v ailable lasers, tak en from [9].
Figure 1.13: Simplified illustration of the TDI method, taken from [9].
Cell segmentation methods such as CellProfiler [73], Fiji [74], CellSegm [75] and deep convolutional neural networks (dCNNs) [76], as well as clustering algorithms based on k-means, t-SNE and SPADE techniques [77] have been used to analyze cellular structures in the data obtained by light microscopy or flow cytometry. However, the performance of these algorithms to define morphology depends on proper initiation of labeled parameters by hand, and extensive algorithm training, of a large number of bright- and dark-field images. This has not been shown to be practical for the assessment of large populations of RBCs and WBCs with a highly heterogeneous morphology that is different from sample to sample.
![Figure 1.1: Future prospect of the field of image-based flow cytometry, taken from [1].](https://thumb-eu.123doks.com/thumbv2/9libnet/5670449.113535/29.918.281.677.181.490/figure-future-prospect-field-image-based-cytometry-taken.webp)
![Figure 1.2: Cross sectional shapes of the average RBC and other cellular infor- infor-mation as reported by Evans and Fung [2].](https://thumb-eu.123doks.com/thumbv2/9libnet/5670449.113535/31.918.199.775.208.725/figure-cross-sectional-shapes-average-cellular-mation-reported.webp)
![Figure 1.3: Schematic representation of the red blood cells membrane, taken from [3].](https://thumb-eu.123doks.com/thumbv2/9libnet/5670449.113535/32.918.310.653.189.534/figure-schematic-representation-red-blood-cells-membrane-taken.webp)
![Table 1.2: Global anaemia prevalence and number of individuals affected in the worldwide [14].](https://thumb-eu.123doks.com/thumbv2/9libnet/5670449.113535/33.918.171.798.803.1027/table-global-anaemia-prevalence-number-individuals-affected-worldwide.webp)
![Table 1.3: Normal ranges for clinical laboratory tests used to diagnose and classify anemia [15–17].](https://thumb-eu.123doks.com/thumbv2/9libnet/5670449.113535/37.918.211.750.362.768/table-normal-ranges-clinical-laboratory-diagnose-classify-anemia.webp)
![Figure 1.14: Complex refractive index spectra of oxygenated and deoxygenated RBCs, taken from [10].](https://thumb-eu.123doks.com/thumbv2/9libnet/5670449.113535/52.918.206.762.183.531/figure-complex-refractive-index-spectra-oxygenated-deoxygenated-rbcs.webp)