,ii; > ... ? ·}
0
Ш V •fr; » ίη .Ι Іі'" "· ^ѵ ; шо
л ху » -;»ч 1 ‘“іт .·< .« 4* 1 і’м '-=1 , í·· ·^ ίΛİÎ;
о
Гі
!і
Q tí f'í * * sî ;* ѵ 4^І ' -ä [ ш ç„ . U ! :¡ * .íf ^ . .. jíÜ b ·* '* »-·. ‘‘• 'jt * I L · О î } ' ί / Ş Ш lili ы ш .М Г І ω 1 < 1 0 о и \ і}.. .. ■„ ff 5 Л ,І ; ï :; İ Ü ' x : ь -! :· ; < 1 к ·· '· а .. ,^ · Ή î^ u . f *■ ; : í il· ;;; Ί •'^ Ч ч о ш U .. . f' f f I I 1 .. i ‘ i ‘ U. .< iw г i.; > i;* ':i \
,
!:; : < j Ítl 'í i· * 4 ; I i: ;: : y .} 5 ·, . f tr k |.. . * 'p î f » П . 3 .. ’ ■44 3# i U -f T U í ''^ ,|i; > ;■ );;о
iV j C h „,. ,1 ^ i 1 ■ ·■ · ; ( « л;! il .) !! !) * tí 1 .U m ‘э ö : ;о
ч;У ;^ V i [ r .: i iî :t i if Г ··COLOR NAMING
A THESIS SU B M ITTE D T O TH E D E P A R T M E N T OF IN T E R IO R A R C H IT E C T U R E A N D E N V IR O N M E N T A L D ESIG N A N D TH E IN S T IT U T E OF F IN E A R T S OF B iL K E N T U N IV E R S IT Y IN P A R T IA L F U L F IL L M E N T OF TH E REQ U IR E M E N TS FO R TH E DEGREE OF Ph.D. IN A R T , D ESIG N A N D A R C H IT E C T U R E By EBRU Ş A H İN May, 1998nID 1 Ц 3 5
η
I certify that I have read this thesis and that in my opinion it is fully adequate, in scope and quality as a thesis for the degree o f Ph.D. in Art, Design and Architecture.
I certify that I have read this thesis and that in my opinion it is fully adequate, in scope and quality as a thesis for the degree o f Ph.D. in Art, Design and Architecture.
Prof. Dr. Umur Talaşlı
I certify that I have read this thesis and that in my opinion it is fully adequate, in scope and quality as a thesis for the degree o f Ph.D. in Art, Design and Architecture.
Assoc. Prof. Dr. Yusuf Ziya Ozean
I certify that I have read this thesis and that in my opinion it is fully adequate, in scope and quality as a thesis for the degree o f Ph.D. in Art, Design and Architecture.
Visiting Assist Prof. Dr. Emine Onaran Incirlio|lu
I certify that I have read this thesis and that in my opinion it is fully adequate, in scope and quality as a thesis for the degree o f Ph.D. in Art, Design and Architecture.
Dr. Sibel Ertez Ural
Approved by the Institute^f Fine Arts
A B S T R A C T
C O LO R N A M IN G
Ebru Şahin
Ph.D. In Art, Design and Architecture Supervisor: Assoc. Prof. Dr. Cengiz Yener
May, 1998
In this study, visual aspects o f color and neurophysiological processes involved in the phenomenon, language o f color and color models were explained in addition to the discussion o f different ideas, orientations and previous works behind the subject o f matter. Available color terms in Turkish language have been identified and the most frequently known or used non-basic color terms have been attained. An experimental research has been conducted to investigate the resemblance o f the basic, and mostly used non-basic color terms, in the minds o f the native speakers o f Turkish language. Using Munsell Color System, color ranges, reflecting the color naming and color perception o f Turkish Society, have been constructed for each color term investigated in the experimental research.
Ö ZE T
R E N K L E R İN A D L A N D IR IL M A S I
Ebru Şahin
Güzel Sanatlar, Tasarım ve Mimarlık Fakültesi Doktora
T ez Y ö n eticisi: Doç. Dr. Cengiz Yener Mayıs, 1998
Bu tezde, renk konusu üe ilg ili değişik fikirlerin, eğilimlerin ve önceden yapılmış çalışmalann anlatımının yamsıra, renk olayımn nörofızyolojik işleyişi ve görsel özellikleri, renk dili ve renk dizgeleri tartışılmıştır, Türkçede kullanılan renk adlan ve bu adlar arasında en çok bilinen, ya da kullanılmakta olan ikincil renk adlan tesbit edilmiştir. Sözü geçen , temel ve ikincil renk adlannın, ana dili Türkçe olan kişilerin belleklerindeki yansımalarım saptamak üzere uygulamalı bir araştırma yapılmıştır, Araştuma sonucunda, Munsell Renk Dizgesi kullanılarak, incelenen tüm isimler için, Türk toplumunun, renkleri adlandmnasmı ve algılamasını örnekleyen renk bölgeleri oluşturulmuştur.
Anahtar Sözcükler : Renk, Renklerin Adlandmiması, Renk Algısı, Renk Terimleri
First and foremost, I would like to thank Assoc. Prof. Dr. Cengiz Yener for his invaluable help, support, and guidance, without which this dissertation would have been a weaker one, i f not totally impossible. His insightful comments provided me with the guidance necessary to approach this complex topic. He critically questioned my views, offered probing suggestions and directed me toward a systematic approach to my topic.
I would also wish to acknowledge Assoc. Prof. Dr. Yusuf Ziya Özcan, for his kind and inestimable assistance in the analysis o f the data. I would like to thank Prof. Dr. Umur Talash, Assistant Prof. Dr. Emine İncirlioğlu, and Dr. Sibel Ertez Ural who reviewed the dissertation and provided insightful comments on the subject. Also, I would like to thank Aydın Ramazanoğlu who produced the colorful photographs in the text.
ACKNOWLEDGEMENTS
I wish to express my gratitude to my parents, Gülşen and Metin, and my sister Ela, without whose irreplaceable support and encouragement, I would not have been able to put forth this dissertation. I want to thank Kıvanç for his helpfulness and understanding. Special thanks goes to Bikini and Hüseyin, who never left me alone in front o f the computer while preparing this dissertation.
TABLE OF CONTENTS A B S T R A C T ... ... İÜ O ZE T .IV A C K N O W L E D G E M E N T S ...v T A B L E OF C O N T E N T S ...vi L IS T OF T A B L E S ... ix L IS T OF F IG U R E S ... x 1. IN T R O D U C T IO N ... 1
1.1 Methodology and Design o f Research... 9
1.2 The Literature Search... 10
2. C O LO R P E R C E P T IO N ... 11
2.1 The Phenomenon o f C o lo r... 11
2.2 Visual Qualities o f C o lo r ... 13
2.3 Color V isio n ... 14
2.3.1 The Neurophysiological Bases o f Color Perception... 14
2.3.2 Biological Uniformity and Biological Diversity... 22
3. C O LO R N A M IN G FRO M D IFFE R E N T V IE W P O IN T S ...26
3.1 Inferred Preliminaries o f Differences in Behavior... 26
3.2 General Orientations in Shaping Behavior... 28
3.2.1 Absolutism...28
3.2.2 Relativism...32
3.2.3 Universalism...34
3.3 Previous Works in Color Naming with the Related V iew Points... 36
3.3.1 Evolutionary Idea... 37
3.3.2 Relativist Id ea ... 43
4. L A N G U A G E OF C O L O R ...52
4.1 Color Terminology as a Systematic Culture Pattern... 52
4.1.1 Color and Language...53
4.1.2 Naming o f Color Expressions... 54
4.2 Color term s... 57
4.2.1 Basic Color Terms...58
4.2.2 Non-basic Color Term s... 65
4.3 Color Categorization from a Different Point o f V iew : Fuzzy Sets...71
4.4 Color in Turkish Language...77
5. C O LO R S Y S T E M S ... 80
5.1 Munsell Color System...84
5.2 C IE System (Commission Internationale de TE clairage)... 87
5.3 The Swedish Natural Color System (N C S )... 90
5.4 Ostwald Color System...92
5.5 ISCC-NBS Color System ... 94
6. E X P E R IM E N T A L RESEARCH O N C O LO R N A M IN G ... 97
6.2.2 Phases o f Experimental Research ... 99
6.2.3 M ethodology... 102
6.2.4 Data Analysis... 105
6.3 Results and Discussion o f the Findings... 106
6.3.1 Analysis o f Basic Color Term s... 107
6.3.2 Analysis o f Non-basic Color Terms... 123
6.3.3 Discussion o f the Findings... 171
6.3.4 Research Notes... 178 7. C O N C L U S IO N ... 184 R E FE R E N C E S... 191 APPEN D IC ES Appendix 1...198 Appendix 2...199 Appendix 3... 205 Appendix 4... 216
LIST OF TABLES
Table 3.1 Properties o f the three orientations: absolutism, relativism,
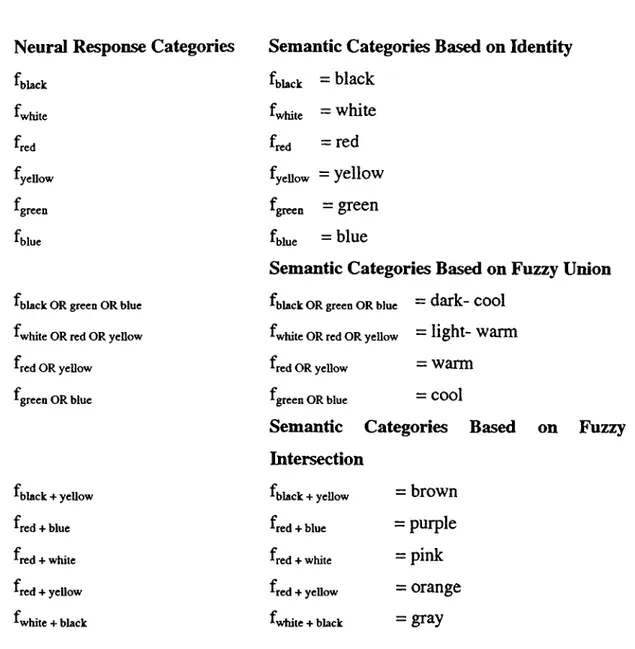
universalism ...35 Table 4.1 Summary listing o f color categories showing the three types o f
fuzzy set operations and related fundamental response categories .... 76 Table 5.1 Percentages o f pure white and pure black in
LIST OF nOURES
Figure 2.1 Electromagnetic Spectrum ...12
Figure 2.2 Relative spectral absorption o f human rhodopsin ...14
Figure 2.3 The relative spectral absorption curves o f the three photopigments ...16
Figure 2.4 Response patterns o f opponent cells ... 18
Figure 2.5 Functions o f black and white c e lls ... 20
Figure 2.6 The geographical distribution o f semantic color identities... 25
Figure 3.1 Four classes o f preliminary variables in certain behavioral differences ... 26
Figure 4.1 Membership Functions for the Color Categories... 73
Figure 4.2 The Fuzzy Union o f fgreen OR blue ...74
Figure 4.3 (a) Simple fuzzy intersection o f f^ed and yeUow ...75
(b) Comparison o f the simple and modified fuzzy intersection function o f orange (fredANDyeUow)... 75
Figure 5.1 Color scale by W inifred Nicholson ... 82
Figure 5.2 Related hue symbols arranged on 100 hue circuit ... 85
Figure 5.3 Hue, value, and chroma scales arranged in color space... 86
Figure 5.4 Munsel color solid showing the color pages and their arrangment in the system ... 87
Figure 5.5 1931 C IE chromaticity diagram showing method o f obtaining dominant wavelength and purity for different samples (lES 5 -9 )...89
Figure 5.6 Example o f the relationship between the NCS-notation o f a color sample and the location o f the color in the NCS-color triangle and NCS-color circle ...91
Figure 5.7 (a) Ostwald color solid (double cone)... 94 (b) Ostwald’ s two letter notation... 94 (c) Vertical cross section o f the Ostwald color s o lid ...94 Figure 5.8 Illustration o f the three dimensional nature the ISCC-NBS system..95 Figure 6.1 Presentation o f the stimuli used in the experimental research... 104 Figure 6.2 (a) Presentation o f color chips constituting the range for “ mor” ... 107
(b) Cumulative frequency distribution o f responses
for “ mor” using stacked area chart... 108 (c) Stacked area chart showing the cumulative number o f
responses for “ mor” ... 108 Figure 6.3 (a) Presentation o f color chips constituting the range for “ pembe” 109
(b) Cumulative frequency distribution o f responses
for “ pembe” using stacked area chart... 110 (c) Stacked area chart showing the cumulative number o f
responses for “ pembe” ...110 Figure 6.4 (a) Presentation o f color chips constimting the range
f o r “ kirm ai” ... I l l (b) Cumulative frequency distribution o f responses
for “ kırmızı” using stacked area chart... 112 (c) Stacked area chart showing the cumulative number o f
responses for “ kırmızı” ...112 Figure 6.5 (a) Presentation o f color chips constituting the range
for “ turuncu” ... 113 (b) Cumulative frequency distribution o f responses
for “ turuncu” using stacked area chart... 114 (c) Stacked area chart showing the cumulative number o f
responses for “ turuncu” ...114 Figure 6.6 (a) Presentation o f color chips constituting the range
Figure 6.7 (a) Presentation o f color chips constituting the range for “ san” .... 117 (b) Cumulative frequency distribution o f responses
for “ san” using stacked area chart... 1118 (c) Stacked area chart showing the cumulative number o f
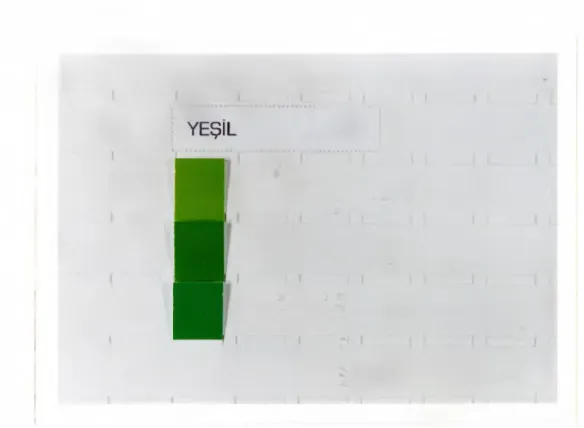
responses for “ san” ...118 Figure 6.8 (a) Presentation o f color chips constituting the range for “ yeşil” .. 119
(b) Cumulative frequency distribution o f responses
for “ yeşil” using stacked area chart... 120 (c) Stacked area chart showing the cumulative number o f
responses for “ yeşil” ...120 Figure 6.9 (a) Presentation o f color chips constituting the range for “ mavi” .. 121
(b) Cumulative frequency distribution o f responses
for “ mavi” using stacked area chart... 122 (c) Stacked area chart showing the cumulative number o f
responses for “ mavi” ... 122 Figure 6.10 (a) Presentation o f color chips constituting the range
for “ patlıcan moru” ... 123 (b) Cumulative frequency distribution o f responses
for “ patlıcan moru” using stacked area chart... 124 (c) Stacked area chart showing the cumulative number o f
responses for “ patlıcan moru” ...124 Figure 6.11 (a) Presentation o f color chips constituting the range
for “ leylak” ... 125 (b) Cumulative frequency distribution o f responses
for “ leylak” using stacked area chart... 126 (c) Stacked area chart showing the cumulative number o f
responses for “ leylak” ...126 Figure 6.12 (a) Presentation o f color chips constituting the range
for “ eflatun” ... 127 (b) Cumulative frequency distribution o f responses
for “ eflatun” using stacked area chart... 128 responses for “kahverengi” ...116
Figure 6.13 (a) Presentation o f color chips constituting the range
for “ çingene pembesi” ... 129 (b) Cumulative frequency distribution o f responses
for “ çingene pembesi” using stacked area chart...130 (c) Stacked area chart showing the cumulative number o f
responses for “ çingene pembesi” ... 130 Figure 6.14 (a) Presentation o f color chips constituting the range
for “ gül kurusu” ... 131 (b) Cumulative frequency distribution o f responses
for “ gül kurusu” using stacked area chart... 132 (c) Stacked area chart showing the cumulative number o f
responses for “ gül kurusu” ...132 Figure 6.15 (a) Presentation o f color chips constituting the range
for “ yavruağzı” ... 133 (b) Cumulative frequency distribution o f responses
for “ yavruağzı” using stacked area chart... 134 (c) Stacked area chart showing the cumulative number o f
responses for “ yavruağzı” ...134 Figure 6.16 (a) Presentation o f color chips constituting the range
for “ bordo” ... 135 (b ) Cumulative frequency distribution o f responses
for “ bordo” using stacked area chart... 136 (c) Stacked area chart showing the cumulative number o f
responses for “ bordo” ... 136 Figure 6.17 (a) Presentation o f color chips constituting the range
for “ kızü” ... 137 (b) Cumulative frequency distribution o f responses
for “ kızıl” using stacked area chart... 138 (c) Stacked area chart showing the cumulative number o f
responses for “ kızıl” ...138 responses for “eflatun” ...128
(b) Cumulative frequency distribution o f responses
for “ kan kırmızısı” using stacked area chart... 140 (c) Stacked area chart showing the cumulative number o f
responses for “ kan kırmızısı” ... 140 Figure 6.19 (a) Presentation o f color chips constituting the range
for “ vişne çürüğü” ... 141 (b) Cumulative frequency distribution o f responses
for “ vişne çürüğü” using stacked area chart... 142 (c) Stacked area chart showing the cumulative number o f
responses for “ vişne çürüğü” ... 142 Figure 6.20 (a) Presentation o f color chips constituting the range
for “ kiremit rengi” ...143 (b) Cumulative frequency distribution o f responses
for “ kiremit rengi” using stacked area chart... 144 (c) Stacked area chart showing the cumulative number o f
responses for “ kiremit rengi” ...144 Figure 6.21 (a) Presentation o f color chips constituting the range
for “ kavuniçi” ... 145 (b) Cumulative frequency distribution o f responses
for “ kavuniçi” using stacked area chart... 146 (c) Stacked area chart showing the cumulative number o f
responses for “ kavuniçi” ...146 Figure 6.22 (a) Presentation o f color chips constituting the range for “ ela” .... 147
(b) Cumulative frequency distribution o f responses
for “ ela” using stacked area chart...148 (c) Stacked area chart showing the cumulative number o f
responses for “ ela” ... 148 Figure 6.23 (a) Presentation o f color chips constituting the range for “ bej” .... 149
(b ) Cumulative frequency distribution o f responses
for “ bej” using stacked area chart... 150 (c) Stacked area chart showing the cumulative number o f
Figure 6.24 (a) Presentation o f color chips constituting the range
for “ kanarya sansi” ...151 (b) Cumulative frequency distribution o f responses
for “kanarya sansi” using stacked area chart...152 (c) Stacked area chart showing the cumulative number o f
responses for “ kanarya sansi” ... 152 Figure 6.25 (a) Presentation o f color chips constituting the range for “ krem” .. 153
(b ) Cumulative frequency distribution o f responses
for “ krem” using stacked area chart... 154 (c) Stacked area chart showing the cumulative number o f
responses for “ krem” ...154 Figure 6.26 (a) Presentation o f color chips constituting the range
for “ limon sansi” ... 155 (b ) Cumulative frequency distribution o f responses
for “ limon sansi” using stacked area chart... 156 (c ) Stacked area chart showing the cumulative number o f
responses for “ limon sansi” ...156 Figure 6.27 (a) Presentation o f color chips constituting the range
for “ bal rengi” ... 157 (b) Cumulative frequency distribution o f responses
for “ bal rengi” using stacked area chart... 158 (c) Stacked area chart showing the cumulative number o f
responses for “ bal rengi” ...158 Figure 6.28 (a) Presentation o f color chips constituting the range
for ‘ Tıldişi” ... 159 (b ) Cumulative frequency distribution o f responses
for “ fildişi” using stacked area chart... 160 (c ) Stacked area chart showing the cumulative number o f
responses for “ fildişi” ...160 Figure 6.29 (a) Presentation o f color chips constituting the range
(c) Stacked area chart showing the cumulative number o f
responses for “ zeytin yeşili” ...162 Figure 6.30 (a) Presentation o f color chips constituting the range
for “ fıstık yeşili” ... 163 (b) Cumulative frequency distribution o f responses
for “ fıstık yeşili” using stacked area chart... 164 (c) Stacked area chart showing the cumulative number o f
responses for “ fıstık yeşili” ... 164 Figure 6.31 (a) Presentation o f color chips constituting the range
for “ çağla yeşili” ... 165 (b ) Cumulative frequency distribution o f responses
for “ çağla yeşili” using stacked area chart... 166 (c) Stacked area chart showing the cumulative number o f
responses for “ çağla yeşili” ...166 Figure 6.32 (a) Presentation o f color chips constituting the range
for “ lacivert” ... 167 (b) Cumulative frequency distribution o f responses
for “ lacivert” using stacked area chart... 168 (c) Stacked area chart showing the cumulative number o f
responses for “ lacivert” ...168 Figure 6.33 (a) Presentation o f color chips constituting the range
for “ gece mavisi” ... 169 (b) Cumulative frequency distribution o f responses
for “ gece mavisi” using stacked area chart... 170 (c) Stacked area chart showing the cumulative number o f
1. IN T R O D U C T IO N
Our understanding and gathering knowledge o f the world, emotionally or intellectually, depend on the experiences that we live through the various senses. Vision is the most effective sense that ties human beings to the environment that they live. Consequently, seeing is a great part o f human existence and in a broad sense most o f our visual sense is founded on color vision. Sensation o f color and its importance in experiencing and perceiving our daily environment is undeniable and it can be argued that color contributes to the beauty or ugliness o f the visual world.
Color can help to simplify, assist and satisfy some basic human needs. It can identify and define objects. It acts as a qualifying tool conveying necessary information about the entities for survival, enjoyment, etc. It can be used to define space, create ambiance, mark territory. Color is a probable tool in emphasizing or hiding figures, shapes, objects and etc. Most important, the use, preference, and arrangement o f color enables us to express our personal taste and subjective feelings.
The explanation o f color phenomena involves several branches o f science (chemistry, physics, psychophysics, psychology, etc.). On the other hand, others (e.g., botany, zoology, geology, archeology, anthropology) use color as evidence, reference, and identification o f related facts. Since color is part o f many sciences it
can be introduced in various ways. The physicist’ s approach to color is different from the psychologist’ s or the artist’ s.
Psychology is the science that deals with the mind, with mental and emotional processes referring to behavior. Thoughts, feelings, and any other activity a person experiences is included in behavior. These experiences can be conscious, subconscious, and unconscious processes. Conscious experiences are the ones that we are aware o f what we are thinking and feeling. Subconscious processes refer to mental activities occurring without conscious perception. The unconscious is the sum o f all thoughts, memories, impulses, desires, and feelings o f which we are not conscious, but which influence our emotions and behavior. Experiencing color can be involved in any o f the three processes o f human behavior. Human reaction to color or color in the environment can be considered as a psychological activity, but it can also result in a physiological reaction (Mahnke 6).
Various approaches to color have created many color languages. Correct use o f color is a valuable tool as it permits people working on different aspects o f color to understand each other and to collaborate successfully. Let us consider a physicist. According to him color is resulted from the concept o f ‘wavelength’ . This means that the terminology that he uses is the language o f physics that is used to describe the sensory stimuli perceived as color. For the physicist, red, for example, means a light wave that has a wavelength o f 630-780 nanometers. However for another field o f profession, definition o f red may or may not be associated with a physical event.
One o f the amazing part o f color perception is that the input, causing human beings to see a color, is not always experienced as an external stimuli. When we are to picture a ripe tomato, probably the first color comes in our mind is red. But the stimuli this time is not a light wave between 630-780 nanometers. In other words no stimuli exists cause us to see the tomato as being red. This means that color is not always in the environment, but also in the mind. Thus the language o f a psychologist, trying to describe this phenomena, is somewhat different than a physicist.
Mahnke argues that, “ A ll o f the color stimuli that we receive from the external world are connected with our internal world: our psyche” (7). Thus it is convincing to believe that color perception does not depend just on the external world, but may also originate through the ability o f men’ s imagination using his inner world.
Although mechanism o f seeing is the keystone, it is not the only factor in color perception. Sensations and feelings are also included in the activity which activates our thoughts and emotions. Mahnke exemplifies this fact as follows:
For example, i f I say
green grass
, obviouslygrass
is associated with the colorgreen
or vice versa. From the standpoint o f physicist, this green o f the grass is nothing than the pigment chlorophyll, which in its molecularstructure is so devised as to absorb all the wavelengths o f sunlight, with the exception o f green, which it reflects. However, in the perception o f green, whether real or imagined, do most o f the people think chlorophyll? I doubted it. They might think about a walk in a green meadow, or a certain event in
thoughts and emotions may be set in motion that interact automatically, so that at the end, the green may have nothing more to do with it. But it was the impulse
green
that triggered the whole process. (7)Color language is somehow mysterious. Some color words are believed to carry meanings, moods, and associations. For years artists, architects and interior designers have attributed moods, feelings to color configurations. Helson (qtd. in Rohles et al. 511) lists such properties o f color as texture, liveness, volume, gloss, hardness and warmth. The most common interpretation on color, especially for the hue representations, is a color’ s being warm or cool. Laboratory tests in Europe and the United states ( Rohles et al. 511-527, Flynn and Spencer 167-179) have shown that the psychological interpretation o f color and temperature has been far from being evident and unable to support “ hue-heat hypothesis” which possesses that light frequencies toward the red end o f the visible spectrum contribute to a feeling o f warmth and frequencies toward the blue end o f the visible spectrum contribute to cool feelings. Although this is the fact, most people know and w ill continue to think o f yellows oranges, and reds as at the warm end o f the spectrum, and blues and greens at the cool.
Each individual in the society has different thoughts, emotions, experiences, view points etc. Because o f this reason picturing the world is different for any individual. Same is valid in color perception, and the image o f color in mind shows variations depending on the factors listed above. I f we examine the letter below, written by Stevenson from Samoa on Oct. 8,' 1892, to Sidney Colvin, it is easier to understand the difficulty in the communication o f color. Stevenson says:
Perhaps in the same way it might amuse you to send us any pattern o f wall paper that might strike you as cheap, pretty, and suitable for a room in a hot and extremely bright clim ate.... The room I have particularly in mind is a sort o f bed and sitting room, pretty large, lit on three sides, and the color in favor o f its proprietor at present is a topazy yellow. But then what color to reveal it? For a little work-room o f my own at the back, I should rather like to see some patterns o f unglossy-well. I ’ ll be hanged i f I can describe this red- it is not Turkish and it is not Roman and it is not Indian, but it seems to partake o f the two last, and yet it can be either o f them because it ought to be able to go with verm ilion.... anyway, with what brains you have left choose me and send some-many-pattems o f this exact shade (Munsel, A Color Notation 13).
The cited letter above is a clear way that emphasizes the difficulty in the description and communication o f color between two individuals. A s could be understood from the request o f Stevenson, he finds himself unable to describe the color he wants. The reason is simply because color terms convey different ideas to different persons.
T w o observers may agree that one color is blue and other is green. On the other hand, the same condition may not be valid for a third color “ between” the first two. For this intermediary color, one observer may call it bluish green, while the other may insist on that it is greenish blue. The disagreement between two observers reflects uncertainty about naming. However when the task is to arrange blue-green chips in a row according to relative degree o f blueness or greenness, observers may
do the task without disagreement. Although people understand what they see, disagreement on the word representing the perceived color is natural.
In all languages there are color words adopted to reflect the image o f the light wave belonging to certain wavelength. Most o f the time speakers o f languages refer to general words rather than making fine descriptions in color naming. However this approach can be misleading as the term can be applied to a huge color percepts grouped under a general term. For example, the word that corresponds to blue can be misleading as blue is general. Blue, names a range o f colors rather than an individual shade and it may create disappointment in indicating any particular blue, as the word include every member o f blue class.
Names for individual shades o f color are agreed to differ from the general name o f the class. Although the term “ blue” can be used for every blue, people are aware o f specific names that exist for particular blues. Everyone knows or agrees that, words such as blue are general and are not the names o f the individual members o f their corresponding classes. The reason o f not using the specific names might be the uncertainty o f how to apply them, or for some reason people may not have interest in offering them.
Application o f different names for different wavelengths means that people are aware o f the differences between those wavelengths. People, most o f the time, use the same color name unless they visualize and compare different colors. For example lights o f 530 and 550 nm are both called green, but the difference between them is easy to be visualized i f they are shown side by side.
The color names in the following list, all referring to varieties o f red are not synonyms. They identify more than one range o f color. Without color samples it is difficult to explain and visualize what the each name means (Sloane, 19):
vermilion camelian persimmon flame red scarlet
madder red red earth crimson poppy lacquer red
Chinese red Japanese red Spanish red Naples red Mars red Indian red Egyptian red Pompeiian red Morocco red Venetian red English red Turkish red Roman red Indian red
Like the terms mentioned above, there are also color terms in Turkish referring to varieties o f red. Some o f them are:
K ızıl Doru Kan Kırmızısı A le v Kırmızısı Ateş Kırmızısı
Kiremit Rengi Bayrak Kırmızısı Kiraz Rengi Elma Kırmızısı Gül Kırmızısı
A l Fes Rengi Domates Kırmızısı Gelincik Kırmızısı
Unique color names for the discriminable wavelengths are highly culture dependent. Comsweet argue that “ ... natives o f the jungle have many names for wavelengths in what we call the green region o f the spectnun” (68). This does not mean that, they can perform better than any other culture in discriminating among those wavelengths, when the wavelengths are presented side by side. Like these natives, painters, weavers, chemists, etc., all use different color names to refer to and to remember different combinations o f wavelengths that are important to them. One amazing example for this specification is that, in Turkish language, there are many names used in the classification o f horses, considering their fiir color. “ K ir” , “ doru” , “ yağız” , “ alaca” , “kula” , etc. can be counted to be the examples o f this type. (Davaz
1991).
it is also necessary to establish and use standard terms. In naming colors, close attention was paid to ensure that the terms used can easily be visualized. Many talented artists, designers, and colorists are suggested to have better color memory than most; however, recalling the exact nuances o f a hue without a sample as a guide is really a difficult job.
A proper study o f color terminology requires consideration o f linguistics, and culture and environment, as well as the psychophysiology o f vision. Because hue, a psycholinguistical dimension, is a direct product o f light. It is a natural physical dimension. Besides, color terminology has been found to vary cross-culturally (Bomstein, The Influence o f 774). Thus, color naming is related with the physics o f the real world and the acquisition o f knowledge about that world.
B rief introduction above outlines the problem definition o f this study. I believe, since people began to identify and describe elements surrounding them, they also began to create new and more refined color names concerning these elements. The use and expressing o f color make descriptions more practical and helpful in daily life. Like people all over the world, Turkish people, started unconsciously to use the surface colors o f some elements as they are real color names.
A s w ell as in the United States (Inter-Society Color Council) and in the United Kingdom (British Standards Institution), certain organizations also in Japan (Color Science Association o f Japan), Germany (Deutscher Verband Farbe), and Sweden (Swedish Color Center Foundation) published color scales, orders to communicate color among the society. In Turkey we also sometimes, refer to these publications
even i f some names, presented with a chip o f color, seem incorrectly represented, or meaningless or irrelevant to us. Cultural environment and cultural background are the reason for this unfamiliarity with the color terminology. Although it is possible to establish basic color lexicons (see section 4.2 for detailed information) universally (Berlin and Kay 1-5), non-basic color terminology is not universal and not applicable to every culture. Also, the image or perception o f the certain colors may not be universal, while color names may be. Because o f this reason, the intention o f this study is to investigate the color perception o f Turkish society and the lexicon carrying these color percepts, including some mostly used non-basic color names as well as the basic ones.
1.1 M E T H O D O L O G Y A N D D E SIG N o f RESEARCH
The general format o f the document, as indicated in the Table o f Contents, is divided into several chapters, each o f which focused on an important and related aspect o f color naming. T o understand the underlying concepts in color perception, it is important to know about the visual aspects o f color and the neurophysiological processes involved in the phenomenon; this is the subject o f Chapter 2, the Color Perception. Throughout history, different approaches to color perception have emerged, most o f the time concerning the differences in behavior. Different orientations discussed the subject. T o be aware o f the continuing debate over color naming, it is also essential to summarize the different orientations and previous works in color naming. Chapter 3, Color Naming from Different V iew Points, discusses the different ideas behind the subject in detail. Chapter 4 deals with
ease the communication o f color in society. The final Chapter 6 covers the development, implementation, and analyses o f an original experimental research conducted to investigate color perception and color lexicon o f Turkish people.
Thus, this dissertation is partly an archival research study and partly an original experimental research, both concerned with the color perception and color naming.
1.2 TH E L IT E R A T U R E SEARCH
Most o f the material reviewed for this study were various research studies done over the last thirty years in order to determine the various attributes o f color naming. They have focused more on the investigation o f basic color terms than the non-basic ones. These studies were found in professional journals such as: Psychological Bulletin , Perceptual and Motor Skills , American Anthropologist , Color Research and Application , Language , and Psychological Research . Information was also gathered from a number o f books and articles written on color perception, color naming by such better known authors as Paul Kay, Brent Berlin, Frank Mahnke, Marc Bomstein, Lars Sivik, Larry Hardin and others. E-mail communication with M affi, Lammens, etc. also provided necessary clues in reaching the sources o f information.
In my investigation I found that color covers four enormous investigative fields: physics, physiology, psychology and social anthropology. There are also many other fields, using color as a subject to be investigated. Thus, color, its properties, and concepts are included in broad spectrum o f the sciences and arts.
2. C O LO R PE R C E PTIO N
2.1 TH E PH E N O M E N O N OF C O LO R
Radio waves, x-rays and visible light waves are among several forms o f electromagnetic energy ranging from cosmic rays at the highest level to electric power transmission at the lowest. Difference in these forms o f energy is related with the various wavelengths at which they travel. Visible spectrum is the result o f specific waves o f energy within a limited range. Although infrared and ultraviolet light are included in the light portion o f the electromagnetic spectrum, they are invisible and not included in the visible spectrum. Psychophysically, color is the visual appearance o f electromagnetic radiant energy having a spectral composition ranging in wavelength from about 380 to about 780 nanometers (Figure 2.1). Physical quality o f light is the determining factor for the color sensation, however the process depends on the physiological procedures follow ed in the retina and in the brain.
Three psychological dimensions (hue, brightness, and saturation) cause simultaneous variations in man’ s color perception. The most important representative o f color perception is hue, which divides the color world into qualitative regular patterns. Hue is established by the dominant wavelength which determines place o f color in
the result o f the quantity o f electromagnetic energy. The perception o f color is determined by wavelengths which hit the retina within the eyes. The optic nerve sends the stimuli to the brain; the brain assigns a name to this stimuli as color (Eiseman & Herbert 933).
Gamma
W avelength in nanom eters
Infrared Radar Broadcast
bands
Figure 2.1 Electromagnetic Spectrum (Baron 87).
Color can be regarded as a continuum since any two colors are separated by a range o f intermediary colors. Although 7,295,000 visible differences, in other words intemiediary colors, are estimated to be present in the physical color solid, the identification o f these differences in the color continuum is limited by human perception. A s people vary in ability to discriminate nuances within the color continuum, just noticeable differences are relative to the observers. Finally, this partitioning o f the color continuum is carried with language where people originate names for the little portion that the eye can discern (Bomstein, The Influence o f 774).
2.2 V IS U A L Q U A L IT IE S OF C O L O R
In spite o f this physical, biological, and psychological dimension, visible color is often specified in terms o f only three sensory “ attributes” : hue, value (brightness), and chroma (saturation).
Hue is the name o f a color. It is that quality by which we distinguish one color family from another, as red from yellow, or green from blue or purple. Science assigns this quality (which causes the sensation o f color) to difference in the wavelengths hitting on the retina.
Value is the lightness o f a color. It is that quality by which we distinguish a light color from a dark one. The lighter values o f color, made by adding white to a pure color are called tints o f the color. On the other hand, there are also tones o f a specific color which are the darker values o f color made by adding black to a pure color. Darkening a pure color by adding its complement results in the perception o f a new color which is a shade o f the modified color.
Chroma is the strength o f a color. It is that quality o f color by which we distinguish a strong color from a weak one; how much or how little gray it contains. A hue in its purest form is at maximum chroma.
without disturbing the other. A color can be weakened or strengthened in chroma without changing its value or hue. Thus, in planning a color system, value and chroma are as important as the choice o f hue.
2.3 C O LO R V IS IO N
2.3.1 TH E N E U R O P H Y S IO L O G IC A L BASES OF C O LO R PE R C E PTIO N
Visual photopigments, found in the outer segment o f the photoreceptors (the rods and the cones) are necessary in the absorption o f the light that influence the eye. When light is absorbed, a change in the shape o f the photopigment occurs. This is the only direct effect that light has on the eye. A ll o f the follow ing events are chemical reactions occurring beyond this retinal level (Wooten and M iller 59).
Figure 2.2 Relative spectral absorption o f human rhodopsin (Wooten and M iller 60).
When the lighting conditions are dim, the rods function and the rhodopsin is the substance that interacts with light. This phenomenon is known as the scotopic vision. It is sometimes called night vision as well. One o f the most fundamental aspects o f scotopic vision is that chromatic colors are not seen, instead, only the shades o f gray are experienced. The reason for this complete color blindness is
inherent in a fundamental property o f any given photopigment. Wooten and M iller explain the fact as:
... the event o f quantal fundamental absorption contains no information concerning which spectral (wavelength) region the quantum came from. The photopigment can only signal that a quantum has been absorbed. It can not signal the wavelength associated with the absorbed quantum. This concept is referred to as the
Law o f Univariance
and applies to all known visualphotopigments (60).
Human color vision is possible with more than one photopigment with different spectral absorption curves. But how many? Although the number is known as three, it is better to describe the stages succeeded in the process.
The assumptions about discovering how differences in the wavelengths o f light reaching the eye are transformed into response differences, began with Thomas Young, in 1803. He pointed out that:
The number o f photopigments could not be a large number because then spatial vision (acuity) would be poor. Each small region o f the retina is devoted primarily to spatial resolution. Hence two small points o f light can be discriminated as distinct even i f placed quite close together. This would not be possible i f each small retinal region contained a large number o f receptors (each with a slightly different photopigment) devoted to the analysis o f wavelength (qtd. in Wooten and M iller 64).
Young guessed that the number is three. With the help o f complex techniques and modem methods o f investigation. Young’ s hypothesis is reliable today and it is known that the human retina contains three different photopigments, which are the components o f color vision. These photopigments are found in the outer segments o f cone cells and each cone has only one pigment. These pigments are like rhodopsin, but differ only in the relative spectral absorption process. The relative spectral absorption curves o f these three photopigments are presented in Figure 2.3.
As could be seen from the figure, the (3 photopigment is most sensitive at about 540
nm whereas the y pigment is most sensitive at about 570 nm. The third one, a , is shifted to the short-wave region with peak sensitivity at about 420 nm (Wooten and M iller 64).
400 450 500 550 600 650 700
w a v e l e n g t h i n n a n o m e t e r s
Figure 2.3 The relative spectral absorption curves o f the three photopigments (lES 5-9).
Ewald Hering, great nineteenth century physiologist, studied on Young’ s claim (later called Young-Hehnholtz Theory) in order to improve it to be a satisfying model o f perception. In the light o f the theory o f photoreceptors’ being effective in the
sensation o f blue, green and yellow (420 nm, 540 nm, and 570 nm respectively), Hering formulated his own conceptions, which came to be called the
opponent-
process theory.
His idea was based on the subjective appearance o f the spectrum andstated that there are four primary central hue sensations: blueness, yellowness, greenness, and redness. Later, he emphasized certain relations between these central hues. According to Hering, blueness for example, can be perceptually mixed with greenness or redness. For that reason, although each hue are unique in character, it is possible to perceive green-blues, red-blues, yellow-greens, and yellow-reds. On the other hand what he mentioned was that, blueness and yellowness can not be perceptually mixed as there is no light that appears blue-yellow. Similarly, he established this theory for the perceived greens and reds, and claimed that while greenness may be perceptually mixed with yellowness, or blueness, it can not have the same process with redness. Depending on these suggestions, Hering hypothesized that yellowness and blueness, and greenness and redness are opposite appearances o f individual physiological process. Hue sensation is a result o f light’ s effect on these two individual processes (Wooten and M iller 68).
Figure 2.4 show’ s Hering’ s conception o f red-green (R -G ) and the yellow-blue (Y -B ) opponent processes depending on wavelength. The relative strengths o f these states directly determines the perceived hue. Hering’ s model has two response output systems represented by curves. The point at which curve crosses the horizontal axis defines a unique hue. A t about 580 nm, a normal observer experiences “ pure” yellow as the response has neither green nor red in it. Similarly, a “ pure” green w ill be experienced at approximately 510 nm as the Yellow-Blue
function is zero. When the figure is examined, a “ pure” red is impossible to be experienced with a single wavelength due to the fact that both red and yellow outputs occur from 600 nm to 700 nm, and both red and blue outputs occur from 400 nm to 470 nm. Jameson and D ’ Andrade provide an explanation for achieving this special red as; ” ... the yellow component o f a 650 nm light must be canceled by the blue component o f a 450 nm light so that only a red response occurs” (302).
Figure 2.4 Response patterns o f opponent cells (Kay and McDaniel 619).
When Figure 2.4 is examined, light o f 520 nm is shown to produce a yellow response in the Y B system. A t the same time, a green response in the RG system, which is o f greater magnitude than the yellow response, is also produced. The result is that, light o f 520 nm is seen as principally green with a ‘ veil’ o f yellow, i.e., as yellowish green. The appearance o f the entire visible spectrum can be accounted in this manner, by evaluating at each wavelength the states and relative strengths o f the two opponent response functions.
Appearance o f light at different wavelengths makes us perceive color. The names for these wavelengths, representing the chromatic color aspect o f light, are identified by such terms as “ violet,” “ red,” “ yellow ” etc. Another major dimension o f light is the achromatic aspect and is represented by the terms “ black” , “ white” and all shades o f “ gray” . A ll o f the achromatic qualities are simply perceptual mixtures o f black and white.
Wooten and M iller express Hering’ s explanation for the activation o f black and white process as:
According to Hering, the white process is driven by receptor activity, feeding directly to the white channel. The black process is however, organized quite differently. It is not activated directly by receptor activity. Rather it is responsive to receptor activity from neighboring retinal regions. In a functional sense, black is a contrast color, i.e., the percept o f black
corresponding to a given region o f visual space arises from light stimulating an adjacent area o f visual space (70).
Only the Black and White receptors function when Red-Green and Blue-Yellow channels are activated equally. When this is the case, the resulting colors vary from pure black, through the shades o f gray, to pure white and these achromatic response is referred as the dimension o f
lightness.
A s black and white cells are in non-opponent character, each cell behaves individually, either excited or not, relative to the light o f every wavelength. They
opponent pairs red-green and yellow-blue. Located in a separate channel, this brightness and darkness sensitive cells inform us regarding the whiteness or blackness o f a stimulus (Kay and McDaniel 627). The functions o f the non opponent cells, are graphed in Figure 2.5. As both curves have positive values, black and white can be perceived together at the same time, and the resulting value is gray.
PERCENT REFLECTANCE
Figure 2.5 Functions o f black and white cells (Kay and McDaniel 619).
It is nearly impossible for a stimulus to activate a single chromatic receptor in reality. Most stimuli cause an activation in one or both chromatic channels as well as the black and white channels. The simultaneous activation to varying degrees o f chromatic and achromatic channels provides the basis for the perceptual dimension o f
saturation.
Thus colors are the perceptions resulting from the activation o f both chromatic (red or green and blue or yellow ) and achromatic (black and/or white) aspects o f light (Wooten and M iller 70).Bering’ s opponent-color theory hypotheses two things. First, there are neurophysiologically opponent-process mechanisms in the visual system that produce the experience o f the primary colors. Second, the opponent pairs red/green.
and yellow/blue with non-opponent one black/white are all that is needed to derive any other color (besides the primary ones) that can be experienced.
Researches conducted after 1960s are concerned with providing necessary data to support Hering’ s opponent color theory. Cells with opponent response characteristics, which were hypothesized by Hering in 1894 for the first time, have been identified by R. De Valois and his co-workers in an Old W ord monkey, a ‘macaque’ , with a visual system similar to man. These scholars discovered four types o f opponent cells which are excited by “ red” , “ yellow ” , “ green” , and “ blue” stimuli and two non-opponent cells responsible for the sensation o f the black, white and shades o f gray (D e Valois et al. 966-977).
The work o f De Valois and his colleagues in 1966 indicates that, the phenomenal appearance o f light o f any given wavelength is consequently the result o f (1) the response state (R or G, Y or B ) o f each opponent system, and (2) the relative strengths o f the responses in each state (966-977).
De Valois, Abramov, and Mead have stated that, the ability o f individuals to differentiate hue is highly related with the capacities o f four chromatic cell types processing together (415-433). Besides their arguments, Bomstein goes one step further and suggests that the existence, activity, and specificity o f the neural system provides a direct biological foundation for hue categorization. According to Bomstein, “ ... the wavelength regions in the spectrum which tend to be confused nominally represent regions where the visual system falters in discrimination,
correspond to regions where the visual system differentiates acutely” (The influence o f 786).
Referring to Bomstein’ s paper The Influence o f Visual Perception on Culture, it is both convincing and logical to discuss that hue categorization is related to wavelength discrimination. In this relationship, visual discrimination capacity, which is given biologically, can be seen to establish tendencies o f linguistic categorization.
2.3.2 B IO L O G IC A L U N IF O R M IT Y A N D B IO L O G IC A L D IV E R S IT Y
Variability in basic color lexicons is, most o f the time, due to biological diversity o f peripheral visual process. Color vision in man begins with the operation o f three types o f cells (cones) in the eye: one sensitive in the blue, a second in the green, and a third in the yellow-red portion o f the spectrum. Color vision deficiencies, permanent or temporary, may be produced by the failing or genetic missing o f one or more o f these cell types. Besides, the selective adaptation o f ceU type or the selective screening o f stimulation from cones can also cause deficiencies in color vision. Thus, it is true to claim that, the color vision o f different peoples may sometimes differ.
Beginning with Rivers at the turn o f the century, many field studies were organized to investigate genetic red or green color blindness. Reported results consistently favor non-Europeans and it was established that Negroids and Mongoloids suffer less frequent occurrence o f genetic red and green color blindness than Europ)eans (Bomstein, The Influence o f 787).
However, deficiency in blue and yellow color vision has been found to occur among Negroids and Mongoloids. A review o f cross-cultural studies o f blue-yellow color deficiency or color weakness by Bomstein (Color Vision 276-278) explains that, rate o f occurrence and the degree o f blue-yellow irregularity tended to correlate closely with the occurrence and the degree o f eye (and skin) pigmentation o f the people tested.
In Color Vision and Color Naming, Bomstein mentioned that, optical pigmentation, which is yellow in color, absorbs incident short-wavelength radiation and therefore filters “ blue” light from sensitive photoreceptor cells in the eye. Lesser sensitivity to short-wavelength (blue) light is related with high pigmentation in the eye. Like other biological pigments, visual pigmentation may be dietary (as is macular pigment-appendix la ) or genetic (as are intraocular pigments- appendix lb ) in origin and they are biologically adaptive (276-277).
Y ellow pigments are protective for the eye and assist acuity in the perception. They protect visual cells in the eye from harmful rays by selectively absorbing near ultraviolet and short-wavelength visible light. Moreover, in Color Vision and Color Naming, Bomstein argues that, such absorption reduces the amount o f out-of-focus blue light and increases visual acuity (787).
Judd and Wyszecki have pointed out that blood pigment also acts as an effective optical filter and the related hemoglobin absorption in the eye is significant between
components o f sunlight, hemoglobin density is known to increase with altimde. Thus, hemoglobin pigment also causes the same type o f color vision deficiency seen as a consequence o f eye pigmentation.
Such limited color vision exhibits itself in altered color naming behavior. In the case o f attenuation o f short-wavelengths, lexical identities such as green with blue, blue with black, and green and blue with black can be expected. Pickford (qtd. in Bomstein, Color Vision) who has conducted extensive studies with blue-weak subjects, described their color naming behavior in detail:
With the yellow -blue blind and even with the yellow-blue weak either or both, blue and yellow are diminished in saturation compared with the normal. Dark gray tends to invade blue and light gray or white tends to invade
yellow. The intermediate colors, violet and blue-green tend to join hands across the blue, while orange and yellow-green may tend to join across yellow. Thus there may be difficulty in accepting distinctions made by the normal person about any o f the four intermediate colors: blue-green, violet, orange and yellow-green. The yellow-blue weak person w ill often be able to report having had disputes or differences o f opinion about why a blue-green should not be called ‘ green’ , why brick red should be distinguished from orange and so on. He may say that he often confuses yellow with white and he may call orange beads ‘yellow ’ and yellow ones ‘white’ (278).
A survey o f color-naming systems, from approximately 150 societies around the world, showed that, societies closer to the equator, more frequently, identify short wavelength color names (blue and green) with one another and sometimes with
black. Figure 2.6 displays the geographical distribution o f semantic color identities all around the world. The density o f yellow intraocular filtration is considered to be the reason in this failure o f color naming systems. Such filtration that helps visual acuity, selectively attenuates the amount o f short wavelength visible radiation reaching the photoreceptors. Consequently, the absence o f existing color term “ blue” is a result o f a process that decreases the distinctive sensation o f “ blueness” (Bomstein, C olor Naming 257-258).
- r L /·
'-f,;...
/ " /rx
\ ■ -- - / V ( WORLD MAP OF ^ jSEMANTIC COLOR IDENTITIES fj " , ■ GREEN-BLUE A BLUE-BLACK • G R E E N- BL U E- BL A C K o YELLOW-GREEN A RED -Y EL L OW o NO ID EN TIT IES
Figure 2.6 The geographical distribution o f semantic color identities (Bomstein, The Influence o f 790).
I f density o f pigmentation is considered to be a determinant in visual limitation and visual lexical identification, it must not be surprising to have diversities in the color naming systems around the world.
3. C O LO R N A M IN G FRO M D IFFERENT V IE W PO IN TS
3.1 INFERRED PR E LIM IN A R IE S OF DIFFERENCES IN B E H A V IO R
Psychological outcomes were presented as the consequences o f four classes o f preliminary variables; ecological influences, genetic transmission, cultural transmission, and acculturation influences. These four classes o f variables are considered to be the explanation o f behavioral differences that can be distinguished in literature (Figure 3.1)
Figure 3.1 Four classes o f preliminary variables in certain behavioral differences (adapted from Berry et al. 252)
Ecological influences are the consequences achieved from the interaction o f human organisms and the physical environment. There are ecological necessities for all populations. These are known as ecological context and can be described as the set o f relationships that provide a range o f life possibilities for a population. Many
variables are included in the context. Some o f the basic ones include the process o f adaptation o f human population to natural environment, and factors such as hunting, gathering, agriculture forming the economic activity. Socialization practices and economic considerations, relationships between natural and man-made environments are the basic cases introducing ecological interactions and influences (Berry et al. 2).
The basis o f genetic transmission depends on the biological transmission o f specific characteristics with the help o f genetic mechanisms. Certain features o f populations continue over time across generations through genetic transmission. This type o f variable is important in understanding the complex pattern o f interaction between the human organisms as a biological entity and environmental factors (Berry et al. 192).
When cultural transmission is the concern as a variable in changing behavior, the mechanisms o f teaching and learning gain importance. There is a cultural group’ s preservation and, then, transmission o f the preserved features among the generations through the mentioned mechanisms. There are three types o f cultural transmission: vertical, horizontal and oblique. In vertical transmission parents transmit cultural values, skills, beliefs, motives (and so forth) to their children. In this case it is difficult to distinguish between cultural and biological transmission, since biological and cultural parents are the same. In the case o f horizontal cultural transmission, there is a procedure happening from birth to adulthood. Besides the parents, the interaction o f child with the environment, and his relationship to different people (his schoolmates, neighbors, etc.) plays an important role in the development. And in the case o f an oblique transmission, one learns from other adults and institutions
In an oblique transmission, i f the process takes place entirely within one’ s own culture, then the terms enculmration and socialization are the appropriate ones (Berry et al. 17-18). On the other hand, acculturation influences are the other outcomes from oblique cultural transmission. “ Acculturation refers to cultural and psychological change caused by contact with other peoples belonging to different cultures and exhibiting different behavior at the end o f learning process.’’(Berry et al.
19)
The result o f both enculturation and socialization, is the development o f behavioral similarities within cultures and behavioral differences between cultures. Thus, they are the reasons o f similarities and differences also at the individual level resulting from the cultural mechanisms.
3.2 G E N E R A L O R IE N T A T IO N S IN S H A P IN G TH E B E H A V IO R
Three general orientations in cross-culturally research have been emerged from these four categories that shape the behavior. They are called absolutism, relativism, and universalism. Table 3.1 (after the brief description o f each orientation) outlines a number o f features o f the three orientations under three headings: general orientation, theoretical perspectives, and methodological perspectives.
3.2.1 A B S O L U T IS M
An ordinary observer naively believes that the world is exactly as he sees it. He has an uncritical perception. Thus, he is not aware o f indirect reference systems
affecting his visual perception. He has no doubt that his vision is direct, immediate and unmediated. This attitude is called absolutism (or phenomenal absolutism) which is accepted as an important aspect o f human observing. Objective orientation and naive realism are other terms to represent the idea (Segall et al. 5).
In absolutism, the observer assumes that perception does not differ among individuals. He thinks that all other members o f his species see, understand, and interpret the conditions as he does. Rather than differences in perception, he accepts intention to be the reason in case o f unexpected response.
The term ‘perception’ has been used to express several processes. According to some individuals, the term represents an action; such as perceiving in the sense o f seeing, hearing, or detecting or discriminating some aspect o f the environment. The meaning o f perception is more literal in this sense. On the other hand, others have applied the term almost symbolic to indicate a world view, a perspective on life, or some other very general cognitive product.
Segall and his colleagues state that; “ Even when the term ‘ perception’ is meant in its literal sense, it may cover differing aspects o f behavior. Traditionally, ‘perception’ has been used for a whole class o f processes, at one extreme bordering on sensation and, at the other, on concept-formation” (24). When psychologists talk o f perception, they tend more often to refer to processes that are more nearly sensory; whereas when anthropologists employ the term, they more often refer to processes close to cognition.
The perceptual mechanisms may be innate, or may be learned. Whatever the case in these occurrences, visual perception is influenced by learning and adaptation. Thus, the distinction between sensation and perception is the result o f these learned meanings and integration constituting perception. Direct process o f perception includes learned organizations, description, and interpretations. A s people have no awareness o f the learned associations in lifelike situations, they interpret the process phenomenally absolute (Segall et al. 6-7).
Anthropologists noticed that, absolutism plays an important role in man’ s tendency to perceive and value other cultures, and they have found that human being tries to evaluate, generalize, apply and value all perceptions unconsciously based upon on his own. “ Ethnocentrism” is the term used to describe this naive attitude. Segall et al. define ethnocentrism as “ ... the view o f things in which one’ s own group and its customers are unconsciously used as the standard for all judgments, as the center o f everything, with all other peoples and customs scaled and rated accordingly.“ (9-10)
T o understand such ethnocentrism, it is important to know the process o f enculturation. Processes, that involve conflict and cooperation, punishment and reward, control o f behavior, and like force all individuals to adopt their behavior to that o f other members o f his society. This could be named as the socialization process. Individuals experience enculturation as the result o f such process where there is the introduction o f specific culture.
There are many ways that people can learn. Frequent repetition o f behavioral standards and models o f society is one o f them. However, observation is the most
effective and refined way o f learning among humans. Through these ways, members leam to accommodate themselves to the society, especially to the culture that shapies and limits the content o f their performances.
Segall et al. state that “ ...a significant feature o f the enculturative experience is that, the individual typically remains, throughout his lifetime unaware o f how his own habits, which to him appear ‘ only natural’ , in fact result from a learning process in which he never had an opportunity to attempt alternative responses” (10). Every human being goes through a process o f enculturation that shapes his entire lifestyle.
Language is one o f the distinct feature that represent this unconscious transmission. When the child is aware and in need o f language, all the necessary knowledge o f the world is transferred to him through information on what others observed and learned. Even in his direct learning, in contact with physical objects, expectations as a result o f culture are strongly important in shaping the final form o f knowledge. Because o f that reason, most o f the time, the member o f a society is not aware o f his culture and o f its role in shaping his behavior, although he is completely encultured.
The absolutists seem little concerned with the problems o f ethnocentrism or o f seeing people “ in their own terms.” Rather, they consider psychological phenomena to be basically the same across cultures. Berry et al. mention that,
... the essential character of, for example, “ intelligence” , “ honesty,” or depression is assumed to be the same everywhere, and the possibility is ignored that the researchers’ knowledge is rooted in their own cultural