■■•i»;*' ”* w / «■■■■•^> w ' ''•ш У « «İM» ч. '-W ■V· .V '■> '*^‘. ‘/Ч ■ Í*·;. ' ■ ■:■■ ,■. Г-:•■»".‘.г, AifSV і i, . “ * ч. ^ Лъгіі ·· ■ ívfc;·· «лг-л ^ ■ ч^· ■ -А). ,'і*л '· . ,/ ;·. V 1 'ТМ Ï.·; η · !?, IP*·; ,ffS» · !. JZ ':.Л\;ч.'·
COMPUTER AIDED DIAGNOSIS IN RADIOLOGY
A DISSERTATION
SUBMITTED TO THE DEPARTMENT OF ELECTRICAL AND ELECTRONICS
ENGINEERING
AND THE INSTITUTE OF ENGINEERING AND SCIENCES
OF BILKENT UNIVERSITY
IN PARTIAL FULFILLMENT OF THE REQUIREMENTS
FOR THE DEGREE OF DOCTOR OF PHILOSOPHY
By
Metin Nafi Gürcan
March 1999
I certify th at I have read this thesis and th at in my opinion it is fully adequate, in scope and in quality, as a thesis for the degree of Doctor of Philosophy.
A. Enis Çetin, Ph. D. (Supervisor)
I certify th at I have read this thesis and that in my opinion it is fully adequate, in scope and in quality, as a thesis for the degree of Doctor of Philosophy.
H a ce ttin Köymer(] Ph. D.
I certify th at I have read this thesis and th at in my opinion it is fully adequate, in scope and in quality, as a thesis for the degree of Doctor of Philosophy.
I certify th at I have read this thesis and that in my opinion it is fully adequate, in scope and in quality, as a thesis for the degree of Doctor of Philosophy.
I certify that I have read this thesis and th at in my opinion it is fully adequate, in scope and in quality, as a thesis for the degree of Doctor of Philosophy.
Volkan Atalay, Ph. D.
Approved for the Institute of Engineering and Sciences:
Prof. Dr. Mehmet
ABSTRACT
COMPUTER AIDED DIAGNOSIS IN RADIOLOGY
Metin Nafi Gürcan
Ph.D. in Electrical and Electronics Engineering
Supervisor: Prof. Dr. A. Enis Çetin
March 1999
Breast cancer is one of the most deadly diseases for middle-aged women. In this thesis, computer-aided diagnosis tools are developed for the detection of breast cancer on mammograms. These tools include a detection scheme for microcalcification clusters which are an early sign of breast cancer, and a method to detect the boundaries of mass lesions. In the first microcalcification detection method we propose, a subband decomposition structure is employed. Contrary to the previous work, the detection is carried out in the subband domain. The mammogram image is first processed by a subband decomposition filter bank. The resulting subimage is analyzed to detect microcalcification clusters. In regions corresponding to the healthy breast tissue the distribution is almost Gaussian. Since microcalcifications are small, isolated bright spots, they produce outliers in the subimages and the distribution of pixels deviates from Gaussian. The subimages are divided into overlapping square regions. In each square region, skewness and kurtosis values are estimated. As third and fourth order correlation parameters, skewness and kurtosis, are measures of the asymmetry and impulsiveness of the distribution, they can be used to find the locations of microcalcification clusters. If the values of these parameters are higher than experimentally determined thresholds then the region is marked as a potential cancer area. Experimental studies indicate that this method successfully detects regions containing microcalcifications.
We also propose another microcalcification detection method which uses two- dimensional (2-D) adaptive filtering and a higher order statistics based Gaussianity test. In this method, statistics of the prediction errors are computed to determine whether the samples are from a Gaussian distribution. The prediction error sequence deviates from
pixels is more difficult than prediction of the pixels corresponding to healthy breast tissue. Then, we develop a new Gaussianity test which has higher sensitivity to outliers. The scheme which uses this test gives better detection performance compared to the previously proposed methods. Within the detected regions it is possible to segment individual microcalcifications. An outlier labeling and nonlinear subband decomposition based microcalcification segmentation method is also investigated.
Two types of lesions, namely mass and stellate lesions, might be indicators of breast cancer. Finally, we propose a snake algorithm based scheme to detect the boundaries of mass lesions on mammograms. This scheme is compared with a recently developed region growing based boundary detection method. It is observed that the snake algorithm results in a more smooth boundary which is consistent with the morphological structure of mass lesions.
Keywords: Mammography, microcalcification, mass lesion, computer-aided diagnosis,
ÖZET
RADYOLOJİDE BİLGİSAYAR DESTEKLİ TANI
Metin Nafi Gürcan
Elektrik ve Elektronik Mühendisliği Doktora
Tez Yöneticisi: Prof. Dr. A. Enis Çetin
Mart 1999
Meme kanseri orta yaştaki kadınlar için en ölümcül hastalıklardan birisidir. Bu tezde, mammogramlarda meme kanserinin bilgisayar destekli tanısı için yöntem
ler geliştirilmiştir. Bunlar içerisinde, meme kanserinin erken bir belirtisi olan
mikrokalsifikasyon topaklanmalarının sezimlenmesi ve kütle lezyonlarmm çevrelerinin
bulunması için geliştirilmiş yöntemler vardır. Geliştirdiğimiz ilk mikrokalsifikasyon
sezimleme yönteminde, altbantlara ayrıştırma yapısı kullanılmıştır. Daha önceki yapılmış çalışmaların aksine, sezimleme işlemi altbantta gerçekleştirilmiştir. Mammogram resmi
öncelikle bir altbantlara ayrıştırma süzgeç dizisi ile işlenir. Ortaya çıkan alt-imge
analiz edilerek, mikrokalsifikasyon topaklanmaları sezimlenir. Sağlıklı göğüs hücrelerine karşılık gelen bölgelerde yaklaşık olarak Gauss dağılımı gözlenir. Mikrokalsifikasyonlar küçük, ayrışık parlak bölgeler oldukları için, alt-imgelerde aykırı değer oluştururlar ve görellerin dağılımı Gauss dağılımından sapar. Alt-imgeler birbiri içine geçmiş kare bölgelere bölünür. Her bir kare içerisinde yamukluk ve savrukluk değerleri hesaplanır. Üçüncü ve dördüncü dereceden ilinti parametreleri yamukluk ve savrukluk, dağılımın bakışımsızlık ve dürtüselliğini gösterdiğinden, mikrokalsifikasyon topaklanmalarının yerlerinin bulunmasında kullanılabilir. Eğer bir kare bölgede bu değerler, deneysel olarak belirlenmiş eşik değerlerinin üzerinde çıkarlarsa, o bölge potansiyel kanser bölgesi olarak işaretlenir. Deneysel çalışmalar göstermiştir ki bu yöntem mikrokalsifikasyon topaklanmalarının sezimlenmesinde başarılıdır.
Biz ayrıca iki boyutlu uyarlamalı süzgeçlemeye ve yüksek dereceli istatistiklere dayalı Gauss dağılımına uygunluk testlerinden yararlanan bir mikrokalsifikasyon topak
olduğu bölgelerde Gauss dağılımından sapar çünkü mikrokalsifikasyona karşılık gelen görellerin öngörüsü sağlıklı meme hücrelerine karşılık gelen gürellerin öngörüsünden
daha zordur. Daha sonra, aykırılıklara daha yüksek duyarlılığa sahip bir Gauss
dağılımına uygunluk testi geliştirilmiştir. Bu testi kullanan yeni bir sezimleme sistemi geliştirilmiş ve önceden önerilmiş yöntemlerle karşılaştırıldığında daha iyi bir başarım
elde edilmiştir. Sezimlenmiş bölgelerde, her bir mikrokalsifîkasyonun bölütlenmesi
mümkündür. Aykırı değer etiketlemesine ve doğrusal olmayan altbantlara ayrıştırma yapıları kullanılan bölütleme yöntemleri incelenmiştir.
Kütle lezyonları ve yıldızsal lezyonlar meme kanserinin göstergeleri olabilir. Son olarak, kütle lezyonlarınm çevrelerinin bulunması için yılan algoritmasına dayalı bir yöntem geliştirilmiştir. Bu yöntem, bölge büyütmeye dayalı benzer bir algoritma ile karşılaştırılmıştır. Yılan algoritmasının daha yumuşak bir çevre oluşturduğu gözlenmiştir ve bu da kütle lezyonlarınm morfolojisine daha uygundur.
Anahtar Kelimeler: Mamografi, mikrokalsifikasyon, kütle lezyonu, bilgisayar destekli
ACKNOWLEDGMENTS
I would like to thank my supervisor Prof. Dr. Enis Çetin for his supervision, guidance, and suggestions throughout the development of this thesis.
I am grateful to Dr. Yasemin Yardım a for her invaluable help. Special thanks to Dr. Hayrettin Köymen, Dr. Orhan Arıkan, Dr. Uğur Güdükbay, Dr. Volkan Atalay for reading the manuscript and commenting on the thesis.
I thank all of my friends for their friendships throughout all these years.
It is a pleasure to express my special thanks to my mother, father, and brother for their sincere love, support and encouragement.
Contents
1 INTRODUCTION 1
1.1 Computer-Aided D iagnosis... 2
1.2 Previous Work 4 1.3 Outline of the T h e s is ... 10
2 MICROCALCIFICATION DETECTION USING FILTERING AND HIGHER ORDER STATISTICS 12 2.1 Characterization of M icrocalcifications... 13
2.2 Mammogram D a ta b a s e ... 17
2.3 Pre-Processing of Mammogram I m a g e s ... 17
2.3.1 Segmentation of Breast Region ... 18
2.3.2 Linear Processing of Mammogram I m a g e s ... 22
2.4 Statistical Detection M e th o d ... 24
2.4.1 HOS Measures: Skewness and K u rto s is ... 26
2.4.2 HOS Based Detection 27 2.5 Nonlinear Subband Decomposition Structures ... 30
3 MICROCALCIFICATION DETECTION USING ADAPTIVE FIL
3.1 2-D Adaptive Prediction based Tests for Microcalcification Detection 38
3.1.1 Adaptive Filtering 38
3.1.2 2-D Adaptive F ilte r in g ... 40
3.1.3 Gaussianity Test 43 3.1.4 Experimental R e s u lts ... 45
3.2 A Gaussianity Test Using Fourth Order P a ra m e te rs ... 46
3.2.1 The Influence F u n c tio n ... 47
3.2.2 The Sensitivity Curve of the OCM T e s t... 48
3.2.3 New Gaussianity Test Using Fourth Order M o m e n t... 51
4 MICROCALCIFICATION SEGMENTATION and MAMMOGRAM ENHANCEMENT 60 4.1 Segmentation of M icrocalcifications... 62
4.1.1 Adaptive Filtering based Subband D ecom position... 62
4.1.2 Boxplot Outlier Labeling M e th o d ... 66
4.2 Mammogram Image E nhancem ent... 68
4.2.1 Superposition and Amplification Based E n h an cem en t... 69
4.2.2 Nonlinear Subband Decomposition Based E nhancem ent... 73
5 DETECTION OF MASS LESION BOUNDARIES USING THE SNAKE ALGORITHM 79 5.1 Mass L e s io n ... 80
5.2 Breast Boundary Detection by Fuzzy Set Pre-processing and Region G ro w in g ... 82
5.2.1 Fuzzy Set Pre-processing... 82
5.3 The Snake A lg o rith m ... 84
5.4 Detection of Mass Lesion Boundaries using the Snake A lg o rith m ... 88
6 C O N C L U S IO N S 92
A P P E N D IC E S 95
A B a n d p a s s F ilte r E q u iv a le n ts o f S u b b a n d D e co m p o sitio n S tr u c tu r e s 95
B F re q u en c y B a n d C h a ra c te ris tic s o f T re e -S tru c tu re d F ilte r B an k s 101
B.l Binary Tree-structured Subband Filtering 102
B. 2 Arbitrary Tree-Structured Subband F ilte rin g ... 104
C Id e n tific a tio n o f R e la tiv e P r o te in B a n d s in P o ly a c ry la m id e G el
E le c tro p h o re s is (P A G E ) U sing M u ltire s o lu tio n S nake A lg o rith m 107
C. l M e th o d s ...108 C.2 R e su lts... 110 C.3 D iscu ssio n ... 116
List of Figures
1.1 Block diagram of a generic CAD system... 2
2.1 Part of a mammogram image containing microcalcification cluster... 13
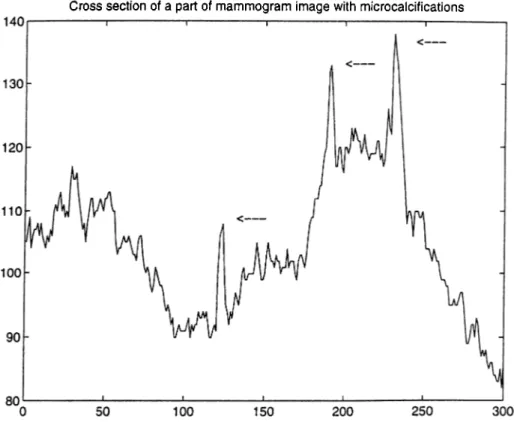
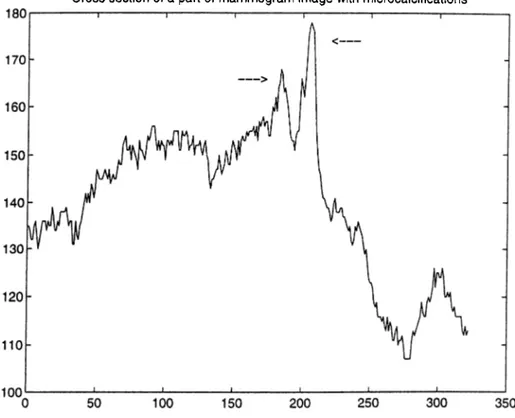
2.2 Cross section of a part of a mammogram image with microcalcifications. The locations of microcalcifications are indicated by arrows. 14 2.3 Cross section of a part of a mammogram image with microcalcifications. The locations of microcalcifications are indicated by arrows. 15 2.4 Typical mammogram image (cranio caudal view)... 18
2.5 Horizontal profile of the mammogram image in Figure 2.4... 19
2.6 Vertical profile of the mammogram image in Figure 2.4... 19
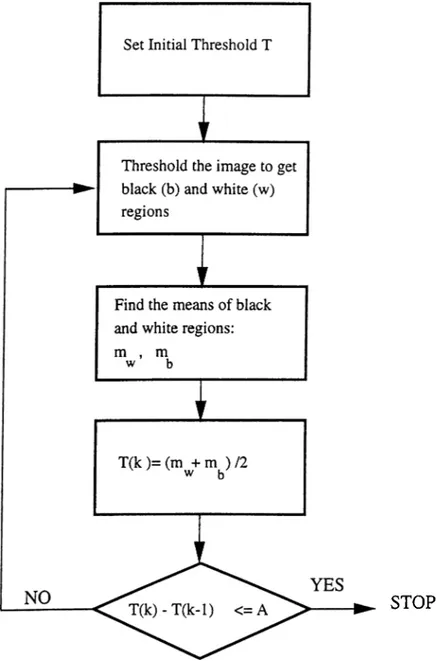
2.7 The adaptive iterative thresholding algorithm... 21
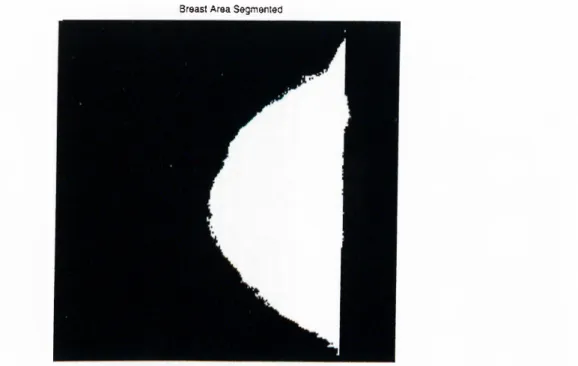
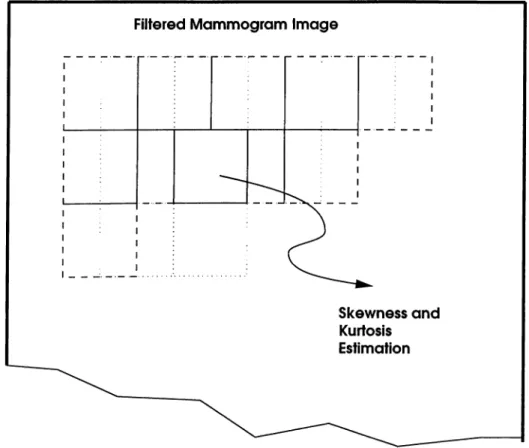
2.8 Segmented breast area of the mammogram image in Figure 2.4. 22 2.9 The magnitude response of the overall bandpass filter. 23 2.10 Skewness and Kurtosis are estimated in overlapping square regions. 25 2.11 100x 100 region with microcalcifications, distribution after linear process ing and magnified view of the tail... 25
2.12 100x 100 region with no microcalcification, distribution after linear p ro ce ssin g ... 26 2.13 Detection scheme output, (a) part of a mammogram image, (b) regions
2.14 Nonlinear Subband Decomposition Structure. 31 2.15 Median filter based nonlinear processing (a) A line extracted from the
mammogram image (b) the median filter output (c) the difference between
the signals in (a) and (b). 33
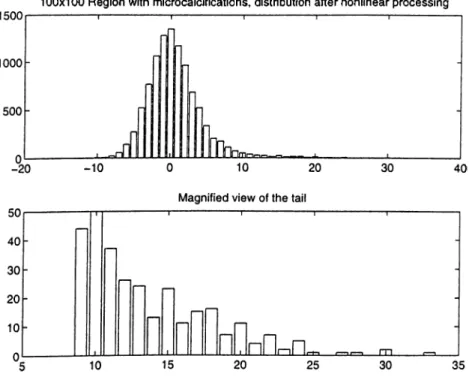
2.16 100x 100 region with microcalcifications, distribution after nonlinear
processing and magnified view of the tail... 34
2.17 100x100 region with no microcalcification, distribution after nonlinear
p ro ce ssin g ... 34
3.1 Adaptive filtering structure... 39
3.2 2-D adaptive filter structure... 41
3.3 Region of support (ROS) of the adaptive filter. ROS is “anticausal.” . . . 41
3.4 (a) Part of a mammogram image containing a microcalcification cluster
(b) The error image obtained after the 2-D adaptive filte rin g ... 42
3.5 Causal, semicausal and noncausal finite prediction windows. 42
3.6 Scanning directions in adaptive filtering... 43
3.7 Error value distributions in regions (a) without microcalcifications, and (b) with microcalcifications, (c) shows the an enlarged view of the tail of
the distribution in (b)... 45
3.8 Sensitivity curves for mean estimator (dashed lines) and for the OCM
Gaussianity test in Equation 3.28 (solid line). 52
3.9 Sensitivity curves for the Gaussianity test in Equation 3.28 (solid line)
and for the Gaussianity test in Equation 3.50 (dashed line)... 56
3.10 Sensitivity curves for skewness (dashed line) and the OCM Gaussianity
test (solid line)... 58 3.11 Sensitivity curves for kurtosis (dashed line) and our Gaussianity test (solid
line)... 58
4.2 Adaptive Structure Analysis Stage in [52]. 62
4.3 Adaptive Structure Synthesis Stage in [52]. 63
4.4 Adaptive filtering based subband decomposition for microcalcification
segmentation. 64
4.5 Comparison of detail images produced by different breast structure removal operations, (a) Original line of mammogram image, (b) bandpass filtering, (c) adaptive filtering, (d) nonlinear subband decomposition (e)
adaptive filtering based subband d e co m p o sitio n ... 65
4.6 Illustration of the outlier detection by the boxplot outlier labeling method
described in Section 4.1.2... 66
4.7 Microcalcification segmentation using outlier detection: (a) A horizontal line of the mammogram image which is known to contain a microcalci fication, (b) high-band sub-signal Xh, (c) output of the outlier detection method... 67 4.8 (a) A region of a mammogram image containing microcalcifications, (b)
output of the segmentation... 68
4.9 Mammogram image enhancement... 68
4.10 Superposition based mammogram image enhancement: (a) A horizontal line of the mammogram image, (b) the detail signal, yd[n] obtained by nonlinear subband decomposition, (c) output of the outlier detection
method, (d) microcalcifications are enhanced by superposition... 70
4.11 Amplification based mammogram image enhancement: (a) A horizontal line of the mammogram image, (b) the detail signal, yd,[n] obtained by nonlinear subband decomposition, (c) output of the outlier detection
method, (d) microcalcifications are enhanced by amplification... 71
4.12 Comparison of mammogram image enhancement schemes: (a) A horizon tal line of the mammogram image, (b) mammogram image enhancement
4.13 Enhanced Images (a) Microcalcifications are superimposed on the mammogram image, (b) Mammogram image is magnified at the locations
of microcalcifications. 72
4.14 (a) Enhanced and (b) contrast stretched images for the mammogram
image in Figure 4.8 (a). 73
4.15 Nonlinear Subband Decomposition Structure. 73
4.16 Median filter based nonlinear subband decomposition... 75
4.17 Microcalcification segmentation using the closing filtering on the difference image... 75 4.18 Enhancement of the mammogram image by nonlinear subband decompo
sition... 76 4.19 Enhancement of mammogram image by nonlinear subband decomposition:
(a) A region of a mammogram image containing microcalcifications, (b)
output of the segmentation (c) enhanced mammogram image... 76
4.20 Mammogram image enhancement scheme... 77
4.21 Results of mammogram image enhancement: (a) Part of a mammogram image to be enhanced (b) O utput of the contrast stretching operation (c)
Superposition based enhancement (d) Magnification based enhancement. 78
5.1 Part of a mammogram image with a circumscribed mass lesion. 80
5.2 Cross section of the mammogram image in horizontal direction. 81
5.3 Cross section of the mammogram image in vertical direction... 81
5.4 Membership functions for two different values o i ¡3 = 0.007 (Solid line),
¡3 = 0.07 (Broken line). 83 5.5 (a) Part of a mammogram image containing a mass lesion (b) Fuzzy Set
based pre-processing of (a)... 84
5.6 O utput of the region growing algorithm for the detection of the mass lesion boundaries... 85
5.8 (a) Part of a mammogram image containing a mass lesion, (b) after
histogram equalization... 88
5.9 (a) Part of a mammogram image (b) Initial position of the snake, (c), (d),
(e), (f) The position of the snake at each iteration. 89
5.10 (a) Original image (b) Region marked by the radiologist (c) O utput of the
snake algorithm... 90
A .l Binary tree structured 2-level subband decomposition and weighting. The
subsignal Xo contains [0, |] , X i contains [ f , f], X 2 contains [ ^ , 7t], X 3
contains [ |, y ], frequency ranges of the original signal, X { n ) ... 96
A.2 The overall filter amplitude response using the LAD8 wavelet. Only the
the 2nd and 3rd scales are included in the final image [10]... 96
A.3 The ideal filter amplitude response obtained using the weights in Table A.2. 97 A.4 The overall filter amplitude response using the LAD8 wavelet: Weighted
scales [6]. 99
A.5 The overall filter amplitude response using the Biorthogonal Spline
wavelet and including the 2nd and 3rd scales [11]... 99
A. 6 The overall filter amplitude response using the LAD4 wavelet and
including the first 4 scales [12]. 100
B. l Binary tree-structured 2-level subband decomposition...102 B.2 4-channel decomposition of a signal... 103 B.3 Tree structure generation of a ternary Gray code... 105
B. 4 A hybrid tree structure. 106
C . l (a) Denaturing PAGE image, (b) a lane of the denaturing PAGE image. . 109 C.2 Histograms of three different regions of a PAGE image... 109
C.3 Change of different energy components. Solid lines indicate the energy changes in the high-resolution image and dashed lines show the energy changes in the lower-resolution image...I l l C.4 Protein of interest is enclosed within the snake ; (a) Original lane
image (b) Snake obtained using only the low-resolution image (c) Snake obtained using only the high-resolution image (d) Snake obtained using the multiresolutional approach...112 C.5 Results of the initialization process : (a) Initial position of the snake
located on the extracted edge (b) The snake in (a) after one iteration on low-resolution image (c) Snake obtained using the multiresolutional approach with the initial snake in (c)... 113 C.6 Different regions of interest for percentage calculations shown in (a) , (b),
(c) Percentage calculations of our program are compared with the eye estimate of a molecular biologist... 114 C.7 (a) Known amounts of protein bands determined by Bradford protein
assay, (b) Comparisons of percentage calculations of our software and a commercial software...115
List of Tables
2.1 Filter C oeiRcients... 23
2.2 Skewness, 73, and kurtosis, 74 estimates of the data plotted in Figures 2.11
and 2.12. 24
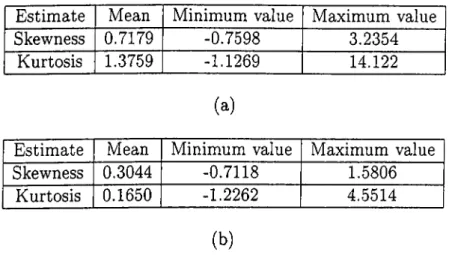
2.3 Skewness and Kurtosis estimates on the original image, (a) regions with
microcalcifications, (b) regions without microcalcifications. 28
2.4 Skewness and Kurtosis estimates on the bandpass filtered image, (a)
regions with microcalcifications, (b) regions without microcalcifications. . 28
2.5 Skewness and Kurtosis estimates on the highpass filtered image, (a)
regions with microcalcifications, (b) regions without microcalcifications . 29
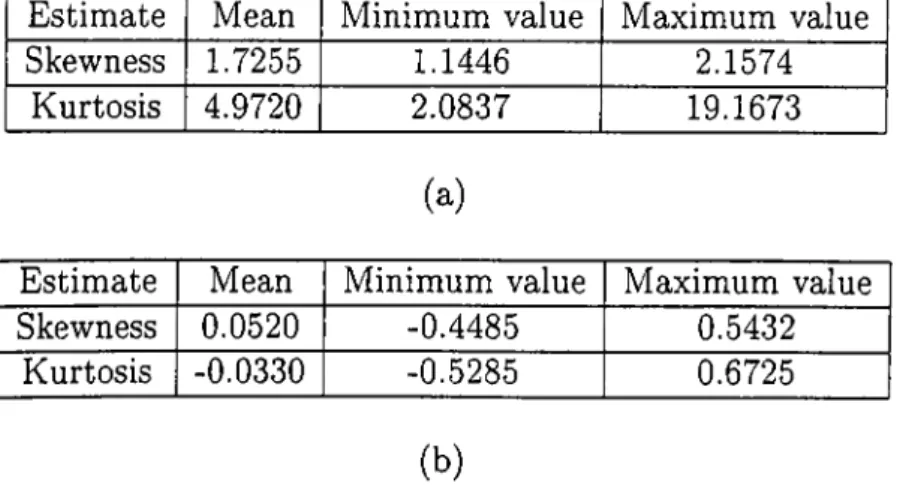
2.6 Skewness and Kurtosis estimates of the distributions in Figures 2.16 and 2.17... 33 2.7 Skewness and Kurtosis Estimates on the detail image after nonlinear
subband decomposition, (a) regions with microcalcifications, (b) regions
without microcalcifications. 35
3.1 Statistics of h in regions with microcalcifications. 45
3.2 Statistics of h in regions no microcalcification... 45
3.3 Test statistics in regions with microcalcifications... 57
3.5 Test statistics obtained from bandpass filtered images in regions with microcalcifications: the OCM test h{ I i , l 2, h ) and our Gaussianity test
H i l u l 2, h ) . 59
3.6 Test statistics obtained from bandpass filtered images in regions with no
microcalcification: the OCM test and our Gaussianity test
H { h j 2, h ) · 59
5.1 The snake algorithm... 87
A.l 8-tap Least Asymmetric Daubhecies’ filter coefficients. 97
A.2 Optimized weights of the wavelet scales. 97
A.3 9-tap Biorthogonal spline wavelets... 98
A.4 4-tap Least Asymmetric Daubhecies’ filter coefficients. 98
Chapter 1
INTRODUCTION
Breast cancer is one of the most deadly diseases for middle-aged women. One out of eight women is prone to this disease in her lifetime [1]. The success of treatm ent depends on early detection. Therefore, women, especially in their middle ages, must be regularly screened [2]. Mammography (X-ray image of breasts) is the commonly used screening technique for the early detection and it is recommended by the American Cancer Society to asymptomatic women over the age of 40 [2].
Breast cancer detection in mammogram images is currently carried out by radiologists who examine mammograms with a magnifying glass to find out tumors such as
microcalcifications, masses, and stellate lesions [3]. Clustered microcalcifications are
observed between 30% and 50% of breast cancer cases [4, 5]. Microcalcifications are tiny calcium deposits in breast parenchymal tissue structures, which appear as small bright spots on mammograms. A cluster is defined as 3 or more microcalcifications within a 1 cm^ area. Microcalcification sizes vary from 0.01 mm^ to 1 mm^. W ith the current 50 micron scanning technology, the smallest microcalcification appears as a 2 pixel by 2 pixel bright region in the digital mammogram image. Since microcalcifications are small and subtle abnormalities, they may be overlooked by an examining radiologist. For instance, in retrospective studies it has been determined that between 10%-30% of the undetected breast cancers are actually visible on mammograms [2].
While microcalcifications are regarded as an early sign of breast cancer, two types of lesions, namely mass and stellate lesions might be indicators of cancer. A mass appears on the mammogram as an almost uniform density elliptical disk. It is brighter than its
DETECTION OUTPUT --- ^
Figure 1.1: Block diagram of a generic CAD system.
surrounding area and its edges are fuzzy. A stellate lesion has a central mass very much like a mass. Additionally, it has sharp fine lines (spicules) emanating from the center [3].
1.1 Computer-Aided Diagnosis
Recently, pattern recognition and image processing techniques have been used in the analysis of medical images [1, 6]. Resulting systems are called Computer-Aided Diagnosis (CAD) systems. In general, a generic CAD system consists of three main tasks as shown in Figure 1.1 [13]:
• F e a tu re E x tra c tio n : Different sets of features are extracted either from the original image through some measurements (e.g., size of microcalcifications), or from processed images. Image can be processed by the Fourier transform, the
wavelet transform or nonlinear filter based transforms. For instance, higher
order correlations, autocorrelation, energy, and entropy are some of the features corresponding to a group of pixels in the wavelet domain [12].
• F e a tu re S election: Extracted features are grouped to achieve maximum
separability. The aim is to obtain non-overlapping feature classes such th at a perfect separability is possible. Some popular feature selection methods include genetic algorithms, multivariable cluster analysis [7].
• C lassification: The selected set of features are classified using, for instance, linear and quadratic classifiers, binary decision trees, standard back-propagation network, dynamic neural networks, and K-nearest neighbor rule [5].
A user-friendly interface is also an important part of a CAD system as most radiologists may not be familiar with computers.
Radiography is entering a new phase of development after the introduction of digital techniques. Now, some of the modalities such as Computed Radiography (CR),
Digital Subtraction Angiography, Digital Mammography, Computed Tomography(CT),
and Magnetic Resonance Imaging (MRI) produce digital outputs, directly. For archiving purposes, analog radiographs are digitized. Hence, digital image processing techniques will be utilized for a wide range of radiological applications. Some examples of the use of computer-aided techniques for different modalities are given in [23]. These include detection of pulmonary nodules and pneumothorax; detection and characterization of interstitial disease; and analysis of heart size in chest radiography. In angiography, stenotic lesions are analyzed by computerized methods. In mammography, mass, stellate lesions, and microcalcification clusters are detected and classified.
CAD will be an important feature of next generation Picture Archiving and Communication Systems (PACS), with which filmless hospitals are envisaged [14]. In these systems, radiological pictures are captured, stored and communicated digitally. Many hospitals all over the world have these systems.
It is clinically observed that the detection rate increases if the same mammogram image is read by two different radiologists. However, employing two radiologists for double reading is not always feasible. Currently, CAD systems are intended to act as
“second readers” rather than to replace radiologists.
In a computerized detection system there are four possible outcomes: 1) There is an abnormality and it is detected (true positive),
2) there is an abnormality and it is missed,
3) there is no abnormality but something is detected (false positive), and 4) there is no abnormality and nothing is detected.
Preliminary studies indicate that CAD systems increase the performance of radiolo gists [9]. With the help of CAD systems, radiologists can detect all suspicious regions on mammograms (i.e., high sensitivity), while not marking healthy regions as suspicious (i.e., high specificity) [8]. High sensitivity means achieving the maximum true positive rate while high specificity means having the minimum false negative rate.
of mammograms to be examined due to national screening programs through which all women over the age of 40 are advised to undergo regular mammogram exams. The second factor is the introduction of digital techniques in radiography, and availability and proliferation of digital radiological images. In this thesis, we develop CAD tools for the detection and analysis of breast abnormalities on mammogram images.
1.2 Previous Work
A significant part of CAD research for mammography has concentrated on the early detection of breast cancer, and in particular the detection of microcalcifications. In one of the early works in this field, a difference-image technique is employed [2]. First, the image is processed by two filters and their outputs which are called the signal-suppressed image and signal-enhanced image, are subtracted from each other. The first filter, the signal enhancement filter is a spatial filter approximately matching to the size and contrast variations of typical microcalcifications. This filter is designed to increase the peak intensity values of microcalcification pixels relative to the background pixels. Different forms of filters such as median filters and box-rim filters are used for signal suppression filters. The difference image is grey-level thresholded to single out microcalcification locations from the noise. The area and the contrast values of the pixels with values higher than globally and locally set threshold values are then analyzed. The resultant parts of the image are considered to be microcalcifications and these are clustered. This CAD system has 87% true-positive cluster detection accuracy at a false-positive detection rate of 4 clusters per image in a mammogram database consisting of 60 mammograms [9].
Woods et al. compare different pattern recognition techniques for the detection of microcalcifications on mammograms [5]. They employ a multistage detection algorithm. The first stage is segmentation. At this stage, a local contrast image is computed by subtracting from each pixel the average value of 15 x 15 region surrounding th at pixel. The maximum value in the local contrast image defines a threshold value. The pixels with values higher than this threshold constitute the locally bright spots on the mammogram. Some of these local bright spots are eliminated by region growing algorithm (described in Chapter 4). A feature vector consisting of 29 components are considered to characterize the resultant image. Seven of these features are selected to form a feature vector: area of the object, average grey level of the object, gradient strength of the object’s perimeter
in the surrounding background, contrast, a low order moment based shape descriptor. Finally, seven different classifiers are used to detect microcalcification clusters: linear and quadratic classifiers, binary decision trees, a standard back-propagation network, 2 dynamic neural networks, and a K-nearest neighbor classifier. Based on the experiments performed on a database of 24 images, the authors conclude th at the simple Bayesian linear classifier performs the best according to the receiver operating characteristics (ROC) curve methodology . The results are dependent on the choice of the feature set and on finding a good operating point.
Recently, a variety of wavelet transform based schemes has been proposed for
the computerized detection of microcalcifications [4, 6, 10]. In these schemes, the
mammogram image is first passed through a subband decomposing filter bank. Then, a selected set of subband images are weighted to enhance the microcalcification locations. Next, a new image is reconstructed from the weighted sub-images. In the detection step, global and local gray-level thresholds are applied to the reconstructed image to extract possible microcalcification locations. Finally, these locations are grouped to identify microcalcification clusters.
In wavelet based schemes, microcalcification detection is carried out on the reconstructed image. These schemes mainly differ in their choice of wavelet filters and the selection of subband images used in the reconstruction. For example, Yoshida et al. use the Least Asymmetric Daubechies’ wavelet with 8 coefficients (LAD8) [10]. Only the second and third scales of the wavelet transform are selected for the reconstruction. In their later work [6], they employ seven different scales, only the first three of which are given more emphasis by higher weights. Strickland and Hahn use the biorthogonal spline wavelet with nine coefficients [11]. In another work, Wei et al. use the Least Asymmetric Daubechies’ wavelet with 4 coefficients (LAD4) [12]. They include only the first four scales for feature extraction. We show th at these wavelet based schemes are essentially equivalent to linear filtering followed by thresholding. In Appendix A, we demonstrate the equivalence and give equivalent linear filter responses.
Clarke et al. develop a microcalcification detection method based on a tree-structured non-linear filter, edge detector, and the wavelet transform [8, 21]. The mammogram
image is first filtered with multistage, tree-structured nonlinear filters. The major
filtering blocks are Central-Weighted Median Filters (CWMF). In calculation of the CWMF, the current pixel is given more weight by including several copies of it in the
usual median calculation. The purpose of CVVMF filters is to increase the signal-to- noise ratio and to suppress the undesired background structures. Next, a quasi-range
dispersion edge detector enhances the edges. The output of the edge detector is input to
the wavelet transform. Finally, a linear combination of the wavelet transform coefficients is utilized to extract microcalcifications. In their evaluation of nine images, the authors detected all the clusters with an average of four false clusters per image.
Segmentation of individual microcalcifications after detecting their locations is the next step in diagnosis. In this step, the size and shape information of microcalcifications
are extracted. This information can be used by radiologists while classifying the
clusters as malignant or benign. Another important decision factor for the classification of clusters is the three-dimensional arrangement of microcalcifications within the cluster. For example, ductal carcinoma in situ tend to show linear arrangements while microcalcifications caused by cysts are often arranged on the surface of a sphere [17]. Müller et al. [18, 19] built a system to reconstruct and visualize the three-dimensional arrangement of a cluster from only two different views. The final decision is based on breast biopsy.
Dengler et al. employ a nonlinear filtering approach for microcalcification detection and segmentation [20]. The first step of this detection scheme is background gray level elimination. A broadband highpass filter eliminates the large background structures. The resulting image is thresholded. The value of the threshold is 0 because microcalcifications are expected to have pixel values greater than 0. Then, the processed mammogram
image is filtered with two Gaussian filters of different standard deviations, and cr_.
The standard deviation a+ is proportional to the microcalcification size and the standard deviation cr_ is related to the expected distance between microcalcifications. A circularly symmetric Gaussian filter in two dimensions is defined as:
g[m, n]
27rcr^e 2(T^ (1.1)
where a is the standard deviation of the filter, (m, n) and 1Z = [ - N , . . . , 0 , . . . , N ] x
[—N , . . . , 0, . . . , N ] . The difference of two filtered images is thresholded to locate suspicious spots. The value of the threshold is determined from the final image as a multiple of the standard deviation of the noise in the difference image. Finally, the thresholded image is nonlinearly processed by morphological opening and thickening operations to extract the original shape and size of microcalcifications. They obtained
by the authors, this method is also based on bandpass filtering as utilized Gaussian filters are two low-pass filters and their difference turns out to be a bandpass filter.
Dhawan et al. propose a scheme for the classification of microcalcifications on
mammogram images as benign or malignant [7]. The first step of the method is
the manual extraction of regions of interest on mammograms. These regions contain microcalcification clusters. Next, they compute global texture features from second- order histogram statistics: entropy, contrast, angular second moment, inverse difference moment, correlation, mean, deviation. The image is subband decomposed using the Daubechies’ wavelet filters of size 6 and 20. Local texture features, energy and entropy are computed on the original image and four subband images (low-low, low-high, high- low, high-high). The energy, E and the entropy, H iov an M x N region are defined as
E = E m = l E n = l X n]
N x M ( 1 .2 )
^ = - i : i : ^ ^ i o g ( i ^ ) (1.3)
m=ln=l \ ^ /
where S is the sum of the squares of pixel intensity values, x[m, n\ within the region
of interest, S = Em=i E^=i n]. The global and local texture features are
combined with another feature set which include features such as the distance between microcalcifications and the number of microcalcifications. Among all these extracted features, the best set of features is selected by means of multivariate cluster analysis and a genetic algorithm-based search method. Finally, back-propagation neural networks and parametric statistical classifiers are used to classify the selected features. The authors conclude that genetic algorithm-based best feature selection combined with the neural network classifier gives the best performance in the classification of “difficult-to-diagnose” microcalcifications.
Another branch of computer-aided diagnosis for mammography deals with mass detection and stellate lesion detection on mammograms. In [22], it was determined that the length of the long axis of the masses varies in size from 6 mm to 26 mm. Compared to microcalcifications, these abnormalities are considerably larger but their detection is still difficult because they look very much like the surrounding parenchymal tissue and their contrast is usually low.
Doi et al. propose a mass detection scheme by taking advantage of the fact that normal right and left breasts [23] are symmetrical. If a tumor is developed in one of the breasts then this symmetry is disturbed. Hence, a comparison between left and right breast mammograms reveals the locations of the masses. The symmetry comparison is also a common practice for radiologists in their diagnosis of mass lesions. In computerized detection, first, left and right breast images are aligned. After suitable adjustments, the left and right breast images are subtracted from each other. The difference image shows a discrepancy at locations of mass lesions.
Gulsrud and Kjode propose a linear filter design method for the mass and stellate detection [3]. Mammograms are first filtered by a linear filter which is designed according to the Fisher criterion is defined in Equation 1.4. This filter is designed to maximally separate the local energies of the normal breast tissue and suspicious areas. The output of the filter is squared and then low-pass filtered. The operations of squaring and smoothing by low-pass filtering make it possible to segment suspicious regions by a simple thresholding. The Fisher criterion implies that the filter maximally separates the mean values of healthy and abnormal regions, while keeping the variances within these regions as low as possible. The objective function is defined as
< ( h ) + < ( h )
where /iui(h) and cTu<(h), i = 1,2 are the mean and standard deviation of normal and
suspicious regions, respectively, and these are functions of the filter coefficients, h. The optimization is achieved taking the derivative of Equation 1.4 with respect to h and equating it to zero. A simple gradient search gives the solution. However, in order to avoid the risk of converging to a local minimum, a close form of the solution is obtained. It is assumed th at the output of the filter can be modeled as separable first order autoregressive processes. Then, the close form solution is used as the initial solution for the iterative gradient search method. The mammogram image is filtered with the optimal filter. On the output of the filter, a simple thresholding separates mass and stellate lesions from the normal breast tissue. The authors use the same scheme for the detection of both mass lesions and stellate lesions, observing th at they have similar characteristics. The false alarms produced by the system are eliminated by checking the size and the circularity of the detected regions. The authors conclude th at this scheme is unable to detect mass and stellate lesions when (i) the lesion is surrounded
in the breast. The gradient search method has high computational costs. However, it needs to be computed only once for this problem and the calculation can be off-line (the parameters are obtained from a training set and these are used for all other detections).
In [22], mass lesions are detected using textual features derived from Spatial Grey Level Dependence (SGLD) matrices. The SGLD matrix S(d,9), for the image, x is defined
in terms of a distance d and an angle 9. If there are k different grey levels, {m =
1 ,.. . , k) in a:, then the size of the S(d,e) matrix is A: x A:. For each d and 9, the elements
of the SDGL matrix, S(d,e) [m, give the number of times the pixels with grey level, Lm
occur at a distance d and angle 9 relative to the pixels with grey level, (1 < m, n < A:).
From the SGLD matrix eight features are calculated which are correlation, entropy, energy (angular second moment), inertia, inverse difference moment, sum average, sum entropy, and difference entropy. SGLD matrices are calculated on mammogram images whose backgrounds are removed. Four different angles (0, 45, 90, 135) are considered and this produces 32 dimensional feature vector. This vector is averaged at four directions and an 8 dimensional feature vector is created. Next, the stepwise feature selection is performed to select the most discriminating subset of all available features. Selected features are used in linear discriminant analysis to detect masses on mammograms. The discriminant function, D, is a linear combination of the N feature variables, Fi [22]:
N
D 0/0 -l- ^ ] aiF i (1.5)
i=l
where Oj are weights calculated from the input data during training. The performance of the detection is evaluated using a receiver operating characteristics (ROC) methodology [24]. In an ROC curve, true positive rate is plotted versus false positive detection rate. ROC curves are obtained for different detection thresholds. The area under the ROC curve is a measure of the performance of the scheme with a selected threshold value. In another work, the same features are fed into a convolutional neural network classifier for classification [24].
A multiresolution framework is also used for the detection of mass lesions in [12] and stellate lesions in [25]. In [12], Daubhecies’ filter with four coefficients is used as the wavelet filter to obtain low-low subband images up to the fourth scale. In each scale SGLD matrices are calculated. Then, linear discriminant methodology described in Equation 1.5 is employed to differentiate between regions with tumor and healthy breast tissue.
In another multiresolution framework, Liu and Delp use a linear phase non-separable wavelet transform whose analysis filter, /i[m, n], is [25]:
/i[m, n] =
0 0.125 0
0.125 0.5 0.125
0 0.125 0
(1.6)
The authors choose this filter because it does not introduce phase distortions or any bias in the horizontal and vertical directions. A two-dimensional quincunx subsampling is used. Then, at each resolution, four different features are extracted for every pixel: mean pixel gray level, standard deviation of pixel gray levels, standard deviation of edge histogram, standard deviation of folded edge orientations. For classification purposes a binary classification tree is employed. The main advantage of using a multiresolution framework is that abnormalities at different sizes can be more efficiently detected.
1.3 Outline of the Thesis
In this thesis. Higher Order Statistical (HOS) methods are developed for microcalcifica tion detection on mammograms. In Chapter 2, the microcalcification modeling problem is discussed and it is concluded that deterministic microcalcification models introduced in [4, 40] are not sufficient to represent all types of microcalcifications as they can take different forms. Our modeling approach is statistical rather than deterministic. Furthermore, instead of modeling the microcalcifications on the original mammogram image, we model them in the bandpass images or in the multiresolution wavelet domain. Since microcalcifications are isolated single bright spots they appear as outliers in the bandpass images and in the wavelet domain images. Therefore, the problem of detecting microcalcification clusters is equivalent to detecting outlier clusters in these images. The linear and nonlinear filtering methods used in the first stage of the detection scheme are reviewed. Then, skewness and kurtosis based higher order statistical tests of the detection are introduced.
In Chapter 3, the regular structure of the mammogram image corresponding to
the breast is removed by the adaptive filtering in the pre-processing stage. The
series [54]. After adaptive linear prediction, a statistic of the prediction errors is computed to determine whether they are samples from a Gaussian distribution. Since microcalcifications are isolated bright spots, the prediction sequence deviates from
Gaussianity around microcalcification locations. In Chapter 3, a new HOS based
Gaussianity test is also developed which has a higher sensitivity than Ojeda et al.’s test. The concepts of the influence function and sensitivity curves are reviewed in this chapter and the sensitivity curves of the higher order statistical tests are derived. Our experiments with the mammogram database show that the proposed Gaussianity test gives better detection performance.
At the output of the HOS based detection scheme, parts of mammogram image with microcalcifications are marked as suspicious regions. Within these marked regions (or regions marked by other detection schemes), individual microcalcifications can be segmented through further processing. The shape and exact extent of microcalcifications can provide valuable information to radiologists in their diagnosis, and classification of the abnormalities as benign or malignant. They can also be used in three dimensional
reconstruction of microcalcifications within the breast structure. In Chapter 4,
several segmentation methods th at use nonlinear and adaptive filtering based ‘subband’ decomposition structures, and a statistical outlier method are introduced. After the segmentation of individual microcalcifications, they can be superimposed on to the original mammogram image to get visually enhanced images. This chapter also describes mammogram enhancement operations.
While microcalcifications are regarded as an early sign of breast cancer, two types of lesions, namely masses and stellate lesions, are indicators of cancer. An additional tool has been developed for the detection of mass lesion boundaries on mammogram images. The method is based on active contour models, which are also known as snakes. In Chapter 5, the boundary detection method is explained and a comparison is made with another, recently developed, boundary detection method which is based on fuzzy- set pre-processing and region growing. Finally, conclusions and future work are given in Chapter 6.
Chapter 2
MICROCALCIFICATION
DETECTION USING FILTERING
AND HIGHER ORDER
STATISTICS
As discussed in Chapter 1 clusters of fine, granular microcalcifications are an early sign of breast cancer in 30%-50% of the cases detected by mammography. In this chapter, microcalcification detection using filtering followed by Higher Order Statistical (HOS) analysis is described. In Sections 2.1 and 2.2, a stochastic characterization of microcalcifications is described and the database with which all the experiments
are carried out is introduced, respectively. The mammogram image is processed
by either a subband decomposition structure or a linear bandpass filter to enhance microcalcifications while suppressing the underlying breast structure. The filtered image is divided into overlapping square regions for statistical analysis. It is observed that in regions without microcalcifications, the distribution of pixel values is almost Gaussian whereas in regions with microcalcifications, the distribution is skewed due to outliers caused by microcalcifications. Therefore, skewness and kurtosis are estimated in the filtered image to identify suspicious regions. The use of nonlinear subband decomposition structures instead of linear subband decomposition as a pre-processing stage is also
Figure 2.1: Part of a mammogram image containing microcalcification cluster. investigated.
2.1 Characterization of Micro calcifications
The development of a microcalcification detection system starts with some character ization of microcalcifications [40]. Various authors have tried to model their shape, dimensions and their appearance on mammogram images. All of these approaches is deterministic.
Microcalcifications do not have a particular shape; their shapes vary from granular to rod-shaped. Morphologically, they can be classified as dust-like, worm-like, crushed
stone, etc. [42]. Figure 2.1 shows part of a mammogram image containing a
microcalcification cluster. Figures 2.2 and 2.3 give the cross sections of parts of two different mammogram images. In these figures, the arrows indicate the locations of microcalcifications. In these particular cases, microcalcifications are easy to locate due to their high contrast relative to the surrounding parenchymal tissues. However, there is no lower limit to the contrast difference and in some cases parts of the mammogram image can be brighter than microcalcifications in the mammogram image [20]. Therefore, a simple thresholding technique is not sufficient for the detection.
Strickland and Hahn model microcalcifications as circularly-symmetric Gaussian
functions by looking at the average profile of 80 different microcalcifications [4].
However, this model cannot satisfactorily represent every type of microcalcification, especially those with non-regular shapes. Actually, the resultant profile can be thought
Cross section of a part of mammogram image with microcalcifications
Figure 2.2: Cross section of a part of a mammogram image with microcalcifications. The locations of microcalcifications are indicated by arrows.
Cross section of a part of mammogram image with microcalcifications
Figure 2.3: Cross section of a part of a mammogram image with microcalcifications. The locations of microcalcifications are indicated by arrows.
of a natural result of the central limit theorem. Since the authors average quite a large set of microcalcification profiles, it is natural to expect the average microcalcification to have a Gaussian distribution.
In another modeling attem pt, Netsch describes microcalcifications as bright, circular spots and models them as cylinders of certain height and weight [40]. The following equation gives his model of a microcalcification located at (0, 0):
x [ T n , n ] = C + Co if < -^
Co otherwise
(
2
.
1)
where, x[m, n] is the intensity of the microcalcification pixels, D is the size, C is the local contrast, and Co is the local background intensity. This model can also be criticized for being over-simplified and not taking into account various microcalcification shapes.
In our approach, we do not use a deterministic explicit form of a microcalcification model. Instead, we have a stochastic approach. This approach is motivated by the fact that microcalcifications appear as impulsive outliers in subband decomposed or bandpass filtered mammogram images. This observation has been verified by our experiments as well as by those of other researchers [4, 6]. Since an outlier is “an observation (or subset of observations) which appears to be inconsistent with the remainder of that set of data” [44], this information can be used in the detection process. The key idea is to model the microcalcification clusters in the subband images as outlier clusters instead of modeling them on the original mammogram image, and to use higher order statistics to find the locations of outlier clusters in the data.
Due to this modeling approach our detection scheme consists of two stages. In the first stage, the image is processed by a filter and in the second stage, the outliers in the processed image is detected by using HOS methods. In the next section we describe the mammogram image database that we use in our experiments. In Section 2.3 we describe the first stage of the detection scheme in which the breast image area is segmented and it is bandpass filtered to enhance microcalcifications. HOS based detection, the second stage, is described in Section 2.4.
2.2 Mammogram Database
We have carried out our experiments on mammogram images taken from a set digitized by Nico Karssemeijer of University Hospital Nijmegen, The Netherlands^ The database is publicly available on the Internet [39] and is used by other researchers in the field [4, 40]. The database consists of 40 mammograms of 21 patients. Mediolateral oblique (side) and cranio caudal (top-down) views of patients are recorded with a Kodak MIN-R/S0177 screen/film combination. Both malignant and benign cases are included in the set.
Mammograms were digitized using a Eikonix 1412, 12 bits CCD camera with fixed calibration. The sampling aperture is 0.05 mm and the sampling distance is 0.1 mm. The size of the digital images is 2048 pixels by 2048 pixels. The images were corrected for inhomogeneity of the light source (Gordon planar 1417). Background pixel values (those with pixel values less than 15) were all set to a constant value. Each image is converted from 12 bits to 8 bits using an adaptive noise equalization technique, in which the noise due to film and digitization is equalized over all pixels.
For each mammogram image there is a ground truth file, in which the locations and the sizes of microcalcification clusters are marked. Individual microcalcifications are not marked in these ground truth images. These markings were recorded by two expert radiologists.
2.3 Pre-Processing of Mammogram Images
The aim of filtering the mammogram image is to remove the relatively smooth part of the image corresponding to normal breast tissue so th at detection of microcalcifications is easier and the false-positive rate decreases. The pre-processing can be accomplished through either linear filters, adaptive filters or nonlinear filters. We investigate the performance of these filters in terms of their detection eflficiency, false alarm rates
and computational complexity. In Section 2.3.1 we describe a breast boundary
detection algorithm. By carrying out the processing inside this boundary, computational complexity of the detection process is reduced. In Section 2.3.2, the bandpass linear filtering structure is explained. The filtered image is used by the statistical detection
Hmages were provided by courtesy of the National Expert and Training Centre for Breast Cancer Screening and the Department of Radiology at the University of Nijmegen, the Netherlands.
Mammogram Image
Figure 2.4: Typical mammogram image (cranio caudal view).
scheme which is explained in Section 2.4. Finally, Section 2.5 explains nonlinear
‘subband’ decomposition structures for the microcalcification detection.
2.3.1 Segmentation of Breast Region
Breast occupies only a relatively small part of the image area on a typical mammogram image. Executing the detection algorithms only within the breast area decreases the processing time significantly. Additionally, false positives obtained by the detection scheme due to markers in the image (the patient identification labels and letters to indicate the type of the view such as R, L, CC) and the sharp edge near the chest side are eliminated by the breast area segmentation.
Breast boundary is determined by using the projections which describe the extent of the breast area. The horizontal, H[n]^ and vertical, V[m], projections of a mammogram image are given as
H[n] =
Horizontal Profile of the Mammogram Image
Figure 2.5: Horizontal profile of the mammogram image in Figure 2.4.
Vertical Profile of the Mammogram Image
Figure 2.6: Vertical profile of the mammogram image in Figure 2.4.
En=l '^] V[m]
N (2.3)
where x[m, n] represents the pixel value of the digital mammogram image at the location (m, n), and the image size is M x N . For example, Figure 2.5 shows the horizontal and Figure 2.6 shows the vertical projections of the mammogram image in Figure 2.4 which shows cranio caudal (top-down) view of a breast image.
Applying a simple thresholding on these one-dimensional signals produces the corners of a rectangular region enclosing the actual breast area. Within this rectangular area, an adaptive iterative thresholding method can be employed to segment the actual breast area. As it is explained in the next chapter while discussing adaptive algorithm based detection schemes, some of the detection algorithms can work more efficiently, if realized within the segmented breast area.
In the adaptive iterative thresholding method, initially a threshold value is determined as the mid-value between the minimum pixel and the maximum pixel values. The choice of the middle value is not critical. Any value in between these extremes will do, however, such a choice may only affect the convergence speed of the algorithm depending on the values of the image pixels. For the mammogram images, one or two iterations are usually enough because the background region has an almost uniform low intensity (black).
Figure 2.7 shows the flowchart of the adaptive iterative thresholding algorithm. The image pixel values are divided into two regions by the initial threshold. One of the regions (say, black region) includes those pixels with values higher than the initial threshold and the other one (white region) contains all the other pixel values. The means of these black and white regions, m.u,,mb are calculated separately. The average of these two mean values constitutes the new threshold value, T{k) for the algorithm. The iterative algorithm continues in this manner until the difference between two successive threshold values, T{k) — T{k — 1) is less than a pre-determined number, A. As an example. Figure 2.8 shows the segmented breast area of the mammogram image in Figure 2.4, obtained by using the described adaptive iterative thresholding scheme.
Breast segmentation is not only useful for the detection schemes but also for the
compression of mammogram images. For each patient, 4 mammogram images are
recorded (mediolateral oblique and cranio caudal views of right and left breasts). Each mammogram image approximately occupies 6 Megabytes (« 2048 x 2048 pixels x 12 bits/pixel). Such a boundary delineation and breast segmentation can bring in significant storage savings even without using a further compression scheme, if only the segmented breast area is stored instead of the whole digital mammogram image.
STOP
Breast Area Segmented
Figure 2.8: Segmented breast area of the mammogram image in Figure 2.4.
2.3.2 Linear Processing of Mammogram Images
In Chapter 1, while discussing the wavelet based multiresolution microcalcification detection schemes, we mention th at these schemes are essentially equivalent to linear bandpass filtering. In Appendix A we show this equivalence. Instead of going through a subband decomposition and reconstruction stage, it is easier and much faster to implement the pre-processing using only linear filters. In our first experiments we examined the effectiveness of bandpass filtering in extracting microcalcifications while suppressing the background breast structure in mammogram images.
Our experiments with different mammogram images lead to the conclusion that a
zero-phase bandpass filter with passband |^||, is eflfective for our detection scheme.
A bandpass filter, h th at approximates this constraint has the filter coefficients given in Table 2.3.2. This filter is designed by Parks-McClellan algorithm [41]. The frequency response of the filter is shown in Figure 2.9.
The two-dimensional filter with the passband [ | f , ^ x [ | f , x is constructed in a separable manner. This filter can be implemented in a multiresolution framework but the computational cost is not heavy, therefore there is not a pressing need for multiresolution processing.
n h 0 0.6953 ± 1 0.0681 ± 2 -0.2334 ± 3 0.0106 ± 4 -0.1025 ± 5 -0.0462 ± 6 -0.0314 ± 7 -0.0144 ± 8 -0.0002 ± 9 0.0013 ± 10 -0.0002 ± 11 0.0006
Table 2.1: Filter Coefficients
Magnitude response of the overall filter
Figure 2.9: The magnitude response of the overall bandpass filter.
The choice of the bandpass filter has also an intuitive explanation. By blocking the low frequency components, the regions corresponding to the smooth breast tissue are eliminated, and the effect of noise is reduced by blocking the high frequency components.
2.4 Statistical Detection Method
As we pointed out earlier, detection of microcalcifications is carried out over the filtered mammogram image [30]. The bandpass filtered subimage is divided into overlapping square regions as shown in Figure 2.10. Figures 2.11-2.12 show the distribution of pixel values after linear bandpass filtering in regions with and without microcalcifications, respectively. The sizes of the regions are 100 pixel by 100 pixel. It is observed that the histograms of the bandpass filtered subimages are very close to the Gaussian distribution as shown in Figure 2.12.
If a region contains microcalcifications then due to the impulsive nature of microcalcifications the symmetry of the distribution of bandpass subimage coefficients is destroyed as shown in Figure 2.11. It is also evident th at the tails of the distribution are heavier. Skewness and kurtosis are Higher Order Statistical (HOS) measures of the asj^mmetry and impulsiveness of the distribution [45]. The skewness and kurtosis values for Gaussian distributed random variables is zero. In the following section, these HOS based measures are reviewed. Therefore, a statistical test based on skewness and kurtosis is effective in finding regions with asymmetrical and heavier tailed distributions.
In our detection scheme, these HOS parameters are estimated in each square region. If a region has high positive skewness and kurtosis then it is marked as a region of interest. For instance, the skewness and kurtosis estimates of the distributions plotted in Figures 2.11 and 2.12 are shown in Table 2.2. Both the skewness and the kurtosis assume very small values in the healthy breast region, while they have high values in the region containing microcalcifications. The microcalcification detection scheme using these HOS based measures is described in Section 2.4.2.
Skewness Kurtosis
Microcalcifications (Linear Processing) 1.4716 6.0538
No microcalcification (Linear Processing) 0.1173 0.0854
Table 2.2: Skewness, 73, and kurtosis, 74 estimates of the data plotted in Figures 2.11 and 2.12.
Figure 2.10: Skewness and Kurtosis are estimated in overlapping square regions.
100x100 Region with microcalcifications, distribution after linear processing
- 1 0 - 5 0 5 10 15
Magnified view of the tail
Figure 2.11: 100x100 region with microcalcifications, distribution after linear processing and magnified view of the tail.

![Figure 4.2: Adaptive Structure Analysis Stage in [52].](https://thumb-eu.123doks.com/thumbv2/9libnet/5643483.112304/84.947.170.793.137.356/figure-adaptive-structure-analysis-stage-in.webp)
