Turk J Chem (2019) 43: 687 – 704 © TÜBİTAK
doi:10.3906/kim-1810-32 Turkish Journal of Chemistry
h t t p : / / j o u r n a l s . t u b i t a k . g o v . t r / c h e m / Research Article
Modification of biomass-derived activated carbon with magnetic α-Fe
2O
3nanoparticles for CO
2and CH
4adsorption
Çisem KIRBIYIK1,2,∗,
1Department of Chemical Engineering, Faculty of Engineering, Konya Technical University, Konya, Turkey 2Department of Chemical Engineering, Faculty of Engineering, Selçuk University, Konya, Turkey
Received: 17.10.2018 • Accepted/Published Online: 30.01.2019 • Final Version: 03.04.2019
Abstract: Magnetic and nonmagnetic activated carbons (ACs) were successfully prepared by using AC obtained from
spent coffee grounds (SCGs) for use in CO2 and CH4 capture. SCGs were activated by chemical activation to produce ACs and a magnetic α -Fe2O3/AC composite was prepared by coprecipitation method from the ACs produced. Magnetic and nonmagnetic samples were characterized by X-ray diffraction (XRD), Fourier transform infrared spectroscopy (FT-IR), scanning electron microscopy (SEM), and energy dispersive X-ray spectrometry (EDX) techniques. The textural properties of samples were determined by nitrogen adsorption-desorption using the Brunauer–Emmett–Teller (BET) and Barrett–Joyner–Halenda (BJH) methods. The results showed that the porosity of AC was not blocked by α -Fe2O3 particles. According to adsorption-desorption experiments, the best results were obtained with the magnetic
α -Fe2O3/AC sample (1.68 mmol g−1 for CO2 and 0.65 mmol g−1 for CH4) at 0 °C and 120 kPa. Adsorption performances were evaluated using four isotherm models. The isosteric heats of adsorption calculated for both adsorbents were smaller than 80 kJ/mol and it revealed that CO2 and CH4 adsorption is dominated by the physical adsorption. The α -Fe2O3/AC multicycle CO2 adsorption tests showed that it can be successfully regenerated with high sorption capacity. The α -Fe2O3/AC composite is a promising adsorbent for potential application.
Key words: Magnetic composite, activated carbon, CO2 adsorption, CH4 adsorption
1. Introduction
The progressing of industrialization and increasing consumption of energy have been generating growing amounts of greenhouse gases that cause global warming and acidification of water sources.1 Carbon dioxide (CO
2) and methane (CH4) are primary greenhouse gases emitted through anthropogenic activities such as combustion of fossil fuels, transportation, and industrial processes.2,3 The CO
2 emission causes more than 50% of global warming, but CH4 emission has higher global warming potential since it is the basic source of landfill gas.4 Emissions of these gases cause serious threats because of the increasing global temperature. Therefore, the capturing of CO2 and CH4 is an important topic in scientific research areas.5 Until today, various techniques have been investigated for gas separation and purification, e.g., membrane separation,6 cryogenic distillation,7 absorption,8 or adsorption.9 Among them, adsorption has aroused interest owing to its low-cost of investment, process simplicity, and high energy efficiency.10 As concern about environmental protection grows, there is an increasing demand for porous materials capable of capturing greenhouse gases from the air. There have been ∗Correspondence: [email protected]
many studies on CO2 and CH4 adsorption onto various materials including metal-organic frameworks,11,12 zeolites,13−15 metal oxides,16,17 and carbonaceous materials.18,19 Among them, activated carbon (AC) has been widely used as carbonaceous material in many different areas due to its high surface area and porous nature.20
In recent years, many researchers have been making major efforts to produce organic/inorganic nanocom-posite materials to be used in different separation and purification processes.21 Magnetic activated carbons (MACs) are a class of these materials that have both high surface area and magnetic properties.22 Although the adsorption of various pollutants23−25 onto MACs has been extensively studied, there are limited studies on the adsorption of CO2 and CH4 gases. The modification of AC surfaces by metal oxides offers a possibility to incorporate the surface functional groups with improved affinity for gas molecules to enhance the adsorption capacities. It can be said that the basic sites of metal oxides can interact with acidic gas molecules like CO2. Despite this, the roles of metal oxides in the surface and their effect on gas adsorption capacities still remain to be explored.26
MACs have been prepared from several precursors that have high contents of carbon, e.g., carbon nanotubes,27 graphene oxide,28,29 or cellulose.30 However, the preparation of MACs from inexpensive and renewable precursors is very important because of expected utilization in future large-scale production.31 Therefore, many researchers have studied the use of alternative and renewable precursors such as different kinds of biomass materials.32 To that end, spent coffee grounds (SCGs) can be a good candidate as a precursor to produce MACs for CO2 and CH4 capture since they are waste materials generated in large amounts in modern life. SCGs have been investigated as a precursor to produce ACs or MACs and to remove various kinds of pollutants,33−35 but CO
2 and CH4 capture by MACs obtained from SCGs has not been studied to date to the best of our knowledge. This work focuses on the production of MAC derived from SCGs for CO2 and CH4 capture.
The preparation of MACs is generally achieved by coprecipitation method,36 hydrothermal method,37 or electrospinning method.38 Among them, the coprecipitation method using iron salts and AC with NH
4OH and/or NaOH as precipitating agents has been previously reported as an easy and successful method.39 There-fore, MACs obtained from SCGs ( α -Fe2O3/AC) were prepared by coprecipitation method in the present study. The characterization of raw material, ACs prepared by chemical activation and α -Fe2O3/AC, was performed by X-ray diffraction (XRD), Fourier transform infrared spectroscopy (FT-IR), scanning electron microscopy (SEM), and energy dispersive X-ray spectrometry (EDX). The ACs and α -Fe2O3/AC were examined as ad-sorbents for CO2 and CH4 adsorption at different temperatures ranging from 0 °C to 35 °C up to 120 kPa pressure. Adsorption performances of nonmagnetic ACs and magnetic AC composite were modeled using the Langmuir, Freundlich, Dubinin–Radushkevich (D-R), and Temkin isotherm models. To complement the adsorp-tion studies, the isosteric heats of adsorpadsorp-tion were calculated according to the Clausius–Clapeyron equaadsorp-tion. The recoverability of α -Fe2O3/AC was also evaluated in order to identify the possibility of MAC reusability. The aim of this study is to examine the CO2 and CH4 adsorption capacities of AC and magnetic α -Fe2O3/AC composite obtained from a sustainable precursor.
KIRBIYIK/Turk J Chem
2. Results and discussion 2.1. Characterization results
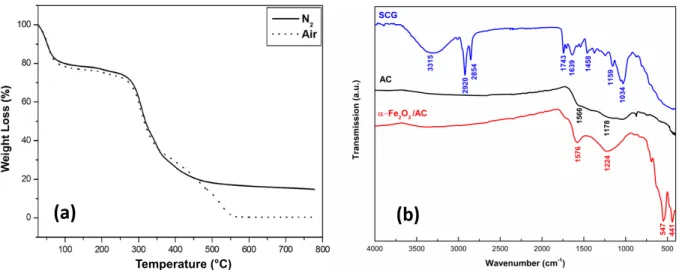
The yield of activated carbon prepared from SCGs was calculated by dividing the initial mass of dried SCGs by the resultant activated carbons after the activation process. The yield percentage of the produced activated carbon was calculated to be 15.62%. To investigate the thermal behavior of SCGs, thermogravimetric analysis (TGA) was performed (Figure 1a). SCGs showed a weight loss of 22 wt.% between 30 °C and 150 °C. As seen, a significant weight loss was observed, associating the decomposition of hydroxyl, carboxylic, and other surface functional groups between 200 °C and 500 °C. The FT-IR spectra of SCGs, prepared activated carbon, and α -Fe2O3/AC composite are given in Figure 1b. The spectrum of the SCGs shows a wide band at 3315 cm−1 due to the presence of –OH (hydroxyl). The peaks at 2920 cm−1 and 2854 cm−1 are caused by aliphatic C-H vibration. The peaks observed at 1743 cm−1, 1636 cm−1, 1159 cm−1, and 1034 cm−1 are assigned to stretching of C =O (carboxyl), C-N, and C-O-C (ester, ether, or phenol) derivatives, respectively.40,41 After the carbonization process, all peaks disappeared, indicating that many organic contents decomposed. The prepared activated carbon and α -Fe2O3/AC composite present two peaks at around 1570 cm−1 and 1200 cm−1, which are attributed to C =C vibrations in aromatic rings and C–O stretching, respectively.40,42 Compared to the spectrum of AC, the intensities of the C =C and C–O peaks of the α -Fe2O3/AC composite spectrum are significantly enhanced, indicating that the number of these functional groups is increased by the modification. It can be noted that increasing intensity of the FT-IR spectra for C =C and C–O indicates the increase in the carboxylic groups. Acid treatment introduces the acidic functional groups onto the activated carbon surface. Additionally, the spectrum of the α -Fe2O3/AC composite shows two strong peaks located at 547 cm−1 and 441 cm−1, which are the characteristic Fe-O vibration in α -Fe2O3.43
Temperature (°C)
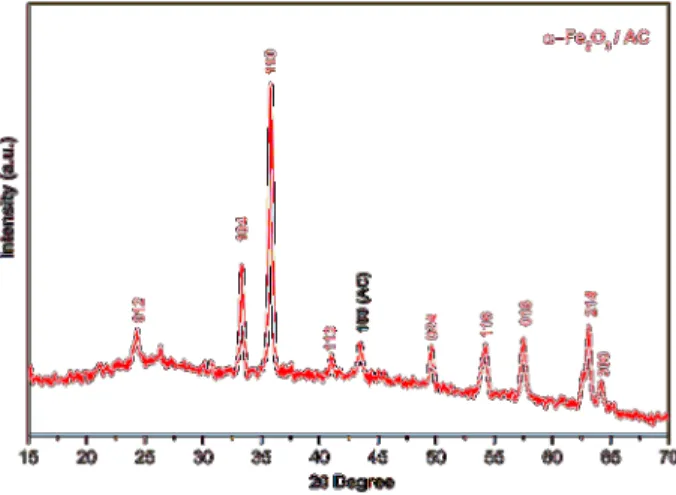
Figure 1. (a) TGA curves obtained for SCGs and (b) FT-IR spectra of SCGs, AC, and α -Fe2O3/AC composite. Figure 2 shows the XRD pattern of the α -Fe2O3/AC composite. The pattern of the sample shows a weak and broad band located at about 2 θ = 24°corresponding to the reflections of the (002) plane and a peak located at 2 θ = 44°corresponding to the reflections of the (100) plane. This indicates that the AC is in an amorphous state.44 After the AC composited with α -Fe
2O3, nine peaks appeared at (012), (104), (110), (113), (024), (116), (018), (214), and (300), which can be attributed to formation of hematite ( α -Fe2O3) with rhombohedral structure (JCPDS File No. 24-0072). This agrees well with the results obtained from the FT-IR
spectrum. Also, no other iron oxides, such as γ -Fe2O3 and β -Fe2O3, were observed, indicating that Fe2O3 was not oxidized to other forms during synthesis. Based on XRD analysis, the crystal size of α -Fe2O3 was calculated to be 18.6 nm, as determined by the Scherrer equation.
Figure 2. XRD pattern of α -Fe2O3/AC composite
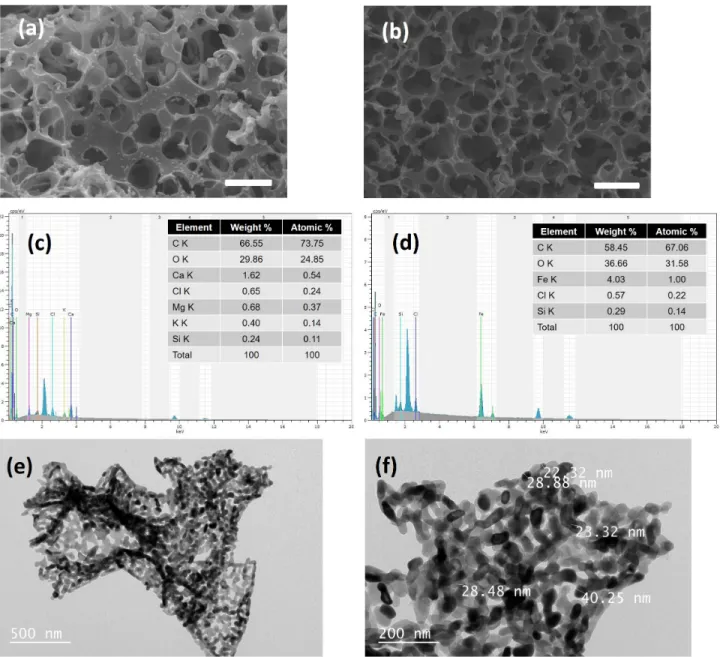
The morphologies and elements on the surfaces of activated carbon and α -Fe2O3/AC composite were investigated by SEM and EDX (Figure 3). Figures 3a and 3b show porous textures with small canals for magnetic and nonmagnetic ACs. However, it can be seen that more porous texture is observed after iron is impregnated by iron oxide. This suggests the formation of well-dispersed iron.45 In the literature, numerous pores formed between the sheets and spongier surfaces of modified adsorbent with nanoparticles in comparison to nonmodified adsorbent, suggesting well-dispersed nanoparticle formation. The EDX analysis of spectra of AC and α -Fe2O3/AC (Figures 3c and 3d) summarizes their elemental compositions. As seen, the carbon element is the main component of both ACs and no iron element was observed in nonmagnetic AC (Figure 3c). In Figure 3d, the existence of iron and the increased percentage of oxygen confirm the presence of α -Fe2O3 magnetic particles on the surface of AC. After the carbonization of the coprecipitated AC sample at 600 °C for 1 h for the production of the α -Fe2O3/AC composite, the atomic percentage of carbon decreased from 66.55% to 48.45%, indicating that the carbon was destroyed in the composite. The atomic percentage difference of oxygen calculated (6.8%) could be ascribed to the decreasing of the total initial activated carbon mass. As seen in Figures 3e and 3f, the transmission electron microscope (TEM) image of the α -Fe2O3/AC composite reveals many well-dispersed nanoparticles in the range of 22–40 nm. The figures reveal that the α -Fe2O3 nanoparticles are embedded in the pores of the carbon matrix.
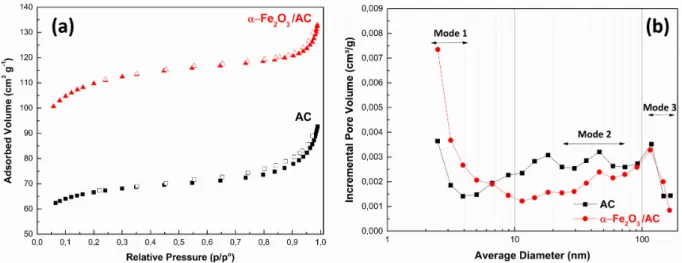
The N2 adsorption-desorption isotherms and physical characteristics of AC and α -Fe2O3/AC are given in Figure 4a and Table 1. Both AC samples show the typical type I isotherm of the IUPAC classification system with large adsorption at very low p/p° values, which denotes a microporous structure.46 Although the average pore diameter and average pore width of the composite diminished with introduction of α -Fe2O3 particles, it can be seen that nonmagnetic ACs have smaller surface areas than magnetic ACs. The surface area (375 m2 g−1) , total pore volume (0.20 cm3 g−1) , and micropore volume (0.12 cm3 g−1) of the α -Fe
2O3/AC composite showed that the porosity of AC was not blocked by α -Fe2O3 particles. This is accordant with the SEM observations. The N2 adsorption-desorption results suggested that the α -Fe2O3/AC composite material can be used for CO2 and CH4 adsorption. Figure 4b shows the incremental pore volume of AC and α
-KIRBIYIK/Turk J Chem
Figure 3. SEM images of (a) AC and (b) α -Fe2O3/AC composite (scale bar = 5 µm); EDX spectra of (c) AC and (d) α -Fe2O3/AC composite, and TEM images (e and f) of α -Fe2O3/AC composite.
Fe2O3/AC. According to Figure 4b, both samples show a multimodal pore size distribution. As seen, three main modes are detected; the first one is less than 3 nm, the second one is between 10 nm and 50 nm, and the third one is more than 100 nm. The adsorption capacity is relevant to the compatibility between the adsorbate molecule sizes and adsorbent pore size due to a high adsorption potential energy.47 In small pore volumes, small gas molecules are mainly attracted to the surface of the adsorbent in the proximity of the surface.48 In comparison with larger pore sizes, small pores could reach their excess adsorption density, even at lower pressures.
Figure 4. (a) N2 adsorption-desorption isotherms and (b) incremental pore volumes of AC and α -Fe2O3/AC.
Table 1. Physical characteristics of adsorbents.
AC α−Fe2O3/AC BET surface area (m2g−1) 225.82 375.01 Total pore volume (cm3g−1) 0.139 0.2013 Micropore volume (cm3 g−1) 0.0759 0.1169 Average pore diameter (nm) 10.705 6.949 Average pore width (nm) 2.463 2.1475
2.2. Adsorption performances
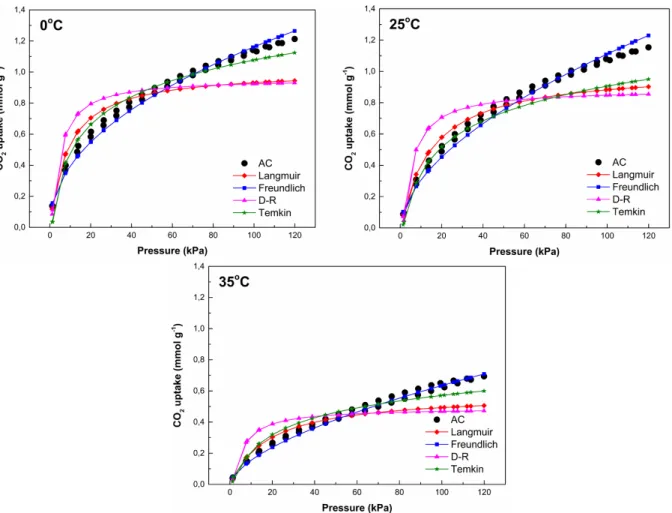
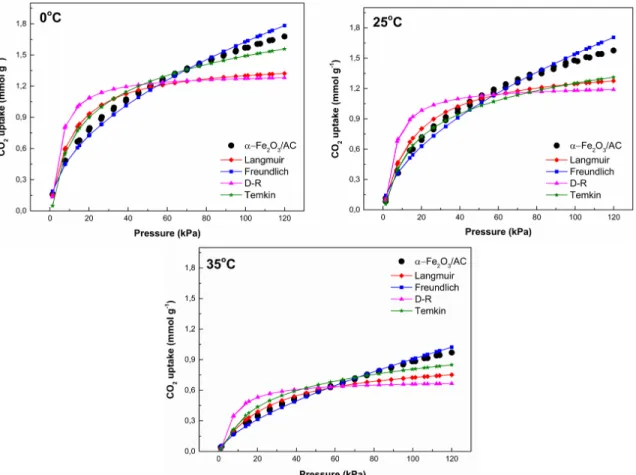
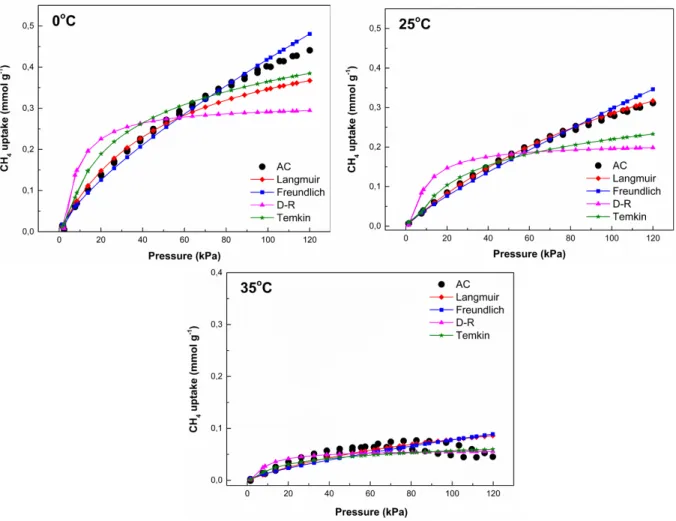
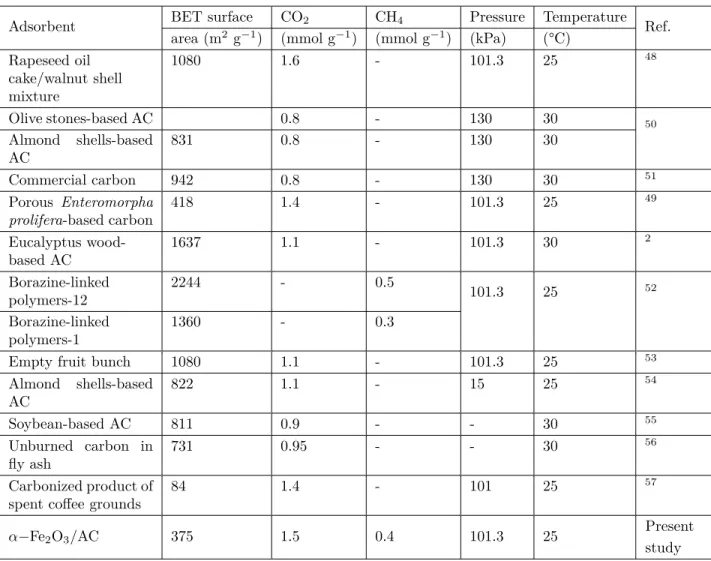
The α -Fe2O3/AC composite material showed adsorption capacities comparable to results reported for many bare or composite AC adsorbents in the literature. Comparisons of CO2 and CH4 adsorption capacities in the present study with various materials are listed in Table 2.2,49−58 Although the Brunauer–Emmett–Teller (BET) surface area of α -Fe2O3/AC obtained in this work is lower than that of other adsorbents, the adsorption capacity is relatively high. Figures 5–8 show the uptake data of CO2 and CH4 on nonmagnetic and magnetic AC samples at different temperatures (0 °C, 25 °C, and 35 °C) up to 120 kPa pressure. The CO2 and CH4 adsorption capacities ( qe(exp)) are listed in Table 3. For CO2 and CH4, the amount of adsorbed molecules increased with increasing pressure and decreased with increasing temperature. This indicates that CO2 and CH4 adsorptions are exothermic reactions. The decreasing adsorption capacities with the increasing temperature may be due to the gas molecules adsorbed obtaining sufficient energy to overcome the van der Waals forces and move back to the gas phase.2 It is well known that high adsorption capacities of adsorbents produced in ambient conditions are desired for future applications. In this study, the CO2 uptake follows the order α -Fe2O3/AC (1.47 mmol g−1) > AC (1.07 mmol g−1) while the CH4 uptake follows the order α -Fe2O3/AC (0.37 mmol g−1) >AC (0.28 mmol g−1) at 25 °C and 101.3 kPa. As is known, the adsorption behavior of adsorbents can be improved by metal impregnation of activated carbon. The results show that the presence of α -Fe2O3 has a positive effect of CO2 and CH4 adsorption, as expected. It can be seen that the α -Fe2O3/AC composite could be a promising material for gas adsorption after further improvement.
KIRBIYIK/Turk J Chem
Figure 5. Adsorption-desorption isotherms of CO2 onto AC at (a) 0 °C, (b) 25 °C, and (c) 35 °C.
2.3. Adsorption isotherm modeling
The experimental adsorption data were fitted to four isotherm models, Langmuir, Freundlich, D-R, and Temkin models, by linear and nonlinear regression. For the nonlinear method, a trial-and-error procedure was used to determine parameters of the four isotherms using an optimization routine to maximize the coefficient of determination between the experimental data and isotherms in the solver add-in with Microsoft Excel. Figures 5–8 show the comparison of experimental data of CO2 and CH4 adsorption with calculated values by nonlinear isotherm models. Additionally, the fitting parameters and regression coefficients (R2) calculated by linearization are listed in Tables 3–6. As seen from these tables, higher regression correlation coefficients (R2 > 0.97) were obtained for the Freundlich isotherms than the three other isotherm models for CO2 and CH4 adsorption onto AC and α -Fe2O3/AC composite. On the basis of the R2 values, the fits of the isotherm models follow the order of Freundlich, Langmuir, Temkin, and D-R isotherm. Also, it can be obviously noticed that the theoretical qe values calculated from the nonlinear Freundlich isotherm are more consistent with the experimental qe values. This indicates that both AC sample surfaces are heterogeneous and multilayer CO2 and CH4 adsorptions occur.59 Based on Table 4, n
F values within the range of 1–2 imply that both CO2 and CH4 adsorptions are favorable. In general trends, the Langmuir model constant KL and Freundlich model constant KF decrease with increasing temperature, indicating physisorption behavior. Table 5 lists fitting parameters calculated for
Figure 6. Adsorption-desorption isotherms of CO2 onto α -Fe2O3/AC at (a) 0 °C, (b) 25 °C, and (c) 35 °C.
the D-R isotherm model. R2 values obtained from the D-R isotherm show poor fitting of adsorption data. Also,
qmD values are not coherent with experimental adsorption qe(exp) and qmL values determined for the Langmuir isotherm model.
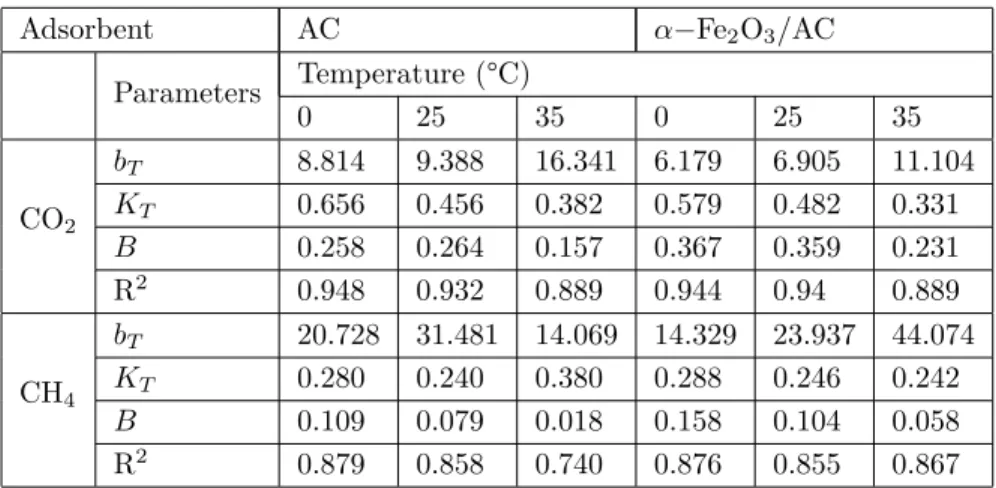
Temkin isotherm constants B and KT are presented in Table 6. B values for the CO2 adsorption onto AC decrease from 0.258 J mol−1 to 0.157 J mol−1 with increasing temperature, whereas B values for the CO2 adsorption onto α -Fe2O3/AC composite decrease from 0.367 J mol−1 to 0.231 J mol−1. For the CH4 adsorption, B values on AC decrease from 0.109 J mol−1 to 0.018 J mol−1 with increasing temperature, whereas B values on α -Fe2O3/AC composite decrease from 0.158 J mol−1 to 0.058 J mol−1. This indicates that the heats of adsorption of CO2 and CH4 to both AC samples decrease with increasing temperature from 0 °C to 35 °C.
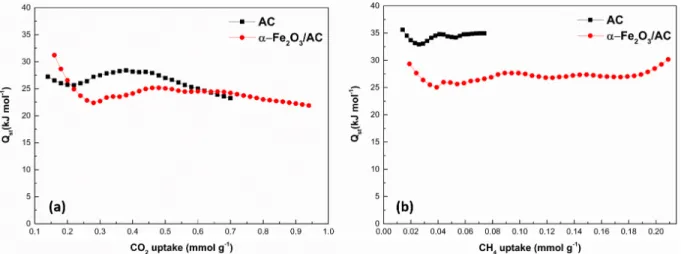
The isosteric heat of adsorption, also denoted as – ∆H (kJ mol−1) , is one of the most important thermodynamic parameters for designing and operating practical gas separation processes.60 The heat of adsorption reflects the enthalpy change of the adsorption process and it is generally defined as an indicator of interaction strength between adsorbent surface and gas molecules.61,62 Therefore, the Q
st values were calculated based on the Clausius–Clapeyron equation at the three temperatures of 0 °C, 25 °C, and 35 °C in order to complement the CO2 and CH4 adsorption studies. The calculated Qst values as functions of CO2 and CH4 uptake are given in Figure 9 for both AC samples. It can be seen that the Qst values change with surface loading. The Qst values of CO2 adsorption on the AC sample were calculated in the range of 28 to 23
KIRBIYIK/Turk J Chem
Figure 7. Adsorption-desorption isotherms of CH4 onto AC at (a) 0 °C, (b) 25 °C, and (c) 35 °C.
kJ mol−1 and, in the general trend, calculated values decreased when the CO2 uptake increased from 0.14 to 0.7 mmol g−1. The Qstvalues of CO2 adsorption on the magnetic composite sample improved from 31 to 22 kJ mol−1 with increment surface coverage from 0.16 to 0.94 mmol g−1. As seen in Figure 9, the Qst values calculated for CH4 adsorption decreased from 35 to 34 kJ mol−1 with increasing CH4 uptake (0.014–0.074 mmol g−1) for the nonmagnetic AC sample, whereas this value for α -Fe2O3/AC composite in CH4 uptake (0.019-0.21 mmol g−1) was 30–25 kJ mol−1. The variation in the Qst values with surface loading can be referred to heterogeneity of adsorption sites and also variation in adsorbate-adsorbent interactions.63 In general trends, the initial heat of adsorption values at low adsorbate loading values were high, indicating a strong interaction between adsorbent and adsorbate. The Qst values obtained for both AC samples were smaller than 80 kJ/mol and this shows that CO2 and CH4 adsorption is dominated by the physical adsorption, which agrees with the results obtained in the section of isotherm modeling.63
2.4. Multiple cycles of CO2 adsorption onto magnetic α -Fe2O3/AC composite
It is important to evaluate the regeneration performance and the reusability of adsorbents from the cost aspect. Therefore, multiple cycles of CO2 adsorption-desorption experiments were performed by using α -Fe2O3/AC
Figure 8. Adsorption-desorption isotherms of CH4 onto α -Fe2O3/AC at (a) 0 °C, (b) 25 °C, and (c) 35 °C.
Figure 9. Isosteric heats of (a) CO2 and (b) CH4 adsorption as a function of the adsorbed amount for the two adsorbents.
composite, showing better adsorption performance since the CO2 uptake is higher than the CH4 uptake onto this adsorbent. In the cycle experiments, the spent adsorbent was depressurized by using vacuum pumping
KIRBIYIK/Turk J Chem
Table 2. Comparison of the adsorbed amount of CO2 and CH4 onto porous carbons. Adsorbent BET surface CO2 CH4 Pressure Temperature Ref.
area (m2 g−1) (mmol g−1) (mmol g−1) (kPa) (°C) Rapeseed oil cake/walnut shell mixture 1080 1.6 - 101.3 25 48 Olive stones-based AC 0.8 - 130 30 50 Almond shells-based AC 831 0.8 - 130 30 Commercial carbon 942 0.8 - 130 30 51 Porous Enteromorpha prolifera-based carbon 418 1.4 - 101.3 25 49 Eucalyptus wood-based AC 1637 1.1 - 101.3 30 2 Borazine-linked polymers-12 2244 - 0.5 101.3 25 52 Borazine-linked polymers-1 1360 - 0.3
Empty fruit bunch 1080 1.1 - 101.3 25 53
Almond shells-based AC 822 1.1 - 15 25 54 Soybean-based AC 811 0.9 - - 30 55 Unburned carbon in fly ash 731 0.95 - - 30 56 Carbonized product of spent coffee grounds
84 1.4 - 101 25 57
α−Fe2O3/AC 375 1.5 0.4 101.3 25
Present study
Table 3. Langmuir isotherm constants.
Adsorbent AC α−Fe2O3/AC Parameters Temperature (°C) 0 25 35 0 25 35 CO2 qe(exp) 1.21 1.15 0.690 1.68 1.58 0.97 qmL 1.013 1.016 0.584 1.443 1.447 0.925 KL 0.114 0.066 0.054 0.091 0.062 0.036 R2 0.975 0.989 0.992 0.984 0.993 0.996 CH4 qe(exp) 0.44 0.31 0.05 0.65 0.41 0.21 qmL 0.522 0.733 0.169 0.802 0.662 0.567 KL 0.019 0.006 0.009 0.018 0.011 0.006 R2 0.999 0.999 0.999 0.999 0.999 0.999
Table 4. Freundlich isotherm constants.
Adsorbent AC α−Fe2O3/AC Parameters Temperature (°C) 0 25 35 0 25 35 CO2 KF 0.136 0.161 0.085 0.161 0.085 0.118 nF 2.149 1.989 1.792 1.989 1.792 1.514 R2 0.992 0.991 0.994 0.989 0.985 0.993 CH4 KF 0.013 0.006 0.002 0.019 0.009 0.004 nF 1.332 1.182 1.330 1.323 1.217 1.094 R2 0.992 0.992 0.900 0.992 0.994 0.998
Table 5. D-R isotherm constants.
Adsorbent AC α−Fe2O3/AC Temperature (°C) Parameters 0 25 35 0 25 35 CO2 qe(exp) 1.21 1.15 0.690 1.68 1.58 0.97 qmD 0.96 0.89 0.49 1.33 1.24 0.70 β 0.0017 0.0018 0.0019 0.0018 0.0019 0.0022 ε 17.2 16.2 16.2 16.7 16.2 15.1 R2 0.814 0.818 0.799 0.824 0.840 0.812 CH4 qe(exp) 0.44 0.31 0.05 0.65 0.41 0.21 qmD 0.31 0.21 0.06 0.45 0.28 0.16 β 0.0029 0.0030 0.0028 0.0028 0.0028 0.0029 ε 13.1 12.9 13.4 13.4 13.4 13.1 R2 0.807 0.812 0.836 0.811 0.798 0.802
Table 6. Temkin isotherm constants.
Adsorbent AC α−Fe2O3/AC Parameters Temperature (°C) 0 25 35 0 25 35 CO2 bT 8.814 9.388 16.341 6.179 6.905 11.104 KT 0.656 0.456 0.382 0.579 0.482 0.331 B 0.258 0.264 0.157 0.367 0.359 0.231 R2 0.948 0.932 0.889 0.944 0.94 0.889 CH4 bT 20.728 31.481 14.069 14.329 23.937 44.074 KT 0.280 0.240 0.380 0.288 0.246 0.242 B 0.109 0.079 0.018 0.158 0.104 0.058 R2 0.879 0.858 0.740 0.876 0.855 0.867
to remove gas adsorbed at ambient temperature. The breakthrough curve for six cycles of CO2 adsorption-desorption is given in Figure 10. As seen, the adsorption capacity of fresh sample was 1.58 mmol g−1, which
KIRBIYIK/Turk J Chem
later decreased to 1.55 mmol g−1 and 1.49 mmol g−1 after the second and third cycles, respectively. After six cycles, the adsorption capacity was found to be very close (within 3.2%) to that of the fresh sample (1.53 mmol g−1) . This suggests that the α -Fe2O3/AC composite material can be reused for multiple cycles sufficiently under similar conditions.
Figure 10. CO2 adsorption cycles for the α -Fe2O3/AC (repetitive CO2 adsorption at 25 °C followed by desorption).
2.5. Conclusions
Magnetic α -Fe2O3/AC composite material was successfully prepared by coprecipitation method from sustain-able biobased AC obtained from SCGs. The surface area of the magnetic α -Fe2O3/AC composite was higher than that of nonmagnetic AC, which makes the magnetic AC sample more available for adsorption processes. The nonmagnetic AC and magnetic α -Fe2O3/AC composite were tested for CO2 and CH4 adsorption. Com-paring the adsorption capacities showed that the magnetic α -Fe2O3/AC composite had higher capacity than the nonmagnetic AC sample. Isotherm modeling indicated that the Freundlich model could better describe the CO2 and CH4 adsorption onto both AC samples as compared to the Langmuir model. Temperature-dependent experiments showed that the temperature of 0 °C was optimum for adsorption studies. Additionally, the mag-netic α -Fe2O3/AC composite can be completely regenerated under atmospheric conditions. Therefore, this study provides further information for other composite AC studies for efficient gas adsorption.
3. Experimental
3.1. Preparation of AC and magnetic α -Fe2O3/AC composite 3.1.1. Preparation of AC
All the chemicals used in this study were of analytical grade. SCGs (Coffea arabica) were collected from domestic coffee machines. The SCG sample was washed with deionized water, dried in air, and subsequently dried in an oven at 85 °C to remove moisture. In the first step, raw material was activated using potassium hydroxide (KOH, 85%–99%, Sigma-Aldrich) as an activation agent. The SCG and KOH mixture with a mass ratio of 1:1 was kept in a dark place overnight at room temperature, then dried at 85 °C for 2 days. Subsequently, the mixture was heated in a tubular furnace from room temperature to 600 °C final temperature with a heating rate of 10 °C/min and kept for 1 h under argon atmosphere. The resulting carbonized sample was washed several
times with deionized water until the pH value of the washing solution was ~7. The washed sample was dried again in an oven at 85 °C.
3.1.2. Preparation of magnetic α -Fe2O3/AC composite powder
The preparation method for the magnetic α -Fe2O3/AC composite from AC obtained previously is given in the Scheme. First, the surface of AC was functionalized by refluxing at 70 °C for 6 h by using a mixture of nitric acid (HNO3, 65%, Sigma-Aldrich) and sulfuric acid (H2SO4, 95%–97%, Sigma-Aldrich) with a volume ratio of 1:3. This method has been previously reported to form carboxylic groups on the surface of AC.63,64 The functionalized sample was subsequently washed until the pH value of the washing solution was neutral and then dried at 85 °C. Then 10 g of functionalized AC was dispersed in 200 mL of aqueous solution containing 0.6 mol of iron chloride (FeCl3.6H2O, 99%, Merck) in 1000 mL of deionized water and magnetically stirred for 2 h at 60 °C. After that, 30 mL of 6% ammonium hydroxide solution (NH4OH, Sigma-Aldrich) was added to the mixture dropwise. The mixture solution was then refluxed at 60 °C for 2 h. Then the coprecipitated sample was filtered with vacuum pump filtration and washed with deionized water and dried. Finally, the sample was carbonized at 600 °C for 1 h under argon atmosphere to form magnetic the α -Fe2O3/AC composite. The uniformity of iron oxides onto composites can be finely tuned by maximizing the magnetic properties of the composite materials. The photograph of α -Fe2O3/AC composite in the Scheme reveals that the MAC exhibits good magnetic properties since the α -Fe2O3 particles are uniformly deposited on the surface of AC. The chemical reaction of the α -Fe2O3 formation can be represented as follows.65
Scheme. The preparation method of magnetic α -Fe2O3/AC composite from AC.
F eCl3+ 3N H4OH→ F e(OH)3+ 3N H4Cl (1) 2F e(OH)3→ F e2O3+ 3H2O (2)
KIRBIYIK/Turk J Chem
3.2. Characterization
The surface chemistry properties of raw material, nonmagnetic AC, and magnetic α -Fe2O3/AC composite were examined using an FT-IR spectrophotometer (Bruker Vertex 70) in wavenumber ranges of 400–4000 cm−1. The XRD patterns of AC and α -Fe2O3/AC composite were recorded on a Bruker D8 Advance equipped with Cu K α radiation ( λ = 0.15406 nm). The TGA analysis of SCGs was performed with a Mettler Toledo TGA/DSC 2. The morphological and elemental analyses of AC and α -Fe2O3/AC composite were carried out on a scanning electron microscope (Zeiss EVO) and by EDX along with SEM by conventional methods including mounting samples on an aluminum stub. The TEM images of the α -Fe2O3/AC composite were recorded using a JEOL JEM-2100 (UHR). The surface and pore characteristics were calculated from N2 adsorption-desorption isotherms at –196 °C using a Micromeritics TriStar II adsorption apparatus. Prior to adsorption analyses, 0.2 g of sample was outgassed at 300 °C under vacuum conditions for a period of at least 24 h. Then N2 adsorption isotherms were measured over a relative pressure (p/p°) from 0.06 to 0.99 and back. The BET specific surface area (SBET) and average pore width were determined by application of the BET equation. The pore size distribution and average pore diameter of samples were calculated using the Barrett–Joyner–Halenda (BJH) method. The microporosity of adsorbents was determined by the t-plot method using micropore volume. 3.3. CO2 and CH4 adsorption-desorption experiments
CO2 and CH4 adsorption-desorption measurements were performed using a Micromeritics TriStar II adsorption apparatus at 0 °C, 25 °C, and 35 °C up to 120 kPa. A volume of 0.2 g of sample was outgassed at 300 °C as mentioned in Section 3.2. In this study, Langmuir, Freundlich, D-R, and Temkin isotherm models were also analyzed to provide information on the adsorption mechanism. The Langmuir model is the most frequently used isotherm based on the monolayer adsorption over a homogeneous surface and is represented in Eq. (3).66
qe=qmLKLP 1 + KLP
(3) Here, qeis the equilibrium adsorption capacity, qmL(mmol g−1) is the complete monolayer adsorption capacity, P (kPa) is the equilibrium gas pressure, and KL (kPa−1) is the Langmuir adsorption equilibrium coefficient.
The Freundlich model is one of the other most frequently used isotherms to describe heterogeneous adsorption systems and is represented in Eq. (4).66
qe= KFP1/nF (4)
Here, nF (dimensionless) is the Freundlich adsorption constant and KF [(mmol g−1) (kPa−1)1/n] is the Freundlich adsorption coefficient.
The D-R isotherm model represented in Eq. (5) is more general than the Langmuir isotherm model since it does not assume a homogeneous surface or constant adsorption potential. This model is used to provide the information associated to the energy parameters in terms of mean free energy.59
qe= qmDeβε
2
(5) Here, qmD (mmol g−1) is maximum adsorption capacity, β (mol2 J−2) is the D-R constant, and ε is (J mol−1) is the Polanyi potential (equivalent to RTln (1 + 1/P)). R is ideal gas constant (8.314 J mol−1 K−1) and T is temperature (Kelvin).
The Temkin isotherm model assumes that the heat of adsorption decreases with surface coverage due to adsorbate-adsorbent interaction.67 The generalized form is given by the following equation.
qe= RT bT
lnKTP (6)
Here, bT (J mol−1) is a Temkin constant related to the heat of adsorption and KT (mmol g−1kPa−1) is a Temkin constant related to the equilibrium binding energy. Finally, the Clausius–Clapeyron equation (Eq. (7)) was applied to calculate the isosteric heat of adsorption to determine the strength and type of interaction between adsorbent and adsorbate molecules.68
Qst= R [ ∂ ln P ∂(T1) ] q (7)
Here, Qst (kJ mol−1) is the isosteric heat of adsorption. Integrating Eq. (7) gives Eq. (8):
(ln P )q= ( Qst R ) ( 1 T ) + c (8)
Here, c is a constant. Qst is calculated from the slope of the curve obtained by plotting ln P vs. 1/T.
To determine the recoverability of the magnetic α -Fe2O3/AC composite, studies on the cyclic stability were carried out through repetitive six cycles. For each cycle, adsorption processes were performed at 25 °C over the interval of relative pressure from 0.06 to 0.99 with pure CO2 and desorption processes were performed with pure N2 as the sweep gas at a relative pressure of 0.99. After each cycle, saturated adsorbents were outgassed until the pressure decreased to ≤1 mmHg overnight to remove gas adsorbed at ambient temperature.
No moisture was present during both adsorption and desorption in cyclic stability tests. References
1. Saha, D.; Bao, Z. B.; Jia, F.; Deng, S. G. Environ. Sci. Technol. 2010, 44, 1820-1826. 2. Heidari, A.; Younesi, H.; Rashidi, A.; Ghoreyshi A. A. Chem. Eng. J. 2014, 254, 503-513. 3. Mei, L.; Liu, X.; Wu J. Sep. Sci. Technol. 2018, 53, 1628-1637.
4. Yuan, B.; Wu, X. F.; Chen, Y. X.; Huang, J. H.; Luo, H. M.; Deng, S. G. Environ. Sci. Technol. 2013, 47, 5474-5480.
5. Liu, X.; Zhou, L.; Fu, X.; Sun, Y.; Su, W.; Zhou, Y. Chem. Eng. Sci. 2007, 62, 1101-1110. 6. Brunetti, A.; Scura, F.; Barbieri, G.; Drioli, E. J. Membr. Sci. 2010, 359, 115-125.
7. Maqsood, K.; Mullick, A.; Ali, A.; Kargupta, K.; Ganguly S. Rev. Chem. Eng. 2014, 30, 453-477. 8. Kato, M.; Yoshikawa, S.; Nakagawa, K. J. Mater. Sci. Lett. 2002, 21, 485-487.
9. Duan, S.; Gu, M.; Du, X. D.; Xian, X. F. Energy Fuels 2016, 30, 2248-2256. 10. Peng, X.; Wang, W.; Xue, R.; Shen, Z. AIChE Journal 2006, 52, 994-1003.
11. Hamon, L.; Jolimaître, E.; Pirngruber, G. D. Ind. Eng. Chem. Res. 2010, 49, 7497-7503. 12. An, J.; Rosi, N. L. J. Am. Chem. Soc. 2010, 132, 5578-5579.
13. Dunne, J. A.; Rao, M.; Sircar, S.; Gorte, R. J.; Myers, A. L. Langmuir 1996, 12, 5896-5904. 14. Zhang, L.; Wu, G.; Jiang, J. J. Phys. Chem. C 2014, 118, 8788-8794.
KIRBIYIK/Turk J Chem
15. Cavenati, S.; Grande, C. A.; Rodrigues A. E. J. Chem. Eng. Data 2004, 49, 1095-1101. 16. Kim, S. M.; Kierzkowska, A. M.; Broda, M.; Müller, C. R. Energy Procedia 2017, 114, 220-229. 17. Broda, M.; Müller, C. R. Adv. Mater. 2012, 24, 3059-3064.
18. Dreisbach, F.; Staudt, R.; Keller, J. U. Adsorption 1999, 5, 215-227.
19. Ribeiro, R. P.; Sauer, T. P.; Lopes, F. V.; Moreira, R. F.; Grande, C. A.; Rodrigues, A. E. J. Chem. Eng. Data
2008, 53, 2311-2317.
20. Zhang, G.; Qu, J.; Liu, H.; Cooper, A. T.; Wu, R. Chemosphere 2007, 68, 1058-1066. 21. Ranjithkumar, V.; Sangeetha, S.; Vairam S. J. Hazard. Mater. 2014, 273, 127-135.
22. Cazetta, A. L.; Pezoti, O.; Bedin, K. C.; Silva, T. L.; Paesano, A.; Asefa, T.; Almeida, V. C. ACS Sustain. Chem.
Eng. 2016, 4, 1058-1068.
23. Mahmoud, M. E.; Khalifa, M. A.; El Wakeel, Y. M.; Header, M. S.; Abdel-Fattah, T. M. J. Nucl. Mater. 2017,
487, 13-22.
24. Ranjithkumar, V.; Sangeetha, S.; Vairam, S. J. Hazard. Mater. 2014, 273, 127-135. 25. Liu, Y.; Zhu, X.; Qian, F.; Zhang, S.; Chen, J. RSC Adv. 2014, 4, 63620-63626.
26. Li, M.; Huang, K.; Schott, J.A.; Wu, Z.; Dai, S. Microporous Mesoporous Mater. 2017, 249, 34-41. 27. Bayazit, Ş. S.; Kerkez, Ö. Chem. Eng. Res. Des. 2014, 92, 2725-2733.
28. Wang, C.; Feng, C.; Gao, Y.; Ma, X.; Wu, Q.; Wang, Z. Chem. Eng. J. 2011, 173, 92-97. 29. Yao, Y.; Miao, S.; Liu, S.; Ma, L. P.; Sun, H.; Wang, S. Chem. Eng. J. 2012, 184, 326-332. 30. Luo, X.; Lei, X.; Cai, N.; Xie, X.; Xue, Y.; Yu, F. ACS Sustain. Chem. Eng. 2016, 4, 3960-3969. 31. Hao, W.; Björkman, E.; Yun, Y.; Lilliestråle, M.; Hedin, N. ChemSusChem 2014, 7, 875-882. 32. Kwiatkowski, M.; Fierro, V.; Celzard, A. J. Colloid Interface Sci. 2017, 486, 277-286.
33. Safarik, I.; Horska, K.; Svobodova, B. Safarikova, M. Eur. Food Res. Technol. 2012, 234, 345-350.
34. Jutakridsada, P.; Prajaksud, C.; Kuboonya-Aruk, L.; Theerakulpisut, S.; Kamwilaisak, K. Clean Technol. Environ.
Policy 2016, 18, 639-645.
35. Kante, K.; Nieto-Delgado, C.; Rangel-Mendez, J. R.; Bandosz, T. J. J. Hazard. Mater. 2012, 201, 141-147. 36. Zhang, L.; Li, F. Appl. Clay Sci. 2010, 50, 64-72.
37. Ai, L.; Zhang, C.; Chen, Z. J. Hazard. Mater. 2011, 192, 1515-1524.
38. Wang, L.; Yu, Y.; Chen, P. C.; Zhang, D. W.; Chen, C. H. J. Power Sources 2008, 183, 717-723.
39. Saroyan, H. S.; Giannakoudakis, D. A.; Sarafidis, C. S.; Lazaridis, N. K.; Deliyanni, E. A. J. Chem. Technol.
Biotechnol. 2017, 92, 1899-1911.
40. Reffas, A.; Bernardet, V.; David, B.; Reinert, L.; Lehocine, M. B.; Dubois, M.; Batisse, N.; Duclaux, L. J. Hazard.
Mater. 2010, 175, 779-788.
41. Foo, K. Y.; Hameed, B. H. Chem. Eng. J. 2011, 170, 338-341.
42. Ching, S. L.; Yusoff, M. S.; Aziz, H. A.; Umar, M. Desalination 2011, 279, 225-234.
43. Dong, Y. L.; Zhang, X. F.; Cheng, X. L.; Xu, Y. M.; Gao, S.; Zhao, H.; Huo, L. H. RSC Adv. 2014, 4, 57493-57500. 44. Shang, H. S.; Lu, Y. J.; Zhao, F.; Chao, C.; Zhang, B.; Zhang, H. S. RSC Adv. 2015, 5, 75728-75734.
45. Mohan, D.; Sarswat, A.; Singh, V. K.; Alexandre-Franco, M.; Pittman, C. U. Chem. Eng. J. 2011, 172, 1111-1125. 46. Rey, A.; Quiñones, D. H.; Álvarez, P. M.; Beltrán, F. J.; Plucinski, P. K. Appl. Catal. B-Environ. 2012, 111-112,
246-253.
47. Houshmand, A.; Wan Daud, W. M. A.; Shafeeyan, M. S. Sep. Sci. Technol. 2011, 46, 1098-1112. 48. Jin, Z.; Firoozabadi, A. Fluid Phase Equilib. 2013, 360, 456-465.
49. David, E.; Kopac, J. J. Anal. Appl. Pyrolysis 2014, 110, 322-332.
50. Zhang, Z. Q.; Wang, K.; Atkinson, J. D.; Yan, X. L.; Li, X.; Rood, M. J.; Yan, Z. F. J. Hazard. Mater. 2012, 229, 183-191.
51. Plaza, M. G.; García, S.; Rubiera, F.; Pis, J. J.; Pevida, C. Sep. Purif. Technol. 2011, 80, 96-104. 52. Plaza, M. G.; García, S.; Rubiera, F.; Pis, J. J.; Pevida, C. Chem. Eng. J. 2010, 163, 41-47. 53. Jackson, K. T.; Rabbani, M. G.; Reich, T. E.; El-Kaderi, H. M. Polym. Chem. 2011, 2, 2775-2777. 54. Parshetti, G. K.; Chowdhury, S.; Balasubramanian, R. Fuel 2015, 148, 246-254.
55. González, A. S.; Plaza, M. G.; Rubiera, F.; Pevida, C. Chem. Eng. J. 2013, 230, 456-465.
56. Thote, J. A.; Iyer, K. S.; Chatti, R.; Labhsetwar, N. K.; Biniwale, R. B.; Rayalu, S. S. Carbon 2010, 48, 396-402. 57. Maroto-Valer, M. M.; Lu, Z.; Zhang, Y.; Tang, Z. Waste Manage. 2008, 28, 2320-2328.
58. Plaza, M. G.; González, A. S.; Pevida, C.; Pis, J. J.; Rubiera, F. Appl. Energy 2012, 99, 272-279. 59. Rashidi, N. A.; Yusup, S.; Borhan, A. Procedia Eng. 2016, 148, 630-637.
60. Shafeeyan, M. S.; Daud, W. M. A. W.; Shamiri, A.; Aghamohammadi, N. Chem. Eng. Res. Des. 2015, 104, 42-52. 61. Himeno, S.; Komatsu, T.; Fujita, S. J. Chem. Eng. Data 2005, 50, 369-376.
62. Zhou, L.; Zhou, Y.; Sun, Y. Int. J. Hydrogen Energy 2004, 29, 475-479. 63. Singh, V. K.; Anil Kumar, E. Appl. Therm. Eng. 2016, 97, 77-86.
64. Saleh, T. A.; Tuzen, M.; Sarı, A. J. Environ. Chem. Eng. 2017, 5, 2853-2860.
65. Debnath, A.; Deb, K.; Chattopadhyay, K. K.; Saha, B. Desalination Water Treat. 2016, 57, 13549-13560. 66. Chiang, Y. C.; Hsu, W. L.; Lin, S. Y.; Juang, R. S. Materials 2017, 10, 511.
67. Matouq, M.; Jildeh, N.; Qtaishat, M.; Hindiyeh, M.; Al Syouf, M. Q. J. Environ. Chem. Eng. 2015, 3, 775-784. 68. Choma, J.; Stachurska, K.; Marszewski, M.; Jaroniec, M. Adsorption 2016, 22, 581-588.