International Journal of
Intelligent Systems and
Applications in Engineering
Advanced Technology and ScienceISSN:2147-67992147-6799 www.atscience.org/IJISAE Original Research Paper
This journal is © Advanced Technology & Science
The Effect of Feature Extraction Based on Dictionary Learning on ECG
Signal Classification
Rahime CEYLAN
1, *Accepted : 13/11/2017 Published: 30/03/2018 DOI: 10.1039/b000000x
Abstract: Feature extraction that is detection of effective features is one of the phases of biomedical signal classification. In feature extraction phase, the detection of features that increase performance of classification is very important in terms of diagnosis of disease. Due to this reason, the using of an effective algorithm for feature extraction increases classification accuracy and also it decreases processing time of classifier. In this study, two well-known dictionary-learning algorithms are used to extract features of ECG signals. The features of ECG signals are extracted by using Method of Optimal Direction (MOD) and K-Singular Value Decomposition (K-SVD). However, the extracted features are classified by Artificial Neural Network (ANN). Twelve different ECG signal classes which taken from MIT-BIH ECG Arrhythmia Database are used. When the obtained results are examined, it is seen that performance of classifier increases in usage of K-SVD for feature extraction. The highest classification accuracy is obtained as 98.74% with 5 nonzero elements in [20 1] feature vector, while K-SVD is used in feature extraction phase. The obtained results are assessed by comparing with the results obtained when discrete wavelet transform and principal component analysis are used.
Keywords: ECG Classification, Feature Extraction, K-Singular Value Decomposition, Method of Optimal Direction
1. Introduction
Electrocardiogram is a signal record which represents electrical activity of heart. The classification of heart beat as normal or abnormal is very important sign for diagnosis of cardiovascular disease. Cardiovascular diseases and detection of their underlying causes are necessary for the observation of critical patients. Artificial intelligence and machine learning algorithm have been frequently utilized in the classification of ECG signals. In many of these studies, features of ECG signals are extracted and then these extracted features are used in the classification of ECG signals. In literature, several feature extraction methods are used in ECG signal classification: Principal component analysis [1,2], independent component analysis [3], singular value decomposition [4], linear discriminant analysis [5] and discrete wavelet transform [6,7] etc. It is observed that the selection of effective features or the elimination of unnecessary features is very important to achieve the high classification performance, since features are observation data of signal. Due to this reason, it is necessary that this observation data have to carry useful information for the perfect classification. At the same time, extracted features have to be purged from unnecessary information which negatively affects classification performance. When the studies about ECG signal classification are examined; the features extracted from ECG signal are grouped into three categories: (1) Time features, (2) Statistical features and (3) Morphological features [8]. The extraction of time features is easy, for example, a QRS wave duration can be calculated using the time difference between starting time and stop time of wave [8]. In the same way, extraction of the statistical features is easy too, because this extraction process is based on applying a formulation throughout signal [9]. But, the morphological information can represent dissimilarity for each
beat in same signal class so, it is the most difficult to be quantified [8]. When the studies about ECG signal classification are examined, it is clearly seen that morphological features are obtained using the autocorrelation function, frequency domain analysis, time-frequency analysis and multi-resolution analysis, etc.[9] These methods are aimed to produce a codeword based on morphological features which expose dissimilarities between ECG signal classes and so, classification accuracy is increased [8]. Recently, the studies realized on feature extraction concentrates on dictionary learning and sparse coding. In the study realized by Lee et al. (2014) [10], K-Singular Value Decomposition (K-SVD) dictionary learning algorithm is used in ECG signal compression and 0.55% root-mean square distortion is obtained on compression rate 13:79:1 [10]. Bolouchestani et al. [11] classified normal beat, supraventricular beat, ventricular beat and fusion beat by using K-Nearest Neighbour (K-NN) clustering algorithm and K-SVD dictionary learning algorithm. According to their classification results, 668486 beats are classified with 99.3% accuracy using K-NN and K-SVD algorithms [11]. In PhD thesis study realized by Mathews [12] (2015), label consistent K-SVD algorithm is proposed for classification of ECG signals which belong to one derivation. In his study, two different feature sets based on time and morphological features are formed using five ECG signal classes (normal beat, atrial premature beat, premature ventricular contraction beat, normal-ventricular junction beat and paced beat). The feature sets formed are classified by the proposed label-consistent K-SVD algorithm and 96.56% accuracy is obtained [12]. Kalaji et al. [13] realized sparse coding for ECG signals occurred during ventricular arrhythmia by label-consistent K-SVD approach. In their study, 471 ventricular fibrillation beats and 473 ventricular tachycardia beats are classified by label-consistent K-SVD and 71.55% accuracy is obtained [13]. In the study realized by Liu et al. [8] (2016), ECG signals which consist of 8 different beat classes are separated by three different time-based regions.
_______________________________________________________________________________________________________________________________________________________________________________________________________________________________________________________________________________________________________________________________ 1 Electrical and Electronics Eng., Selcuk University, 42002, Selcuklu,
Konya, Turkey
The features are extracted from each region by dictionary learning and vector quantization. The obtained features are classified by a hybrid classifier which is performed by particle swarm optimization (PSO) and support vector machine (SVM). 8 different ECG beats are classified with 94.6% accuracy in their study [8]. In this study, sparse codes of ECG signals are obtained by using Method of Optimal Direction (MOD) and K-Singular Value Decomposition (K-SVD) and the obtained sparse codes are classified using artificial neural network (ANN) trained by backpropagation algorithm. ECG signals used in this study are taken from MIT-BIH ECG Arrhythmia Database. These signals which belong to 12 different ECG signal classes recorded in Derivation II (Lead II) consist of 318 patterns. Data set is formed by normal sinus rhythm, sinus bradycardia, ventricular tachycardia, sinus arrhythmia, atrial premature contraction, paced beat, right bundle branch block, left bundle branch block, atrial fibrillation, atrial flutter, atrial couplet and ventricular trigeminy. As a result of implemented applications, 12 different signal classes are distinguished from each other with 98.74% accuracy using sparse codes obtained by K-SVD or MOD dictionary learning algorithm. In the previous studies about dictionary learning and ECG, dictionary learning algorithm is generally used in compression of ECG signal or noise elimination. This is the first time in literature that feature extraction based on dictionary learning is implemented on 12 different ECG signal classes and the extracted features are classified by ANN. Furthermore, the obtained results are assessed by comparing with the results obtained when discrete wavelet transform and principal component analysis are used.
2. Materials and Methods
In this study, sparse representation coefficients of ECG signals are obtained by well-known dictionary learning algorithms (K-SVD or MOD). The sparse coefficient vector obtained for an ECG signal pattern is assessed as a feature vector of this pattern. The feature matrix formed by sparse coefficient vectors of 12 different ECG signal classes is classified by an artificial neural network trained by backpropagation algorithm. The detailed explanation is presented for K-SVD and MOD algorithm in Section 2.1 and 2.2. Artificial neural network is the most popular artificial intelligence algorithm, so the detailed information about it can be used in [1,2].
2.1. Method of Optimal Directions
The first of dictionary learning algorithm used in this study is Method of Optimal Directions (MOD). This method is proposed by Engan et al. [14] and it is faster than other dictionary learning algorithm in obtaining a result. Besides, the computational complexity of MOD algorithm is less than others. In MOD algorithm, first of all, the sparse representation coefficients for each pattern is found; prediction error (residual) for pattern 𝑦𝑙 is
𝑟𝑙= 𝑦𝑙− 𝐷𝑥𝑙. Here, 𝐷 is dictionary; 𝑦𝑙 is a pattern to be predicted;
𝑥𝑙 can be sparse representation of the pattern. If the size of the
pattern set to be predicted 𝑌 is 𝑁 × 𝑀, the size of 𝑋 which is the sparse coefficient matrix of Y is 𝑋 ∈ ℝ𝐾×𝑀. The size of dictionary
𝐷 is 𝑁 × 𝐾. The mean square error of prediction for all patterns can be calculated by (1) [14-16]:
𝑅𝑀𝑆𝐸= √
∑𝑀𝑖=1𝑟𝑙
𝑁×𝑀 (1)
In the beginning of MOD algorithm, 𝑋 sparse coefficient matrix found by a pursuit algorithm is fixed and obtainment of 𝐷
dictionary is aimed which is minimized error in (1). For this aim, the following steps are realized [14, 16]:
1. Initial dictionary 𝐷𝑖−1 is formed by the first 𝐾 patterns of 𝑌
(Iteration number is taken as 𝑖 = 1 in the beginning, initial dictionary can be found by different methods).
2. Sparse coefficient matrix 𝑋 is obtained by initial dictionary 𝐷𝑖−1 , pattern set 𝑌 and Orthogonal Matching Pursuit
algorithm.
3. Using sparse coefficient matrix 𝑋, dictionary 𝐷 is updated by (2).
𝐷𝑖+1= 𝑌𝑋(𝑖)𝑇. (𝑋(𝑖)𝑋(𝑖)𝑇)−1 (2)
4. Dictionary 𝐷𝑖+1 is normalized and the prediction error is
computed by (1).
5. If stopping criteria or maximum iteration number are ensured, algorithm is stopped, else 𝑖 = 𝑖 + 1 is done and it is returned to step 2.
2.2. K-Singular Value Decomposition
The second dictionary learning algorithm used in this study is K-Singular Value Decomposition (K-SVD). Like as MOD, the aim of K-SVD algorithm is to provide Equation (3). On the other words, the aim is to minimize residual error (prediction error) which is the difference between original data set and approximated data set [16-20].
min
𝐷,𝑋{‖𝑌 − 𝐷𝑋‖𝐹
2} ∀𝑖, ‖𝑥
𝑖‖0≤ 𝑇0 (3)
In Eq.(3), ‖. ‖𝐹2 represents Frobenius norm and it is computed by
‖𝑍‖𝐹2= √∑ 𝑍 𝑖𝑗2
𝑖𝑗 . ‖𝑥𝑖‖0 represents zero norm of 𝑥𝑖 vector,
simplify it is the number of nonzero elements of 𝑥𝑖. 𝑇0 expresses
the desirable sparsity level. The expression in Eq.(3) can be rewritten in Eq.(4) according to Frobenius norm [16-20]:
‖𝑌 − 𝐷𝑋‖𝐹2= ∑ ‖𝑦
𝑙− 𝐷𝑥𝑙‖22 𝑀
𝑙=1 (4)
In the beginning of K-SVD algorithm, like as MOD, sparse coefficient matrix is found by orthogonal matching pursuit algorithm. The performance of pursuit algorithm is measured with less number of nonzero elements in sparse coefficient matrix [16-20]. In dictionary update phase, dictionary is updated by using nonzero elements in sparse coefficient matrix (𝐿) in K-SVD algorithm. K-SVD algorithm consists of following steps [16-20]: 1. An initial dictionary𝐷𝑖−1 is formed by the first 𝐾 patterns of
pattern set 𝑌 (Iteration number is taken as 𝑖 = 1, initial dictionary can be found by different methods).
2. The sparse coefficient matrix 𝑋 is obtained with the initial dictionary 𝐷𝑖−1 and pattern set 𝑌 by using Orthogonal
Matching Pursuit.
3. For each 𝑑𝑘 atom, by using suitable sparse coefficients 𝑥𝑘, (5)
is solved by K-SVD. 〈𝑑𝑘, 𝑥𝑘〉 = argmin
𝑑𝑘,𝑥𝑘
‖𝐸𝑘− 𝑑𝑘𝑥𝑘‖𝐹2 (5)
where 𝐸𝑘 is expressed as 𝐸𝑘= 𝑌 − ∑𝑗≠𝑘𝑑𝑗𝑥𝑗.
4. Optimization problem in (5) is solved by SVD algorithm applying (6).
𝐸𝑘= 𝑈Σ𝑉𝑇 (6)
where 𝑈 and 𝑉 are identity matrix. Σ is diagonal matrix and it consists of singular values of 𝐸𝑘.
5. By solving (6), dictionary atom 𝑑̃𝑘 and sparse coefficient
This journal is © Advanced Technology & Science
𝑑̃𝑘= 𝑈(: ,1) (7)
𝑥̃𝑘= Σ(1,1) ∗ 𝑉(: ,1) (8)
𝑈(: ,1) and 𝑉(: ,1) represent first columns of 𝑈 ve 𝑉. However, Σ(1,1) is the biggest singular value of Σ.
6. Iteration number is increased by 1 (𝑖 = 𝑖 + 1) and return to step 2.
3. Classification of ECG Signals
In this study, ECG signals which belong to 12 different signal classes are classified by K-SVD/MOD and ANN. A block representation of implemented classifier structure is presented in Fig. 1. As seen in Fig. 1, a dataset is formed by preprocessed ECG signals. This preprocessing phase includes filtering, QRS detection and normalization. In the proposed classifier structure, first of all, a sparse coefficient vector for each ECG pattern in the dataset is obtained by using MOD or K-SVD algorithm. Each sparse coefficient vector carries the most significant feature of its ECG pattern [14] and so, ECG patterns are classified in ANN by these sparse coefficient vectors.
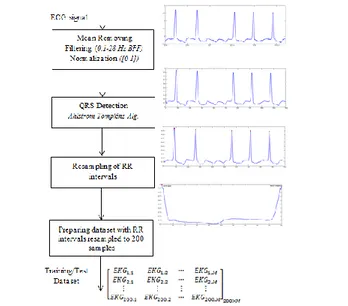
Fig. 1. A block representation of the proposed classifier structure 3.1. Preprocessing and Preparing of The Dataset
ECG signals used in this study are taken from MIT-BIH ECG Arrhythmia Database [21]. All of the ECG signal records in MIT-BIH ECG Arrhythmia Database are sampled in 360 Hz and they include ECG signal records of two derivations (for example Lead II and V5). ECG signals of Derivation II (Lead II) are used. Noise
elimination and QRS detection are applied to ECG signal records according to preprocessing steps which are presented in Fig. 2. Firstly, noises of ECG signal records are filtered by a band pass filter which has low cut-off frequency 0.1 Hz and high cut-off frequency 28 Hz [1-7, 22]. Then, localization of R points is found by a QRS detection algorithm based on first and second derivatives which are proposed Ahlstrom&Tompkins [23] and ECG patterns are obtained by separating RR intervals. Each RR interval is expressed as an ECG pattern and each pattern is resampled to 200 samples.
The features of dataset which are formed by prepocessing steps are presented in Table 1. As seen in Table 1, 318 ECG patterns which include 12 different signal classes (normal sinus rhythm and 11 arrhythmia types) are used in this study [21, 23].
3.2. Feature Extraction with Dictionary Learning
Two dictionary-learning algorithms are used to extract significant features of ECG patterns in this study. Sparse coefficients that represent each of ECG signals are obtained by Method of Optimal Directions and K-Singular Value Decomposition. When the study about feature extraction is examined, it is seen that there is no expression about how is found the optimum number of feature for a signal. Because of this reason, an experimental way is followed to detect the optimum number of feature that is extracted from
ECG patterns. So, 15 different sparse coefficient matrices are obtained. The nonzero elements in the sparse coefficient matrix are considered as the most important features that represent regarding ECG pattern. The sizes of a different dictionary and sparse coefficient matrices implemented in this study are given in Table 2.
Fig. 2. Preprocessing steps and preparing dataset Table 1. The features of ECG dataset
Table 2. The sizes of a different dictionary and sparse coefficient matrices (N: The number of feature for each pattern= 200, M: The total number of pattern in dataset=318)
3.3. Classification of ANN
The features (sparse coefficient matrix) obtained by dictionary learning algorithm are classified by ANN trained by backpropagation algorithm. In the classification of patterns given
Feature Vector Number The size of Dictionary [𝑵 × 𝑲]
The size of sparse coefficient matrix [𝑲 × 𝑴] The number of nonzero elements (L) 1 [200 10] [10 M] 1 2 [200 10] [10 M] 2 3 [200 10] [10 M] 5 4 [200 20] [20 M] 2 5 [200 20] [20 M] 4 6 [200 20] [20 M] 5 7 [200 20] [20 M] 10 8 [200 50] [50 M] 5 9 [200 50] [50 M] 10 10 [200 50] [50 M] 20 11 [200 50] [50 M] 25 12 [200 100] [100 M] 5 13 [200 100] [100 M] 10 14 [200 100] [100 M] 20 15 [200 100] [100 M] 50
Arrhythmia Number Record Abbreviation Number of pattern
Normal Sinus Rhythm 100, 103 NS 40
Sinus Bradycardia 202, 232 SB 15
Ventricular Tachycardia 200 VT 15
Sinus Arrhythmia 113 SA 30
Atrial Premature Contraction 202 APC 8
Paced Beat 107 PB 30
Right Bundle Branch Block 118, 212, 231 RBB 30 Left Bundle Branch Block 109, 214 LBB 30
Atrial Fibrillation 202, 219 AFib 30
Atrial Flutter 202 AFlut 30
Atrial Couplet 220 ACoup 30
Ventricular Trigeminy 119 VTri 30
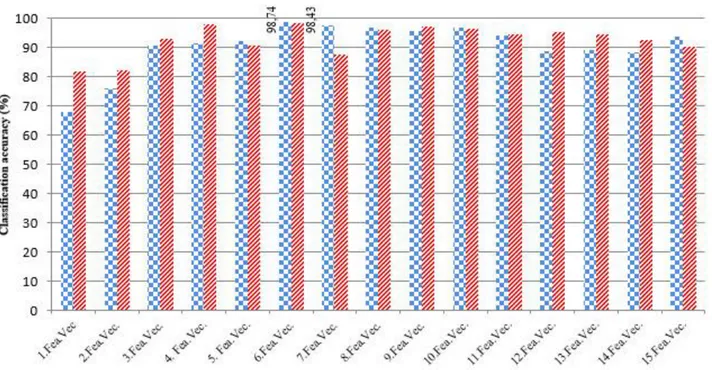
Fig. 3. The ANN classification results of 15 different feature vectors obtained by K-SVD and MOD algorithms (Learning rate and Momentum constant
are taken as 2.0 and 0.9 respectively)
Fig. 4. ANN classification results of the feature vectors obtained by PCA and DWT
in Table 1, Leave One-Out Cross-Validation is applied. So, according to leave one-out cross-validation method, the proposed classifier is trained by 317 patterns and one pattern remained is tested. When this process is completed for all of the patterns in dataset, system performance is calculated by taking mean of obtained classification results.
To determine ANN’s parameters as optimum, experiments are repeated for different number of hidden nodes, different learning rates and momentum constants. The obtained results are presented in Section 3.4.
3.4. Experimental Results
According to different sizes of dictionary and sparse coefficient matrices presented in Table 2, sparse coefficients obtained by
K-SVD or MOD algorithm are assessed as a feature vector for each pattern and these sparse coefficients are classified by ANN. Backpropagation learning algorithm is used for training of ANN. To determinate experimentally the optimum number of hidden nodes, optimum learning rate and optimum momentum constant which are the important parameters of ANN, classification results obtained with feature vectors which are found by dictionary learning algorithms are assessed. In the result of this assessment, optimum learning rate and optimum momentum constant are found as 2.0 and 0.9 in both of K-SVD-ANN and MOD-ANN structures. Besides, optimum numbers of hidden nodes, where the best classification result is obtained, are found as 10 and 30 for K-SVD-ANN and MOD-K-SVD-ANN, respectively.
This journal is © Advanced Technology & Science
The classification results obtained with optimum parameters in K-SVD-ANN and MOD-ANN structures are presented in Figure 3. When Figure 3 is examined, it can be seen that the highest classification accuracy is obtained as 98.74% with feature vector 6 (where the number of nonzero elements is 5) in ANN which is trained by feature vectors obtained by K-SVD.
Furthermore, when the classification results of feature vectors which are obtained by MOD algorithm are examined, it can be seen that the best classification accuracy is achieved by feature vector 6, like as results of K-SVD-ANN. In applications done by using MOD algorithm, the high classification accuracy is found as 98.43%.
For comparison, principal component analysis (PCA) [1,2,4] and discrete wavelet transform (DWT) [7] which are two well-known feature extraction algorithms in literature were applied to the same database. PCA is a statistical method whose purpose is to extract the information of dataset into principal components (“a few variables”) [1]. Each component contains new information about the data set, and is arranged so that the first few components account for most of the variability [1]. PCA algorithm eliminates those components that haven’t got any contribution to the variation in the data set [2]. The features which extracted by discrete wavelet transform provide an information about the energy distribution of the signal in time and frequency [6]. In this study, the detail coefficients in last level are only used as the extracted features. ANN classification results of the different feature vectors obtained by PCA and DWT are presented in Figure 4.
As seen in Figure 4, in PCA-ANN structure, the highest accuracy is found as 95.60% taking 40 hidden nodes while the number of principal components is taken as 5 (the number of features is 5). Besides, when Figure 4 is examined, it can be seen that the best classification accuracy is found as 98.43% applying two-level DWT (here the number of features is 50). The optimum number of hidden nodes is determined as 20. The results in Figure 4 are found applying leave one-out cross validation test on dataset whose features are given in Table 1.
4. CONCLUSIONS
In this study, sparse coefficient vectors which belong to ECG signals are obtained, on the other words, each signal is coded as sparse. The obtained sparse coefficient vectors include the most significant features of the signal, because it is signal’s codeword. Here, two well-known dictionary learning algorithms, K-SVD and MOD, are used to obtain sparse coefficient vectors of signals. The sparse coefficient vectors in different sizes obtained by K-SVD and MOD are classified by ANN. The implemented classifier structures and the results obtained by these structures are presented in Table 3. According to Table 3, the highest classification accuracy is obtained as 98.74% with 5 nonzero elements in [20 1] feature vector, when K-SVD is utilized in feature extraction phase. The second best accuracy value is obtained as 98.43% while using MOD or DWT in feature extraction phase, but, it can be seen that the bigger feature vector is necessary for DWT-ANN structure. Furthermore, if the times in the last column of Table 3, which are total of training and test times, are examined, it is seen that the times of K-SVD-ANN and MOD-ANN are very closely each other. These time values are the necessary durations for running of algorithm while obtaining optimum results. According to this table, DWT-ANN needs the longest time as 13.38 second for optimum results. The reason is that its optimum feature vector size is bigger than others.
Table 3. Comparison of the methods implemented in this study No Method The size of feature
vector for a pattern
Classification Accuracy (%) Time (second) 1 K-SVD-ANN [20 1] 98.74 11.41 2 MOD-ANN [20 1] 98.43 11.33 3 DWT-ANN [50 1] 98.43 13.38 4 PCA-ANN [5 1] 95.60 10.11
The detailed classification results of the methods given in Table 3 are presented in Table 4. True positive is the number of patterns with normal sinus rhythm correctly identified as normal sinus rhythm. True negative is the number of other patterns without normal sinus rhythm correctly identified as others. False positive is the number of unclassified patterns.
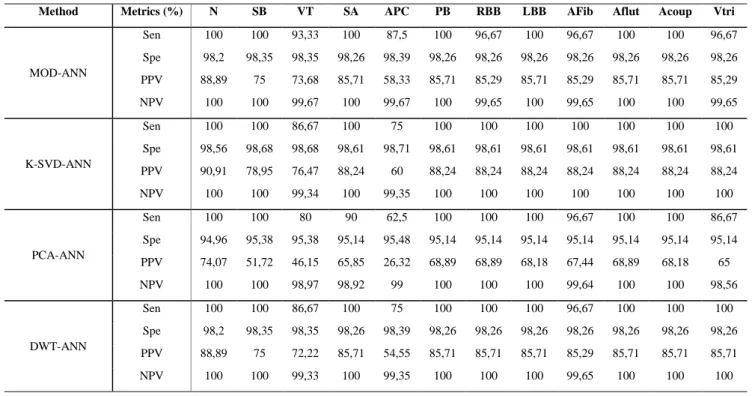
Table 4. The detailed classification results of the methods given in Table 3
Method Metrics (%) N SB VT SA APC PB RBB LBB AFib Aflut Acoup Vtri
MOD-ANN Sen 100 100 93,33 100 87,5 100 96,67 100 96,67 100 100 96,67 Spe 98,2 98,35 98,35 98,26 98,39 98,26 98,26 98,26 98,26 98,26 98,26 98,26 PPV 88,89 75 73,68 85,71 58,33 85,71 85,29 85,71 85,29 85,71 85,71 85,29 NPV 100 100 99,67 100 99,67 100 99,65 100 99,65 100 100 99,65 K-SVD-ANN Sen 100 100 86,67 100 75 100 100 100 100 100 100 100 Spe 98,56 98,68 98,68 98,61 98,71 98,61 98,61 98,61 98,61 98,61 98,61 98,61 PPV 90,91 78,95 76,47 88,24 60 88,24 88,24 88,24 88,24 88,24 88,24 88,24 NPV 100 100 99,34 100 99,35 100 100 100 100 100 100 100 PCA-ANN Sen 100 100 80 90 62,5 100 100 100 96,67 100 100 86,67 Spe 94,96 95,38 95,38 95,14 95,48 95,14 95,14 95,14 95,14 95,14 95,14 95,14 PPV 74,07 51,72 46,15 65,85 26,32 68,89 68,89 68,18 67,44 68,89 68,18 65 NPV 100 100 98,97 98,92 99 100 100 100 99,64 100 100 98,56 DWT-ANN Sen 100 100 86,67 100 75 100 100 100 96,67 100 100 100 Spe 98,2 98,35 98,35 98,26 98,39 98,26 98,26 98,26 98,26 98,26 98,26 98,26 PPV 88,89 75 72,22 85,71 54,55 85,71 85,71 85,71 85,29 85,71 85,71 85,71 NPV 100 100 99,33 100 99,35 100 100 100 99,65 100 100 100
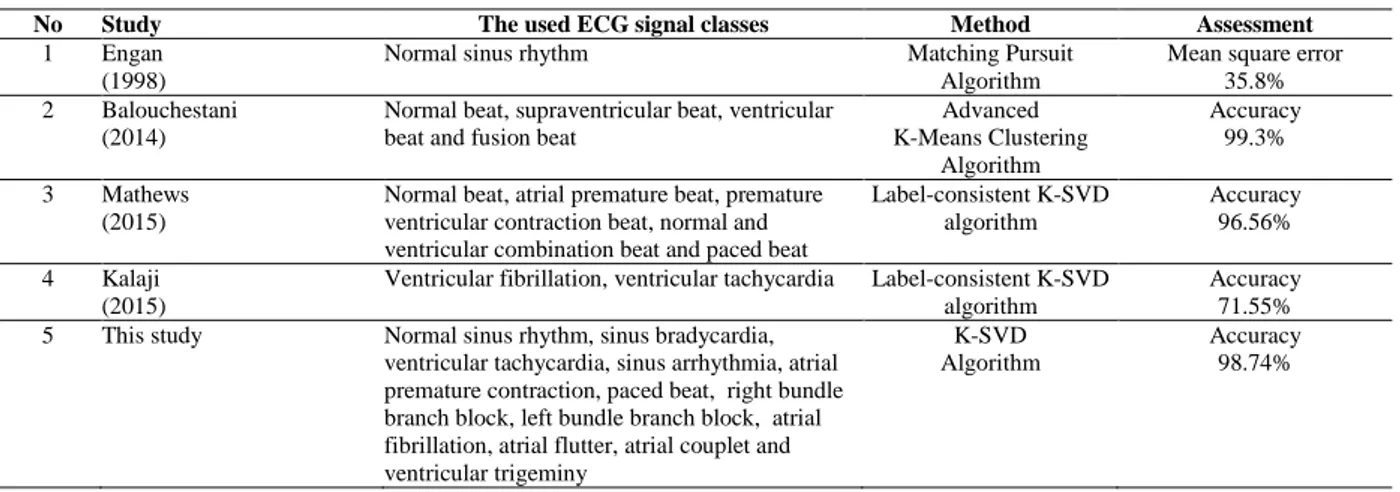
Table 5. Comparison of the studies in literature
No Study The used ECG signal classes Method Assessment
1 Engan (1998)
Normal sinus rhythm Matching Pursuit
Algorithm
Mean square error 35.8% 2 Balouchestani
(2014)
Normal beat, supraventricular beat, ventricular beat and fusion beat
Advanced K-Means Clustering Algorithm Accuracy 99.3% 3 Mathews (2015)
Normal beat, atrial premature beat, premature ventricular contraction beat, normal and ventricular combination beat and paced beat
Label-consistent K-SVD algorithm Accuracy 96.56% 4 Kalaji (2015)
Ventricular fibrillation, ventricular tachycardia Label-consistent K-SVD algorithm
Accuracy 71.55% 5 This study Normal sinus rhythm, sinus bradycardia,
ventricular tachycardia, sinus arrhythmia, atrial premature contraction, paced beat, right bundle branch block, left bundle branch block, atrial fibrillation, atrial flutter, atrial couplet and ventricular trigeminy
K-SVD Algorithm
Accuracy 98.74%
False negative is the number of patterns without normal sinus rhythm incorrectly identified as normal sinus rhythm. As can be seen in Table 4, K-SVD –ANN are classified a large amount of arrhythmia types with 100% sensitivity and 98.6% specificity. A comparison between this study’s results and studies in literature is made and presented in Table 5. As can be seen from Table 5, in this study, the number of ECG signal classes is more than other studies about ECG and dictionary learning. The first study in Table 5 which is presented by Engan is not based on signal classification, but this study is the first study which includes “ECG” and “dictionary learning” keywords. For this reason, Engan’s study is localized in this table. When other studies in Table 5 are examined, it can be seen that the results achieved in this study are better than results of other studies in the literature.
REFERENCES
[1] F. Castells, P. Laguna, L. Sörnmo, A. Bollmann, J.M. Roig, “Principal Component Analysis in ECG Signal Processing”, EURASIP Journal on Advances in Signal Processing, vol.2007, Article ID:74580.
[2] A. Sharma, T. Sharma, “ECG Beat Recognition using Principal Components Analysis and Artificial Neural Network”, International Journal of Electronics Engineering, vol.3(1), pp.55-58, 2011.
[3] S.N. Yu, K.T. Chou, “Combining Independent Component Analysis and Backpropagation Neural Network for ECG Beat Classification”, Proceedings of the 28th IEEE EMBS Annual International Conference, New York City, USA, Aug-2008.
[4] T. Punithavalli, S. Sindhu, “PCA and SVD based
feature reduction for cardiac arrhythmia classification”, International Journal of Engineering research and Technology, vol.3(9), September, 2014.
[5] M.F. Shinwari, N. Ahmed, H. Humayun, I. Haq, S. Haider, A. Anam, “Classification Algorithm for Feature Extraction using Linear Discriminant Analysis and Cross-correlation on ECG Signals”, International Journal of Advanced Science and Technology, vol.48, November, 2012.
[6] Q. Zhao, L. Zhang, “ECG Feature Extraction and Classification Using Wavelet Transform and Support Vector Machines”, International Conference on Neural Networks and Brain (ICNN&B’05), 13-15 Oct-2005.
[7] S.Z. Mahmoodabadi, A. Ahmedian, M.D.Abolhasani, “ECG
Feature Extraction Using Daubechies Wavelets”,
International Conference Visualization, Imaging and Image Processing, 7-9 September, 2005, Spain.
[8] T. Liu, Y. Si, D. Wen, M. Zang, L. Lang, “Dictionary Learning for VQ feature extrction in ECG beats classification”, Expert Systems with Applications, Vol.53, pp.129-137, July, 2016. [9] A. Kar, L. Das, “A Technical Review on Statistical Feature Extraction of ECG Signal”, IJCA Special Issue on Computing, Communication and Sensor Network, CCSN-2011.
[10] S.J. Lee, J. Luan, P.H. Chou, “A New Approach to Compressing ECG Signals with Trained Overcomplete Dictionary”, International Conference on Wireless Mobile Communication and Healthcare (Mobilhealth), 2014. [11] M. Balouchestani, L. Sugavaneswaran, S. Krishan,
“Advanced K-means Clustering Algorithm for Large ECG Data Sets Based on K-SVD Approach”, International Symposium on Communication Systems, Networks and Digital Sign, 2014.
[12] S.M. Mathews, “Leveraging Discriminative Dictionary Learnng Algorithms for Single Lead ECG Classification”, PhD Thesis, 2015.
[13] I. Kalaji, K. Balasundaram, K. Umapathy, “Discriminative Sparse Coding of ECG During Ventricular Arrhythmias Using LC-K-SVD Approach”, IEEE Eng Med Biol Soc, EMBC-2015.
[14] K. Engan, S. O. Aase, J. H. Husoy, “Method of Optimal Directions for Frame Design”, IEEE International Conference on Acoustic, Speech and Signal Processing, pp.2443-2446, 1999.
[15] K. Engan, S. O. Aase, J. H. Husey, “Designing Frames for Matching Pursuit Algorithms”, ICASSP’98, pp.1817-1820, May 1998, Seattle-USA.
[16] Emrah Yavuz, “Dictionary design for sparse representation of signal”, Master Thesis, İstanbul Technical University, Natural Science Institute, 2011.
[17] Özden Bayır, “Dictionary Learning Algorithm for Synthesis Sparsity and Image Processing Applications”, Master Thesis, İstanbul Technical University, Natural Science Institute, 2015.
[18] M. Elad, M. Aharon, “Image Denoising via Sparse and Redundant Representations Over Learned Dictionaries”, IEEE Transactions on Image Processing, vol.15, no.12, pp. 3736-3745, December 2016.
This journal is © Advanced Technology & Science
[19] C. Rusu, B. Dumitrescu, “Stagewise K-SVD to Design Efficient Dictionaries for Sparse Representations”, IEEE Signal Processing Letters, vol.19, no.10, pp. 631-634, October, 2013.
[20] Y. Tang, Y. Shen, A. Jiang, N. Xu, C. Zhu, “Image Denoising via Graph Regularized K-SVD”, IEEE International Symposium on Circuits and Systems(ISCAS), 2013. [21] Physionet Database, Access time: April-2017.
[22] R. Ceylan, “A telecardiology system design using feature extraction techniques and artificial neural network”, PhD Thesis, Selcuk University, Natural Science Institute, 2009. [23] G. M. Friesen, T. C. Jannett, M. A. Jadallah, S. L. Yates, S.
R. Quint, H. T. Nagle, “A Comparison of the Noise Sensitivity of Nine QRS Detection Algorithms”, IEEE Transactions on Biomedical Engineering, vol.37, no.1, 1990.