Comparative Analyses of the 4WD Tractor Performance with
Two Different Mouldboard Plow Bottoms by Using FEM
Saad AL-deen M. Amen ERGECH1 Hussein Th. TAHİR2
Geliş Tarihi: 31.01.2008 Kabul Tarihi: 10.06.2008
Abstract: A theoretical work was performed to model and design the bottom of a cylindroidal type
mouldboard plow. The aim of the work was to compare and evaluate the performance of the two different types of mouldboard plow (designed and type 113) in two soil depths (15-20 and 20-25 cm) and three forward speeds (4.4, 6, 9 km/h). Some design indicators involved in the study; draft force, von mises stress and bending moment which were analyzed with using a finite element methods (FEM). Some soil indicators involved; plowing appearance, the degree of tilth, the evens of the plowing surface and the angle of inclination. The data were then analyzed statistically with using randomized complete block design for all indicators and characteristics. Designed mouldboard plow was found to be significantly superlative over the 113 mouldboard plow with all design indicators since the draft force, von mises stress and bending moment were less. The results showed draft force, von mises stress and bending moment increased by increasing forward speed with a constant depth, and also showed the draft force, von mises stress and bending moment increased by increasing the depth with a constant speed for both plows in the theoretical and experimental results. Best performance results were obtained in 15-20 cm soil depth with 9 km/h forward speed.
Key Words: Mouldboard plow design, draft force, finite element methods (FEM), bending moment.
Dört Tekerleği Muharrik Traktör ile Çekilen İki Farklı Kulaklı Pulluğun
Performanslarının FEM ile Karşılaştırmalı Olarak Belirlenmesi
Öz: Silindirik formda bir kulaklı pulluk model ve tasarımı için teorik bir çalışma yapılmıştır. Bu çalışmada
dizayn edilen pulluk ile tip 113 pulluğunun performansları iki farklı toprak derinliğinde (15-20 ve 20-25 cm) ve üç farklı hız kademesinde (4.4, 6,9 km/h) karşılaştırmalı olarak yapılmıştır. Çalışmada ele alınan dizayn parametreleri; çeki kuvveti, von misses stresi, eğilme momenti sonlu elemanlar yöntemi (FEM) ile analiz edilmiştir. Ele alınan bazı toprak göstergeleri; pulluk izi, eğim derecesi, pulluk yüzey ve açısıdır. Tesadüfi deneme blokları kullanılarak elde edilen veriler istatistiksel olarak analiz edilmiştir. Dizayn edilen kulaklı pulluğun tüm dizayn göstergelerinde çeki kuvveti, von misses stresi ve eğilme momenti bakımından, 113 tip pulluktan daha az olmak suretiyle daha iyi performans gösterdiği bulunmuştur. Sonuçlar, ilerleme hızı arttıkça çeki kuvveti, von misses stresi ve eğilme momentinin arttığını göstermiştir. Aynı şekilde artan toprak işleme derinliklerinde çeki kuvveti, von misses stresi ve eğilme momentinin de arttığı görülmüştür. En iyi performans ise 15-20 cm toprak derinliğinde 9 km/h ilerleme hızında elde edilmiştir.
Anahtar Kelimeler: Kulaklı pulluk dizaynı, çeki kuvveti, sonlu elemanlar yöntemi (FEM), eğilme momenti.
Introduction
Bernacki et al. (1972) reported that during tillage, the size and direction of the (torque force) changes continuously and the components Kx and Ky increase under any soil conditions together with increase in tillage depth until (25 cm), while the component Kz may assume various values depending on the setting angles of the share and above all on the sharpness of the share. If the share is sharp, the component Kz with increase in tillage depth.
Bernacki et al. (1972) also reported that the quality of the inversion of furrow slice is measured by means of profilometers of various constructions. On the basis of profiles thus obtained the angle of inclination of furrow slices can be determined, as also the value of their transversal displacement, the width of the furrow bottom, and the degree of tilth which expresses percentage increase in the volume of slices plowing.
1 Col. of Agric. / Kirkuk University 2
Wilkinson and Braunbeck (1977) mentioned the angle of the furrow slice in the real relationship to quality of plowing. The angle or slope of the furrow slice is influenced by the speed of plowing, curvature of mouldboard, ratio of depth to width of cut and levelness of plow. The best slope when the angle is 500 and the slope-too flat when the angle is 350.
Culpin (1981) reported that the size and shape of furrow slices are determined by the construction of the plow body and by setting. The aim with this plow is to set up the slices so that they lie at an angle of 450 to the horizontal and leave equal areas of soil exposed on each side of the apices of the slices in the finished work.
ASAE (1992) indicates that draft force varies linearly with plowing depth and bottom width. The cutting width also alters the degree of pulverization; plowed clod size is proportional to cutting width (Gill and Vanden Berg 1968).
Within the range of operating speed (5 to 10 km/h) covered by ASAE (1992), the draft force-speed relationship is quadratic due to the acceleration imparted to the soil during furrow inversion (Kermis 1978).
Zeytinoglu (2002) demonstrated in research (the total draft force) was taken from literature (7308.45 N) with speed (7.2 km/h) belonging to the three point hitched single mouldboard plow and the strength analysis on the curved beam of plow was done using finite elements method according to the total draft force. He obtained von mises (68.67 MN/m2) considering as maximum value at which the machine work safely.
Cutter design: The position and the length of
cutter were determined for plow moving in the field fig (6). This site will be near to the extension of shear end to play a role in possibility replacing the role of landside. The shape, position and the angle of inclination were selected after using finite element method (FEM), the ellipse shape with 300 was selected as an angle of inclination to be best shape side functioning performance and to get less values of distributed stress. Figure (1) and (2) illustrates cutter design and stress distribution (von mises) with their values respectively.
Shear strain energy per unit volume theory:
The failure will happened when shear strain energy component in complex stress system equal to there similarity in yield point of tensile test. This theory has considered the basis of design especially with elastic material. This theory called von mises condition.
When (
3
0
) this theory of failure conditioncan be:
2
1 2 1 2 2 1 21
/
2
(
)
y
(1) 2 1 2 2 2 1 2y (2) ) / )( / ( ) / ( ) / ( 1 1 y 2 2 y 2 1 y 2 y (3)y
2
: failure condition (N/m2 )
.: Loading stress (N/m2 ). (Mulla, 1989).The stress on the plow leg: The stress on the
plow leg is mostly a bending stress which indicates the theory of failure (behavior). The von mises demonstrated by using F.E.M. as numerical method indicated in Figure (4).
Stress at section A-A of the plow leg: The
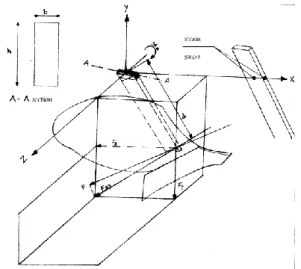
stress upon the plow is depending on the moment produced by the force acting at the center of resistance of the plow. In the average soil condition the center of resistance worked out with considerable variations; (soil condition, depth of furrow, the length of the land side of the plow, number of plow bodies, the type. The geometry of the plow leg according to the soil resistance force has been drawn in three dimensional axis of (x, y, z plane) Figure (3). Simple flexure formula for the stress calculation at section A-A of the moldboard has been used.
M=F.d (4) M: The moment (Nm), F: Force (N), d: Vertical dimension (m) R / E y / I / M (5) I / My (6)
I: Moment of inertia of area;
y: The distance between axis center to the leg section for applied stress;
E: Modulus of elasticity;
R: Radial curved for axis center of section For the rectangular section the section modulus is
y / I 6 / bh S 2 (7) 6 / y bh I 2 (8) 2 bh / M 6 (9) b: section width (m), h: section length (m)
1 5 .5 c m 1 0 c m 8 cm 8 cm 8 cm 4 cm 4 cm R1= 13 c m R 1 = 1 3 c m O1 O2 30o
Figure 1. Systematic view of cutter design
Figure 2. The ellipse shape of the cutter with (von mises) stress distribution.
Figure 3. Forces acting on the plow leg sections A-A at the x and y plane.
The M equal Mz and the dimensions of b and h are shown in fig. (4) For the simplicity of the calculation the following assumption have been based this experiment. The calculations depended upon the vertical leg of both plows; the inertial forces resulting from the action of variable soil resistance is disregarded and no rotation around x -y axis.
Figure 4. Sample of von mises stress distribution on plow leg.
Draft force and plowing appearance: The draft
force is the best-important force for obtaining satisfactory accomplishment, and from the view point of the theoretical mechanics, the draft indicator (dynamometer) used to measure draft force (Culpin, 1981).The suitable shape and the degree of uniformity were obtained on the bases of profiles and other parameters to make better plowing.
The degree of tilth: Expresses percentage
increase in the volume of slices after plowing as the tilth index may be considered the soil porosity after plowing (Bernacki et al., 1972):
100 * a/a)) ((
δw (10)
The evens of the plowing surface: The furrow
slice should be given a uniform twist across its cross-section obtain uniform tilth (Wilkinson and Braunbeck, 1977). The uniform has been determined and computed from standard deviation to responsible the surface after plowing.
( xi ( xi ) /n)/(n 1) SD 2 2 (11) xi/n X (12)
Where:
SD: standard deviation, X: average of data summation, Σ Xi : data summation,
Σ Xi2: summation of square data, (Σ Xi)
2
: square data summation, N: number of data.
Furrow crowns should be of uniform height and have a desirable depth of groove between slices. A desirable depth of groove is (7.62-10.16 cm) from the top of the crown to the bottom of the groove (Wilkinson and Braunbeck, 1977).
Material and Method
Field experiments were carried out in the Al-Abbasy field, 80 km south west Kirkuk city. The soil in the test site was clay. The field moisture content was 17.5%. During the test M.F.2 298, 4-WD 298 Model, with maximum power 110 hp. was used
Description of two mouldboard plow
113 plow: usual mouldboard plow-113; cutting
width 1.05 cm, mounted, 3 bottoms of 35 cm width and designed to depth 27 cm.
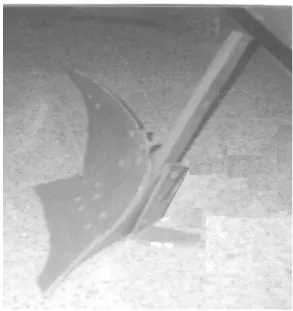
Designed plow: this mouldboard plow was
designed and then constructed from researchers in AL-tasahul factory in Kirkuk city; cutting width 120 cm, mounted, 3 bottoms of 40 cm width, designed to depth 30 cm and side cutter. Figure (5) illustrates the designed plow.
Testing and selection of designed mouldboard bottoms steel:
Plow legs: were made of (St.37) according (DIN)
characteristics, Tensile strength (340-470 N/mm2) with (115) rigidity (Gustev, 1978).
Designed mouldboard bottoms: were involved
(mouldboard, shear and side cutter) were carried out following process:
Material examination: materials were tested in
Mosul technical institution. The chemical pieces were
classified as (low alloy steel) type according to the properties indicated in table 1 and physical properties of designed plow bottom pieces as follow; A: mouldboard piece (7 mm thickness).B: side cutter piece (10 mm thickness).C: shear piece (12 mm thickness) (Table 1).
Material test: Tensile- test was used with three
pieces, to testing mechanical properties of materials. (Rahmet-Allah, 1985) (Table 2).
Strain meter and strain gages: The type of
strain meter instrument was B A M-1 Bridge amplifier and meter. The type of strain gage was Rosette-KFC-5-D17-11L 300. Made in Japan, With follow characteristics: thermal out put (± 1.8 / C0
), gage factor (2.08±1 %), gage resistance (Ω120±0.6), gage length (5 m.m.), gage factor change with temperature (0.015 %/C0), adoptable thermal expansion (10.8 PPM/C0). Three forward speeds of 4.4, 6 and 9 km/h were used for two plows. The chosen plowing depths were within the ranges of 15-20 cm and 20-25 cm. A randomized complete block design of three replications was used with (2*2*3 treatments) for all indicators as an experimentally test (Dawod and Abdulyas, 1990).
Figure 5. Designed plow bottom with the cutter
Table 1. The chemical properties of designed plow bottom pieces.
(%) Mo (%) Cr )%( Mn (%) Si (%)C Type / 0.6 0.5 0.3 0.15 (A) Properties according AISI=1050 calcifications
0.2 1.1
0.7 0.3
0.5 (B+C) Properties according AISI=4150 calcifications
Table 2. The physical properties of designed plow bottom pieces.
Pieces type Yield stress N/mm2
Percentage extension (%)
A 440 11
B+C 885 9
Results and Discussion
The stress on the leg of plow: In the theoretical
results, von mises stress increased by increasing the depth with constant forward speed for both 113 and designed plows. The designed plow recorded a least values of stress than plow 113. The designed plow recorded with the first depth (15-20 cm) least von mesis (42.20 MN/m2) while plow 113 recorded (45.28 MN/m2). At the second depth (20-25 cm) the plow 113 recorded (58.27 MN/m2) a highest von mesis than designed plow (53.31 MN/m2). Von mises stress increased by increasing the depth with constant speed. Generally the experimental results gave higher values than theoretical results. This may be due to the possibility of occurance wirh other forces that play important role in increasing the stresses as resultant on the plow leg during working. Increasing of depth led to increase the soil masses applying on the body of plow and as a sequence causing increasing in the applying pressure which was agreed with (Tahir, 2004). For the experimental results the designed plow recorded at first depth (15-20 cm) least von mesis (42.83 MN/m2) than plow 113 (46.00 MN/m2). The plow 113 recorded at second depth highest von mesis (58.27 MN/m2) than designed plow (53.94 MN/m2). Von mises stress increased by increasing forward speed with a constant depth for both plows theoretically and experimentally. The designed plow was superiorly on the plow 113 since the stress was less. The cause of increasing stress by increasing speed may be due to that increasing of speed led to increase applying momentum on a plow body. The designed plow recorded with the first speed (4.4 km/h) least von mesis (42.34 MN/m2) and (42.94 MN/m2) for theoretical and experimental results respectively, plow 113 recorded (45.94 MN/m2) and (46.48MN/m2) respectively. The designed plow recorded with the second speed (6km/h) least von mesis for theoretical and experimental results as (49.59 MN/m2) and (50.20 MN/m2) respectively. The plow 113 recorded (52.60 MN/m2) and (53.35 MN/m2). The designed plow recorded with the third speed least von mesis (51.35 MN/m2) and (52.03 MN/m2) for theoretical and experimental results respectively and plow 113 recorded (55.75 MN/m2) and (56.50 MN/m2) respectively. These results were agreed with (Zeytinoglu, 2002).
Bending moment on the plow leg: The moment
was increased by increasing the depth with constant forward speed and also increased by increasing the speed with constant the depth for both plows in the theoretical results. In comparison with the experimental results the moment behavior with the speed and depth had the same as in the theoretical results by using finite elements method, but the results were higher and agreed with (Tahir, 2007). The design plow recorded with the first depth (15-20 cm) least moment on the leg of plow (1410.31 Nm) and (1473.65 Nm) for both theoretical and experimental results respectively, while plow 113 recorded (1513.53 Nm) and (1584.66 Nm) respectively. The plow 113 recorded with the second depth (20-25 cm) highest moment on the leg of plow (1924.12 Nm) and (1995.82 Nm) for theoretical and experimental results respectively, while the designed plow recorded (1782.03 Nm) and (1847.15 Nm) respectively. The designed plow recorded with the first speed (4.4 km/h) least moment on the leg of plow (1415.04 Nm) and (1475.12 Nm) for both theoretical and experimental results respectively, while plow 113
recorded (1534.98 Nm) and (1598.06 Nm)
respectively.
The effect of interaction between two mouldboard plows with depths and speeds on the design indicators: Table 3 shows the designed
moldboard plow with (15-20 cm) depth and (4.4 km/h) recorded least value comparing with other treatments. The designed moldboard plow with (15-20 cm) depth and (9 km/h) recorded best response draft force (12.72 kN), theoretical von mesis (43.39 MN/m2), experimental von mesis (45.15 MN/m2), theoretical bending moment (1449.98 Nm) and experimental bending moment (1561.24 Nm). The 113 moldboard plow with (20-25 cm) depth and (9 km/h) recorded not better value comparing with other treatments.
Soil characters: Characters related to the quality
of tillage: From Table 4 the important treatments of tillage quality was demonstrated directly after tillage process for both plows, which demonstrated the behavior of plow dealing with the soil as end result. So that it is important to evaluate suitability of plow with the soil which reflect the good or bad quality of design since it consider as final design elements (Gill and Vandenberg,1967), (Bernacki et al., 1972) consider the quality of tillage as an important measurable reflect the good quality of tillage so it consider as integral for other characters and indicators that studied as indicators of design. Such treatment linked the level of evens of furrow surface. The tilth degree (indicator of pulverization), transversal displacement of furrow bottom and the angel of inclination of furrow slice.
Table 3. The effects of the interaction between two plows with depths and speeds on the design indicators The design indicators
The s p e e d (k m/ h r) The d e p th (c m) P low
s bending moment Experimental
(Nm) Theoretical
bending moment (Nm) Experimental
von mesis stress (MN/m2) Theoretical von mesis stress (MN/m2) Draft force (kN) 1481.21 k 1419.99 j 43.14 j 42.49 i 12.46 cd 4.4 15-20 1 1 3 P low 6 9 13.56 cd 13.81 cd 47.10 e 46.26 f 47.01 g 48.82 f 1546.12 g 1574.49 f 1621.24 g 1669.55 f 1714.90 e 1649.96 e 50.02 e 49.26 d 14.47 bc 4.4 20-25 6 17.28 a 58.94 b 60.69 c 1969.92 c 2144.97 c 2317.60 a 2152.48 a 67.15 a 64.40 a 18.38 a 9 1391.00 l 1331.29 k 40.42 k 39.82 j 11.67 d 4.4 15-20 De s ign e d P low 1514.98 i 1449.98 i 44.04 i 43.39 h 12.72 cd 6 1561.24 h 1449.98 i 45.15 h 43.39 h 12.72 cd 9 1505.98 j 1499.12 h 45.15 h 44.85 g 13.15 cd 4.4 20-25 6 16.35 ab 55.78 c 56.35 d 1864.45 d 1929.65 d 2192.58 b 1982.52 b 62.01 b 59.31 b 17.39 a 9
Numbers with the same letters are not different significantly by Duncan’s Multiple Range Test at P ≥ 0.05
First treatment: Table 4 and figure (7) illustrates
the interaction effect of plow 113 with first depth (15-20 cm) and first speed (4.4 km/h), figure (8) illustrates the interaction effect of the designed plow .there was slightly deference between both plows for their effect on the level of evens of furrow surface. The transversal displacement of furrow bottom and tillth degree (indicator of pulverization) was higher with the designed plow than plow 113. The designed plow recorded a least angel of inclination of furrow slice than plow 113, but the results slightly close to each other. These treatments indicated that this treatment was suitable for both plows, slightly to the designed plow side.
Second treatment: Table 4 and figure (9)
illustrates the interaction effect of plow 113 with first
depth (15-20 cm) and second speed (6 km/h), figure(10) illustrates the interaction effect of the designed plow .there was closely values for both plows for their effect on the level of evens of furrow surface, which in turn reflect the extend of regularity of tillage soil this was agreed with (Wilkson and Braunbeck, 1977) that the furrow slice must gave regular twist of cutters and the level of the evens of surface to notch it was regularity reflect the state of good tillage. The tillth degree and transversal displacement of furrow bottom were higher with the designed plow than plow 113. The design plow recorded a least angel of inclination of furrow slice than plow 113. This treatment indicated that this treatment and interaction of both plows with first depth and second speed can be considered a suitable since it was within dependable extensions. This result was agreed with (Tahir, 2007).
Table 4. The effects of the interaction between two plows with depths and speeds on plowing quality parameters
The treatments Soil characteristics The spe e d (k m/ h r) The dep th (c m) P low s
The evens of the plowing surface (cm) The degree of tilth (%) The angle of inclination (o) Transversal distance (cm) First treatment 4.5656 49.95 57.5 20 4.4 15-20 1 1 3 P
low 6 9 2122 5656 56.9659.67 4.27074.7204 Second treatmentThird treatment
Fourth treatment 6.5062 48.58 58 19 4.4 20-25 6 20 58 53.78 6.5607 Fifth treatment Sixth treatment 7.0861 57.91 62 21.5 9 First treatment 4.4105 64.21 53 24 4.4 15-20 D e s ign e d P low Second treatment 4.2420 64.74 52 25 6 Third treatment 4.0134 65.48 51 26.5 9 Fourth treatment 6.0767 55.52 56 24.5 4.4 20-25 6 25.3 54 60.94 5.6129 Fifth treatment Sixth treatment 6.5766 62.83 54 26 9
Third treatment: Table 4 and figure (11)
demonstrates the interaction effect of plow 113 with first depth (15-20 cm) and third speed (9 km/h), figure (12) illustrates the interaction effect of the designed plow. There was wide deference between both plows for their effect on the level of evens of furrow surface to side designed plow. The tillth degree and transversal displacement of furrow bottom were higher with the designed plow than plow 113. The angel of inclination of furrow slice seen to be inversely proportion with the increasing speed in the same depth for the designed plow, plow 113 behavior in the same manner to the second speed then increased at the third speed, possibly the cause due to increasing of momentum of the plow on the soil which increased the width, so that the transversal displacement of furrow bottom directly in-relation with the increasing speed for both plows, this was agreed with (Al-tahan et al., 1995). These treatments reflect the extension of plow in dealing with the soil at constant depth and increased speed and the effect of this increasing on the plow work.
Fourth treatment: Table 4 and figure (13) shows
the interaction effect of plow 113 with second depth (20-25 cm) and first speed (4.4 km/h), figure (14) illustrates the interaction effect of the designed plow. There was slightly close to each other values for both plows for their effect on the level of evens of furrow surface. The tillth degree and transversal displacement of furrow bottom were higher with the design plow than plow 113. The designed plow recorded a least angel of inclination of furrow slice than plow 113. But the results slightly close to each other. These treatments indicate that this treatment was suitable for both plows according to the previous indictors.
Fifth treatment: Table 4 and figure (15)
illustrates the interaction effect of plow 113 with second depth (20-25 cm) and second speed (6 km/h), figure (16) illustrates the interaction effect of the designed plow. There were differences between both plows for their effect on the level of evens of furrow surface, the designed plow recorded a least value. The tillth degree and transversal displacement of furrow bottom were higher with the designed plow than plow
113. The angel of inclination of furrow slice was recorded by designed plow better than the plow 113.
Sixth treatment: Table 4 and figure (17)
illustrates the interaction effect of plow 113 with second depth (20-25 cm) and third speed (9 km/h), figure (18) illustrates the interaction effect of the designed plow. The designed plow was superiorly to the plow 113 in their effect on the level of evens of furrow surface and the angel of inclination of furrow slice by recording a least values. The tillth degree and transversal displacement of furrow bottom were higher with the designed plow than plow 113.
On increasing speed there was an increasing in the level of evens of furrow surface with the depth (20-25cm), the angel of inclination of furrow slice reduced till the second speed (6km/hr) then elevated. The transversal displacement of furrow bottom also increased by increasing forward speed at the same depth. The degree of the tillth was decreased by increasing speed at the same depth for the plow 113. For the designed plow the level of evens of furrow surface decreased by increasing speed till second speed then increased where as the tillth degree increased till second speed then decreased at third speed. The angel of inclination of furrow slice was reduced by increasing the speed. The transversal displacement of furrow bottom also increased by increasing speed at the same depth which agrees with (Taniguchi et al., 1999) that on increasing the transversal displacement of furrow bottom with speed in general at this depth (20-25 cm) increasing of forward speed till (6 km/h) it is good for both plows. Increasing the speed up to (9 km/h) at depth (20-25cm) gave a suitable result for the designed plow than plow 113, this may be due to that the designed plow a more suitable to deal with the soil.
Increasing of the speed led to increase the pulverization. This result was agreed with (Al-banna et al., 1986). the presence of the cutter play a role in reducing the draft force which as a sequence reduce the stresses apply on body & leg of designed plow and also play a role in increasing of pulverization soil masses.
First treatment of designed plow -25 -20 -15 -10 -5 0 5 10 15 20 0 20 40 60 80 Distance (cm) So il a p p e a r a n c e h e ig h t (c m )
First treatment of plow 113
-25 -20 -15 -10 -5 0 5 10 15 20 0 20 40 60 80 Distance (cm) So il a p p e r a n c e h e ig h t (c m ) Fig: (8) Fig: (7)
Second treatment of designed plow
-25 -20 -15 -10 -5 0 5 10 15 20 0 20 40 60 80 Distance (cm) So il a p p e a r a n c e h e ig h t (c m )
Second treatment of plow 113
-25 -20 -15 -10 -5 0 5 10 15 20 0 20 40 60 80 Distance (cm) S o il a p p e a r a n c e h e ig h t ( c m ) Fig: (10) Fig: (9)
Third treatment of designed plow
-25 -20 -15 -10 -5 0 5 10 15 20 25 0 20 40 60 80 Distance (cm) So il a p p e a r a n c e h e ig h t (c m )
Third treatment of plow 113
-25 -20 -15 -10 -5 0 5 10 15 20 25 0 20 40 60 80 Distance (cm) So il a p p e a ra n c e h e ig h t (c m ) Fig: (12) Fig: (11)
Forth treatment of designed plow -25 -20 -15 -10 -5 0 5 10 15 20 25 0 20 40 60 80 Distance (cm) So il a p p e a r a n c e h e ig h t (c m )
Forth treatment of plow 113
-25 -20 -15 -10 -5 0 5 10 15 20 25 30 0 20 40 60 80 Distance (cm ) S o il a p p e ra n c e h e ig h t (c m ) Fig: (14) Fig: (13)
Fifth treatment of desined plow
-25 -20 -15 -10 -5 0 5 10 15 20 25 0 20 40 60 80 Distance (cm) So il a p p e a ra n c e h e ig h t (c m )
Fifth treatment of plow 113
-25 -20 -15 -10 -5 0 5 10 15 20 25 0 20 40 60 80 Distance (cm ) S o il a p p e a ra n c e h e ig h t (c m ) Fig: (16) Fig: (15)
Sixth treatment of designed plow
-25 -20 -15 -10 -5 0 5 10 15 20 25 0 20 40 60 80 Distance (cm) So il a p p e a ra n c e h e ig h t (c m )
Sixth treatment of plow 113
-25 -20 -15 -10 -5 0 5 10 15 20 25 0 20 40 60 80 Distance (cm ) S o il a p p e a ra n c e h e ig h t (c m ) Fig: (18) Fig: (17)
References:
AL-banna,T.H., Karim, S., M. Amin and A.H.Salman. 1986. Effect of traveling speeds of some plows on tilth quality at Eski-kalak. Zanco, 4(2): 51-62.
AL-tahan, Y.H., S.H.Amin and H.H.AL-Abdullah. 1995. Effect of plowing speeds on the field performance of moldboard and disc plows. J. Agric. & forestry College- Mosul, 27(1): 77-80.
ASAE. D497. 1992. Agricultural machinery data-Draft and power requirements. In ASAE standards. 293-299. St. Joseph.
Bernacki,H., J.Haman, Cz. Kanafojski. 1972. Agricultural Machines, Theory and Contraction. Vol.1, Spring field, 111: Nat. Technical Information Servece.
Culpin, C., 1981. Farm Machinery. 10th Ed, Granda, London, U.K.
Dawod, Kh.M. and Z.Abdulyas. 1990. Statistical procedures for Agricultural researches. Printed in Dar AL-kutub, Mosul Univ., Iraq.
Gill, W.R. and G.E. Vanden Berg. 1967. Soil dynamics in Tillage and Traction.U.S.Gorernment printing office, Washinghton, DC.
Gustev, N. 1978. Machine elements desigen & calculation in Mechanical engineering. Vol 1, springer-verlg, Allied publishers private limited.
Mulla A.S.M.J. 1989. Mechanics of material. Translated from Aeian john hiran. Printed in Dar AL-kutub, Mosul Univ., Iraq.
Rahmet-Allah, H.B. 1985. Principles of material engineering. Translated from Billy. Printed in, Mosul Univ., Iraq. Tahir, H.Th. 2004. Mechanical design of moldboard plow
bottom throw stress analyses and performance measurement. Ph.D. Thesis, Mosul Univ., Iraq. Tahir, H.Th. 2007. Performance efficiency of 4WD tractor with
two moldboard plows (the designed and usual 113) and measuring some power requirement and soil indicators. A special issue for the first scientific conference for agricultural researches. Kirkuk University. J. Kirkuk Univ., 2 (2): 104-125.
Taniguchi, T; J.M. Makanga; K. Ohtomo, and T. Kishimoto. 1999. Draft and soil Manipulation by a Moldboard plow under Different Forward speed and body attachments. Transaction of ASAE, 42 (6):1517-1521.
Wilkinson, R.H. and O.A.Braunbeck. 1977. Elements of agricultural machinery. Vol(1), FAO Agricultural Services Bulletin. Rome. Italy.
Zeytinoglu, M. 2002. A Research on strength of the curved beam of plow by using Finite Elements Method. J. Agric. College- Bursa, 16 (2): 169-176.
Communication Adress:
Saad AL-deen M. Amen Ergech Col. of Agric. / Kirkuk University