Erosion Risk Mapping Using CORINE Methodology for Goz
Watershed in Kahramanmaras Region, Turkey
M. Reis1∗, A. E. Akay2, and G. Savaci3
ABSTRACT
Soil erosion may cause serious environmental impacts on soil and water resources such as excessive sedimentation, especially on steep terrain and erodible soils in arid and semi-arid areas. The sediment yield due to erosion has also economic consequences on dam watersheds by affecting economic life of dams, which are one of the most important infrastructure investments in Turkey. Thus, it is very important to determine potential erosion risk in order to develop adequate erosion prevention measures in dam watersheds. This study aimed to develop erosion risk map for Goz Watershed of Menzelet Dam in the eastern Mediterranean city of Kahramanmaras in Turkey. In the methodology, Remote Sensing (RS) and Geographic Information System (GIS) technologies were employed based on COoRdination of INformation on the Environment (CORINE) methodology. The results indicated that 54.52% of the Goz Watershed was under moderate erosion risk, while there was a high erosion risk in 45.48% of the watershed based on the potential erosion risk map. According to actual erosion risk maps, 11.97 and 88.03% of the watershed area was subject to moderate and high erosion risk, respectively. It was found that the most important factors for erosion risks in the watershed were steep slope (average of 38%) and lack of vegetation cover (only 11.67% of forest cover). Besides, the results indicated that potential and actual erosion risk mapping by CORINE method is a quite efficient and cost effective approach.
Keywords: Climate factors, CORINE, Dam watershed, Erosion risk, Land use.
_____________________________________________________________________________
1
Department of Forest Engineering, Faculty of Forestry, Kahramanmaras Sutcu Imam University, 46100 Kahramanmaras, Turkey.
∗ Corresponding author; e-mail: [email protected] 2
Department of Forest Engineering, Faculty of Forestry, Bursa Technical University, 16200 Bursa, Turkey. 3
Department of Forest Engineering, Faculty of Forestry, Kastamonu University, 37100 Kastamonu, Turkey.
INTRODUCTION
Over recent decades, soil erosion by water has become a worldwide issue because of the progressive decrease of the ratio of natural resources to population. Besides, soils have been increasingly exposed to erosion for different reasons such as inappropriate agricultural practices, deforestation, overgrazing, forest fires, and construction activities (Terranova et al., 2009).
In Turkey, the average altitude is approximately 1,141 m and about 34% of the total land has a slope over 20%
(Elibuyuk and Yilmaz, 2010). Because of the topographic conditions, soil erosion is one of the most important environmental problems in Turkey since approximately 73% of the land is subject to severe and very severe soil erosion (Dogan, 1998).
The control of soil erosion processes depends on appropriate land use and management planning. Soil erosion tends to alter physical, chemical, and biological properties of soil, due to undesirable interaction among climate, soil, topography, and vegetation (Pla, 1997). Besides, the sediment yield due to erosion results in environmental impacts on water quality and
aquatic habitat (Akay and Sessions, 2005; Akay et al., 2008). In Turkey, over 345 million tons of sediment enters the rivers, lakes, dams, and seas per year (GDREC, 2008). Sustainable management and conservation activities in dam watersheds are crucial for natural resources and national economy.
There have been several models developed to estimate sediment yield, run off, and erosion risks such as RUSLE (Revised Universal Soil Loss Equation), EPIC (Erosion Productivity Impact Calculator), ANSWERS (Areal Nonpoint Source Watershed Environment Response Simulation), ICONA (Institute for the COnservation of the NAture), WEPP (Water Erosion Prediction Project), and CORINE (COoRdination of Information on the Environmet). (Wischmeier, 1976; Beasley et al., 1980; CORINE, 1992; Flanagan and Livingston, 1995; Bayramin et al., 2006).
CORINE (1992) methodology was developed based on USLE (Universal Soil Loss Equation) (Wischmeier, 1976) for studies of soil erosion. The advantage of CORINE is in providing estimated erosion risk areas quickly and efficiently for the entire study area (Yuksel et al., 2008a). The actual soil erosion risk is computed based on two parameters including potential soil erosion risk and vegetation cover data. Soil erodibility, erosivity, and topographical data are used to calculate the potential erosion risk. The influence of vegetation cover is also considered, since it is a very important parameter in erosion models (Lal, 1994; Kılıc et al., 2006; Evrendilek et al., 2007; Yuksel et al., 2008b; Aydin and Tecimen, 2010).
The accurate erosion risk maps generated by using GIS techniques are very important spatial data to locate the areas with high erosion risks and to develop erosion prevention techniques (Mitasova et al., 1996; Vrieling, 2002). Sadeghi (2005) conducted a study where GIS technologies were successfully used for semi-erosion mapping based on the criteria mentioned by United States Bureau of Land Management
(USBLM) and RS data. Sazbo et al. (1998) also indicated that GIS analysis provide satisfactory results in developing erosion risk maps.
The main purpose of this study was to determine the soil erosion risk in Goz Watershed located in the Mediterranean city of Kahramanmaras in Turkey, by using CORINE methodology. Goz Watershed was selected as the study area because this watershed yields water and sediment into the Menzelet Dam, which is one of the important sources of irrigation water and drinking water in the region. During the analysis process, the impact of the climate, soil properties, slope, and vegetation factors on erosion were analyzed separately, in order to evaluate the potential and actual soil erosion risks in the area. The input files for climate, soil properties, slope, and vegetation were generated as digital data layers using GIS and RS tools and they were integrated with the CORINE methodology to produce erosion risk maps.
MATERIALS AND METHODS Study Area and GIS Data
Goz Watershed, a sub-watershed of Menzelet Dam was selected as the study area. The watershed is 45 km away from the city of Kahramanmaras and has an area of 1,336.6 ha (Figure 1). It is located between the latitudes of 37° 39' 58'' and 36° 40' 54'' North, and the longitudes of 36° 54' 28'' and 36° 57' 59'' East. The average elevation and ground slope was 1,295 m and 38%, respectively.
The study area is characteristic to Mediterranean climate with average annual precipitation of slightly over 700 mm. In the region, precipitation is usually in winter and spring seasons. The average annual temperature is 16.7°C, while maximum and minimum temperatures are 45.2 (July) and – 9.6°C (February), respectively. Soils is the majority of the study area consist of Alfisols formed on limestone (Dinc et al., 2001).
Figure 1. Goz Watershed of Menzelet Dam in Kahramanmaras.
Topographic maps at 1:25,000 scale were used to generate Digital Elevation Model (DEM) of the study area. The slope map was then produced based on the DEM using ArcGIS 9.2 software. The maps of soil texture, soil depth, and stoniness were generated based on soil maps (1:25,000), produced by The General Directorate of Rural Service. Land cover types were classified by using a supervised classification method of ERDAS Imagine 8.3 based on LANDSAT TM imagery to determine vegetation factor. Finally, these digital input files were integrated with CORINE methodology to generate potential and actual erosion risk maps.
CORINE Methodology
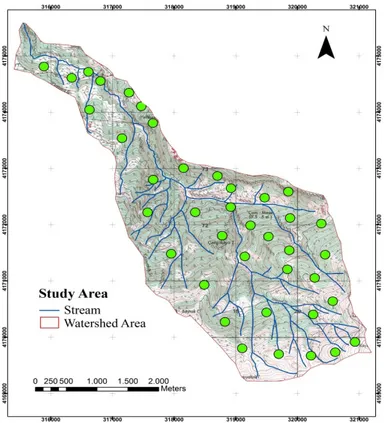
In CORINE methodology, four parameters including soil erodibility, erosivity, topography (slope), and land cover are used to evaluate the potential and actual soil erosion risks. Soil erodibility factor can be defined as sensitivity of soil against the corrosive forces such as rainfall and wind. Soil texture, stoniness, and depth parameters were analyzed to determine soil erodibility value. In soil texture analysis, total of 39 soil samples were taken from 0-20 cm depth considering two bedrock types i.e. limestone
and sandstone three general land use types i.e. agriculture, forest, rangeland, and seven replicates based on Factorial Trial Design methodology (Steel and Torrie, 1980).
Figure 2 indicates the soil sampling points in the study area. Then, only those soils that passed through a 2 mm sieve were evaluated in laboratory. Soil texture class map was interpolated with “Thiessen Polygon” for the whole watershed. Soil texture classification was made according to USDA texture classification (SSM, 1993).
In the CORINE methodology, soil texture was grouped into three classes including: Slightly erodible (1), Moderately erodible (2), and Highly erodible (3) (Figure 3). Soil maps were used in order to classify soil stoniness and soil depth, which are important indicators of erosion. The stoniness was classified as: Fully protected (1), and Not fully protected (2) soils, by considering the percentage surface cover of stones. The soil depth, which is the depth from the soil surface to the base of the soil profile, was classified as slightly erodible (>75 cm) (1), moderately erodible (25-75 cm) (2), and highly erodible (<25 cm) (3) soils. Finally, the soil erodibility index was calculated by multiplying these three soil factors (CORINE, 1992; Bayramin et al., 2003; Aydın and Tecimen, 2010) and reclassified Kahramanmaras
Figure 2. Soil sampling points in the study area.
into classes of: Low (1), Moderate (2), and High (3).
Erosivity factor can be defined as detachment and transportation of soil due to raindrop impact and runoff (Lal, 1994). The erosivity was calculated based on two climatic indices: the Fournier index and Bagnouls-Gaussen aridity Index (BGI). Fournier index was used to measure erosivity at a regional scale (Fournier, 1960). The Fournier Index (MFI) was then modified by Arnolds (1980) considering total precipitation in a month (Pi) and total
mean annual precipitation (Pa) (Arnolds,
1980; Sadeghi and Tavangar, 2015):
∑
==
12 1 i a 2 iP
P
MFI
(1)The MFI was classified into five classes including: Very low (1), Low (2), Moderate (3), High (4), and Very high (5). Since the MFI could not consider the moisture stress, the BGI was used as the second climatic index to consider moisture stress, which may increase the soil erosion due to reduction of vegetation cover. The BGI is computed as a function of the temperature and precipitation (Arnolds, 1980):
∑
= − = 12 1 ) 2 ( i i i i P k T BGI (2)Where, Ti is the mean temperature for the month, Pi is the total precipitation for month, and ki is the proportion of the month during which 2Ti-Pi> 0. The BGI was classified into: Humid (1), Moist (2), Dry (3), and Very dry (4). Finally, erosivity index was determined by multiplying Fournier and Bagnouls-Gaussen aridity indices. The input data of precipitation and temperature were obtained from the nearest weather station in Kahramanmaras for the period of 1985-2010. Finally, erosivity index was reclassified into: Low (1), Moderate (2), and High (3) (Figure 3).
In CORINE methodology, the topographic factor (slope) is one of the key factors in estimating erosion. The topographic factor was defined as the average regional slope, which was mapped in ArcGIS 9.2 based on
topographic maps derived DEM. Then, the slope data layer was classified into four classes according to the CORINE methodology: Very gentle to flat (1), Gentle (2), Steep (3), and Very steep (4).
In this study, a land cover map was generated using a Supervised Classification method of ERDAS Imagine 8.3 based on LANDSAT TM imagery acquired in August 2009. In classification process, the parallelepiped non-parametric and minimum distance parametric rule was used, and the image was classified into available land cover types in the study area. The accuracy of the classification was evaluated based on stratified random sampling method where 256 points were automatically selected from referenced topographic map and air photos. Finally, the classified land cover image was recoded into two classes: Fully protected (1) and Not fully protected (2) as suggested by the CORINE methodology.
After computing four main parameters including soil erodibility, erosivity, topography (slope), and land cover, potential soil erosion risk of the study area was determined by multiplying soil erodibility, erosivity, and slope indices and then mapping in ArcGIS 9.2 software. The potential soil erosion risk was classified into four classes: No erosion (1), Low (2), Moderate (3), and High (4). Then, the land cover factor was integrated with the potential soil erosion risk to find actual soil erosion risk. Finally, actual soil erosion risk map was generated and classified into three classes: Low (1), Moderate (2), and High (3).
RESULTS AND DISCUSSION In this study, the potential and actual soil erosion risks were evaluated with a case study in a dam watershed using CORINE methodology based on four parameters including soil erodibility, erosivity, topography (slope), and land cover. Soil erodibility factor was determined as a function of soil texture, stoniness, and depth.
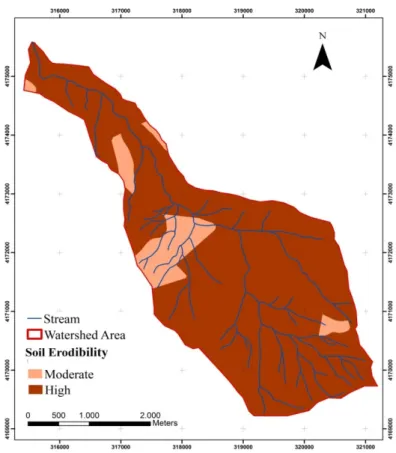
Figure 4. The soil erodibility map of the study area. As a result of texture analysis of the soil
samples obtained from the study area, it was estimated that 72.86% of the total area was covered with sandy loam and loam (highly erodible), while 26.89% of the total area was covered with clay loam (moderately erodible). The rest of the area (0.25%) was covered with bare rocks.
Evaluating percentage surface cover of stones in the study area, it was estimated that 34.73% of the total area possesses more than 10% stoniness, while the rest has less than 10% stoniness. The soil map was used to generate soil depth data of the study area, which indicated that soil depth was less than 25 cm (highly erodible) in 74.62% of the study area while it was 25 to 75 cm (moderately erodible) in 25.38% of the study area. Therefore, it can be concluded that large proportion of the study area was subject to high erosion risk due to shallow soil (< 25 cm depth). Besides, the shallow soil has low water-holding capacity, which
leads to acceleration of runoff and loss of the organic matter and plant nutrition (Lal and Pierce, 1993).
Based on soil texture, stoniness, and depth parameters, erodibility factor was moderate (3-6) in 9.5% (126.81 ha) of the total area while it was classified as high (> 6) in 90.5% (1207.98 ha) of the area. Thus, the soil in most parts of the study area was subject to erosion risk considering soil erodibility factor (Figure 4).
The Fournier Index (MFI) and Bagnouls-Gaussen aridity Index (BGI) values were used to determine erosivity index. The MFI of the study area was calculated as 136, which was classified as high (4) according to the CORINE methodology. The BGI was not considered in this study because BGI value computed for the study area could not meet the required condition (i.e. 2ti-Pi> 0) in Equation (2). The results indicated that erosivity index was moderate (4) for the study area.
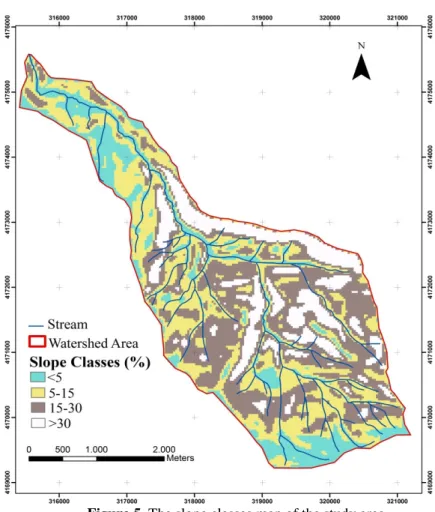
Figure 5. The slope classes map of the study area.
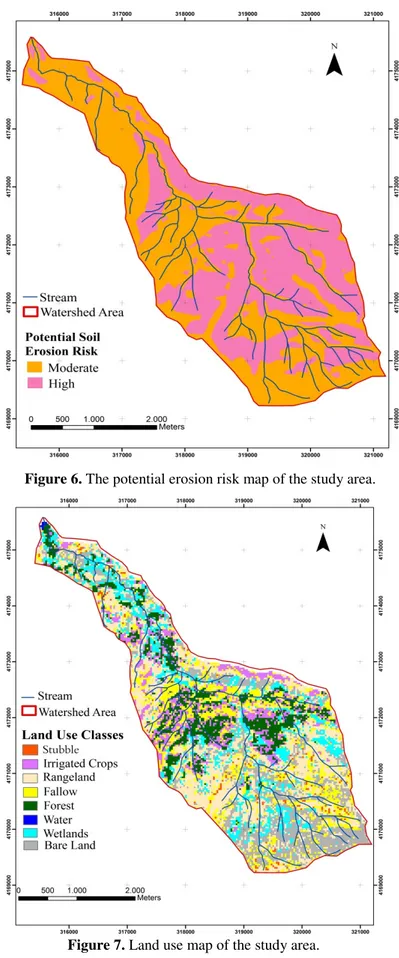
The topographic factors, especially ground slope, are important in terms of estimating erosion. The steep ground slope potentially accelerates the surface runoff, which dramatically increases erosion (Lal, 1994). The results indicated that the average slope in Goz Watershed was 38%. It was estimated that about 50.42% of the watershed was classified as steep and very steep areas, while the rest was on gentle slope (29.52%) and flat (20.06%) (Figure 5). The potential soil erosion risk of the study area was determined and then mapped (Figure 6). The potential erosion risk map indicated that the study area had 54.52% moderate and 45.48% high erosion risk levels. The actual erosion risk map was generated by overlaying potential erosion risk map and land cover map (Figure 7). Reliability of land cover data is very important in soil erosion models (Oduro-Afriye, 1996). The accuracy assessment of
the classified image indicated that classification process provided overall accuracy of 85.71%. The land cover layer was reclassified into two vegetation indices including fully protected and not fully protected based on CORINE methodology.
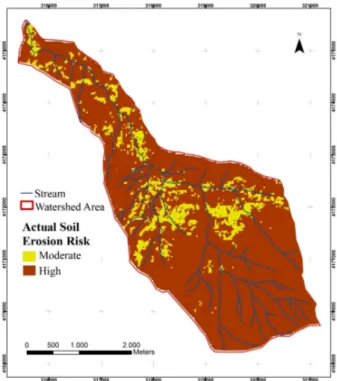
In the study area, forest was classified as fully protected (1), while the rest i.e. irrigated crops, stubble, fallow, wetlands, rangeland, and bare land were classified as not-fully protected (2). Land cover map indicated that the study area was 88.33% not-fully and 11.67 % was fully protected. Actual erosion risk map indicated that 11.97% of the study area had moderate risk, while 88.03% of the study area possesses high erosion risk (Figure 8).
Figure 6. The potential erosion risk map of the study area.
Figure 8. The actual erosion risk map of the study area.
Table 1. The area of the potential and actual soil erosion risk levels for the studied
watershed.
Erosion risk Potential erosion risk Actual soil erosion risk Area (ha) Percentage Area (ha) Percentage Moderate 728.8 54.52 159.9 11.97 High 607.8 45.48 1176.7 88.03 Total 1336.6 100.00 1336.6 100.00
CONCLUSIONS
The erosion risk maps were generated for Goz Watershed by using RS and GIS technologies considering the methodology implemented in CORINE. The results revealed that, according to the potential erosion risk map, more than half of the Goz Watershed was subject to moderate erosion risk, while about 88.03% of the study area was under high erosion risk based on the actual erosion risk maps. The main factors that resulted in high erosion risk in the study area included shallow soil depth and steep slope. Besides, most of the study area was
covered with sandy loam and loam which are highly erodible soils. On the other hand, only 11.67% of the area was covered by fully protected vegetation cover i.e. forest. Thus, suitable land use practices should be implemented to reduce erosion and avoid shortening the economic life of the dam. In addition, reforestation activities must be re-initiated right away by using broadleaved species. On the other hand, the herbaceous species should be also considered to protect soil in addition to reforestation studies. This study did not aim to estimate the amount of soil loss and sediment yield, but to provide erosion risk map for the analysis of land use planning and environmental protection.
Future studies can be combined with estimation of soil loss and sediment yield through field studies to evaluate and verify the numerical prediction models.
REFERENCES
1. Akay, A. E. and Sessions, J. 2005. Applying the Decision Support System, Tracer, to Forest Road Design. West J. Appl. For.,
20(3): 184-191.
2. Akay, A. E., Erdas, O., Reis, M. and Yuksel, A. 2008. Estimating Sediment Yield from a Forest Road Network by Using a Sediment Prediction Model and GIS Techniques.
Build. Environ., 43(5): 687-695.
3. Arnolds, H. M. 1980. An Approximation of the Rainfall Factor in the Universal Soil Loss Equation. In: “Assessment of Erosion”, (Eds.): De Boodt M., And Gabriels D.. John Wiley and Sons, Inc. Chichester, West Sussex, UK, PP. 127–132.
4. Aydin, A. and Tecimen, H. B. 2010. Temporal Soil Erosion Evaluation: A CORINE Methodology Application at Elmalı Dam Watershed, Istanbul. Environ.
Earth Sci., 61: 1457-1465.
5. Bayramin, D. O., Baksan, O. and Parlak, M. 2003. Soil Erosion Risk Assessment with ICONA Model; Case Study: Beypazarı Area. Turk. J. Agric. For., 23: 105-116. 6. Bayramin, I., Erpul, G. and Erdogan, H. E.
2006. Use of CORINE Methodology to Asses Soil Erosion Risk in the Semi-arid Area of Beypazarı, Turk. J. Agric. For., 30: 81-100.
7. Beasley, D. B., Huggings, L. F. and Monke, E. J. 1980. ANSWERS: A Model for Watershed Planning. Trans. ASAE, 23(4): 938-944.
8. CORINE. 1992. Soil Erosion Risk and Important Land Resources in the Southeastern Regions of the European Community. EUR 13233.
9. Dinc, U., Senol, S., Kapur, S., Atalay, I., Cangir, C. 2001. Turkey Soils. Cukurova University. Faculty of Agriculture. General Publication Number: 51, Adana, pp. 141-164.
10. Dogan, O. 1998. Sustainable Policies for
Soil Resource Management in Turkey. Research Institute-Ankara, GDRS, No: 212.
11. Elibuyuk, M. and Yilmaz, E. 2010. Altitude Steps and Slope Groups of Turkey in Comparison with Geographical Regions and Sub-regions. J. Geogr. Sci., 8: 27-55. 12. Evrendilek, F., Berberoglu, S., Gulbeyaz, O.
and Ertekin, C. 2007. Modeling Potential Distribution and Carbon Dynamics of Natural Terrestrial Ecosystems: A Case Study of Turkey. Sensor., 7: 2273-2296. 13. Flanagan, D. C. and Livingston, S. J. 1995.
Water Erosion Prediction Project (WEPP) Version 95.7: User summary. NSERL Report No. 11. West Lafayette, Ind.: USDA‐ARS National Soil Erosion Research Laboratory.
14. Fournier, F. 1960. Climat et Erosion. Presses Universitaires de France. 201 PP. 15. GDREC. 2008. General Directorate of
Reforestation and Erosion Control. Visited on January 8th, 2008, http://www.agm.gov.tr. 16. Kılıc, S., Evrendilek F., Berberoglu, S. and Demirkesen, A. C. 2006. Environmental Monitoring of Land-use and Land-cover Changes in a Mediterranean Region of Turkey. Environ. Monit. Assess., 114:157-168.
17. Lal, R. and Pierce, F. C. 1991. The Vanishing Resource. In Soil Management for Sustainability. Soil and Water Conservation Society, U. S. A., pp. 1-5. 18. Lal, R. 1994. Soil Erosion Research Method.
Second Edition, Soil and Water Conservation Society. Ankeny IA, 352s, USA.
19. Mitasova, H., Hofierka, J., Zlocha, M. and Iverson, R. L. 1996. Modeling Topographic Potential for Erosion and Deposition Using GIS. Intl. J. Geograph. Inform. Sci., 10(5): 629-641.
20. Oduro-Afriye, K. 1996. Rainfall Erosivity Map for Ghana. Geoderma.,6: 1125.
21. Pla, I. S. 1997. Soil Water Balance Model for Monitoring Soil Erosion Processes and Effects on Steep Lands in the Tropics. Soil
Technol., 11: 17-30.
22. Sadeghi, S. H. R. 2005. A Semi-detailed Technique for Soil Erosion Mapping Based on BLM and Satellite Image Applications. J.
Agri. Sci. Tech. (JAST), 7(3 and 4): 133-142.
23. Sadeghi, S. H. R. and Tavangar, Sh. 2015. Development of Stational Models for Estimation of Rainfall Erosivity Factor in Different Timescales. Natur. Hazard., 77: 429-443.
24. Sazbo, J., Pasztor, L., Suba, Z. and Varallyay, G. 1998. Integration of Remote Sensing and GIS Techniques in Land Degradation Mapping. Proceedings of the
16th International Congress of Soil Science,
August, Montpellier, France, PP. 63-75. 25. SSM. 1993. Soil Survey Manual. USDA
Handbook No: 18, US Government Printing Office, Washington, DC, USA, 437 PP. 26. Steel, R. G. D. and Torrie, J. H. 1980.
Principles and Procedures of Statistics. Second Edition, McGraw-Hill, New York. 27. Terranova, O., Antronico, L., Coscarelli, R.
and Laquinta, P. 2009. Soil Erosion Risk Scenarios in the Mediterranean Environment Using RUSLE and GIS: An Application Model for Calabria (Southern Italy). Geomorphol., 112: 228-245.
28. Vrieling, A., Sterk, G. and Beaulieu, N. 2002. Erosion Risk Mapping: A
Methodological Case Study in the Colombian Eastern Plains. J. Soil Water
Conserv., 57(3): 158-163.
29. Wischmeier, W. H. 1976. The Use and Misuse of the Universal Soil Loss Equation.
J. of Soil Water Conserv., 31(1): 5-9. 30. Yuksel, A., Akay, A. E. and Gundogan, R.
2008a. Using ASTER Imagery in Land Use/Cover Classification of Eastern Mediterranean Landscapes According to CORINE Land Cover Project. Sensor., 8: 1237-1251.
31. Yuksel, A., Gundogan, R. and Akay, E. A. 2008b. Using the Remote Sensing and GIS Technology for Erosion Risk Mapping of Kartalkaya Dam Watershed in Kahramanmaras, Turkey. Sensor., 8: 4851-4865. شور زا هدﺎﻔﺘﺳا ﺎﺑ ﺶﻳﺎﺳﺮﻓ ﺮﻄﺧ ﻪﺸﻘﻧ ﻪﻴﻬﺗ CORINE ﺰﮔ ﺰﻳﺮﺑآ ﻪﺿﻮﺣ ياﺮﺑ رد ﻪﻘﻄﻨﻣ ﻪﻴﻛﺮﺗ سارﺎﻤﻧﺎﻣﺮﻬﻛ و ،يﺎﻛآ .ي .ا ،ﺲﻴﺋر .م ﻲﺴﻳوﺎﺳ .گ هﺪﻴﻜﭼ ﻪﻤﻴﻧ و ﻚﺸﺧ ﻖﻃﺎﻨﻣ رد بآو كﺎﺧ ﻊﺑﺎﻨﻣ يور يﺪﺟ ﻲﺘﺴﻳﺰﻄﻴﺤﻣ تاﺮﺛا ﺪﻧاﻮﺗ ﻲﻣ كﺎﺧ ﺶﻳﺎﺳﺮﻓ د هﮋﻳو ﻪﺑ بﻮﺳر ﺪﻴﻟﻮﺗ نآ ﻪﻧﻮﻤﻧ ﻪﻛ ﺪﺷﺎﺑ ﻪﺘﺷاد ﻚﺸﺧ ﺮﻳﺬﭘ ﺶﻳﺎﺳﺮﻓ يﺎﻫ كﺎﺧ و راﺪﺒﻴﺷ ﻖﻃﺎﻨﻣ ر ماود يور ﻪﺠﻴﺘﻧ رد و ﺪﺳ ﺰﻳﺮﺑآ ﻪﺿﻮﺣ يور يدﺎﺼﺘﻗا تاﺮﺛا ﺶﻳﺎﺳﺮﻓ زا ﻲﺷﺎﻧ هﺪﺷ ﺪﻴﻟﻮﺗ بﻮﺳر .ﺖﺳا ﻴﻛﺮﺗ يﺎﻫ يراﺬﮔ ﻪﻳﺎﻣﺮﺳ ﻦﻳﺮﺘﻤﻬﻣ زا ﻲﻳﺎﻨﺑ ﺮﻳز يﺎﻫ هزﺎﺳ ﻦﻳا ﻪﻛ ﻲﻟﺎﺣ رد دراد ﺎﻫ ﺪﺳ يدﺎﺼﺘﻗا ﻪﺑ ﻪ زا يﺮﻴﮔﻮﻠﺟ ياﺮﺑ مزﻻ تﺎﻧﺎﻜﻣا ندﺮﻛ ﻢﻫاﺮﻓ رﻮﻈﻨﻣ ﻪﺑ ﻪﻛ ﺖﺳا ﻢﻬﻣ رﺎﻴﺴﺑ،راﺮﻗ ﻦﻳا زا .ﺪﻧور ﻲﻣ رﺎﻤﺷ ﻪﺸﻘﻧ ﻪﻴﻬﺗ ﺮﺿﺎﺣ ﺶﻫوﮋﭘ فﺪﻫ .دﺮﻛ ﻲﻳﺎﺳﺎﻨﺷ ﺪﻧراد راﺮﻗ ﺮﻄﺧ ﻦﻳا ضﺮﻌﻣ رد ﻪﻛ ار ﻲﻘﻃﺎﻨﻣ ،ﺶﻳﺎﺳﺮﻓ )ﺖﻟﺰﻨﻣ ﺪﺳ ﺖﺳدﻻﺎﺑ رد ُﺰﮔ ﺰﻴﺨﺑآ ﻪﺿﻮﺣ ياﺮﺑ ﺶﻳﺎﺳﺮﻓﺮﻄﺧ Menzelet ﺪﻣ ﺮﻬﺷ قﺮﺷ رد ( يا ﻪﻧاﺮﺘﻳ ) ﻲﻳﺎﻴﻓاﺮﻐﺟ تﺎﻋﻼﻃا ﻪﻧﺎﻣﺎﺳ و ﻲﺠﻨﺳ رود زا هدﺎﻔﺘﺳا رﺎﻛ شور .دﻮﺑ ﻪﻴﻛﺮﺗ رد سارﺎﻤﻧﺎﻣﺮﻬﻛ GIS ﺮﺑ ( شور يﺎﻨﺒﻣ CORINE ،ﺶﻳﺎﺳﺮﻓ ﺮﻄﺧ ﻞﻴﺴﻧﺎﺘﭘ ﻪﺸﻘﻧ يﺎﻨﺒﻣ ﺮﺑ ﻪﻛ داد نﺎﺸﻧ ﺞﻳﺎﺘﻧ .دﻮﺑ 52 / 54 ﺖﺣﺎﺴﻣ % و ﻂﺳﻮﺘﻣ ﺶﻳﺎﺳﺮﻓ ﺮﻄﺧ رد ُﺰﮔ ﻪﺿﻮﺣ 48 / 45 ﻣا .دﻮﺑ دﺎﻳز ﺶﻳﺎﺳﺮﻓ ﺮﻄﺧرد ﻪﻘﻄﻨﻣ % يﺎﻫ ﻪﺸﻘﻧ يﺎﻨﺒﻣ ﺮﺑ ،ﺎ ﺐﻴﺗﺮﺗ ﻪﺑ ﺰﻳﺮﺑآ ﻪﺿﻮﺣ رد دﺎﻳز و ﻂﺳﻮﺘﻣ ﺶﻳﺎﺳﺮﻓ ﺮﻄﺧ ﺎﺑ ﻖﻃﺎﻨﻣ ﺖﺣﺎﺴﻣ ،ﺶﻳﺎﺳﺮﻓ ﺮﻄﺧ ﻲﻌﻗاو 97 / 11 % و 03 / 88 ﺐﻴﺷ ﻞﻣﺎﺷ رﻮﺑﺰﻣ ﻪﺿﻮﺣ رد ﺶﻳﺎﺳﺮﻓ ﺮﻄﺧ دﺎﺠﻳا ﻞﻣاﻮﻋ ﻦﻳﺮﺘﻤﻬﻣ ﻪﻛ ﺪﺷ مﻮﻠﻌﻣ ﻦﻴﻨﭽﻤﻫ .دﻮﺑ %
ﻦﻴﮕﻧﺎﻴﻣ) ﺪﻨﺗ 38 ﻂﻘﻓ ) ﻲﻫﺎﻴﮔ ﺶﺷﻮﭘ دﻮﺒﻧ ﺎﻳ دﻮﺒﻤﻛ و (% 67 / 11 ﺶﺷﻮﭘ % ،ﻦﻳا ﺮﺑ نوﺰﻓا .دﻮﺑ (ﻲﻠﮕﻨﺟ شور ﺎﺑ ﺶﻳﺎﺳﺮﻓ ﺮﻄﺧ ﻲﻌﻗاو و ﻞﻴﺴﻧﺎﺘﭘ يﺎﻫ ﻪﺸﻘﻧ ﻪﻴﻬﺗ ﻪﻛ دﻮﺑ نآ زا ﻲﻛﺎﺣ ﺞﻳﺎﺘﻧ CORINE ﻼﻣﺎﻛ .ﺖﺳا ﻪﻓﺮﺻ ﻪﺑ نوﺮﻘﻣ و ﺪﻣآ رﺎﻛ و ﺮﺛﻮﻣ