Evolving Market Efficiency in Istanbul Stock Exchange
Müslümov, A., G. Aras and B. Kurtulus (2002) "Evolving Market Efficiency in Istanbul Stock Exchange", METU International Conference in
Economics VI, Ankara, TURKEY.
Alovsat Muslumov
Types of the Efficiency of Financial Markets
Operational Efficiency: Transactions are carried out cheaply. Satisfied when financial intermediaries are competitive enough.
Allocational Efficiency: Prices of securities are adjusted according to their risks, i.e.
securities with the same level of risk will offer the same expected return.
Informational Efficiency: The prices fully reflect all the information available and relevant to security valuation.
An Informationally Efficient Capital Markets
The Capital market is efficient if
that is , the information market uses to determine security prices at t-1, includes all information available.
And
that is, the market understands the implications of the available information for the
joint distribution of returns.
Summary: Market efficiency means that the market is aware of all available information and uses it correctly
1 1
t m t
m t 1
1t,
,
nt tm1
1t,
,
nt t1
mp
p
f
p
p
f
Three Levels of Informational Efficiency
Weak Form Efficiency: Security prices fully reflect the informaion contained in past price movements. It is not possible to trade profitably purely on the basis of historical
price information.
Semistrong Form Efficiency: Security prices fully reflect all publicly available
information. It is not possible to trade profitably on the basis of information from
publicly available sources.
Strong Form Efficiency: The prices fully reflect all relevant information whether it is publicly avilable or not. It is not possible to trade profitably on the basis of inside
knowledge or any other sources of the information.
Note: Strong form efficient markets are efficient in smeistrong form, and the market which is semistrong form efficient is efficient is weak form efficient but not vice versa.
Weak Form Market Efficiency and Infant Markets
No profit opportunities exist on the past movement in asset prices. That is prices follow random walk.
that is
However, two factors should be considered.
‒ Infant Markets may initially lack weak-form efficiency (time-varying coefficients or division of time period into two parts)
‒ Changing variance structure may result in spurious serial correlation property and market efficiency may falsely rejected.
p i i i t i tr
e
r
1 0
i
0
,
i
0
Previous Studies
There is evidence that Istanbul Stock Exchange lacks even weak-form efficiency. (Muradoğlu and Ünal, 1994; Balaban and Kunter, 1997; Okay, 1998).
This study differs from previous studies in the empirical literature
‒ in its research method (GARCH-M together with ARIMA to consider changing
variance structure);
‒ its broadest cross-sectional coverage (it tests ISE-100 index along with all stocks constituting ISE-100 index);
‒ its widest time period coverage (1986-2001 period);
‒ its attempt to capture evolution process of the informational efficiency of Istanbul Stock Exchange.
Sample and Data
ISE-100 index weekly stock price data and return series cover 13/06/1991 – 29/11/2001 time period.
Individual stocks return series include monthly data of all stocks that constitute
ISE-100 index. Covered time period is 1986-2001.
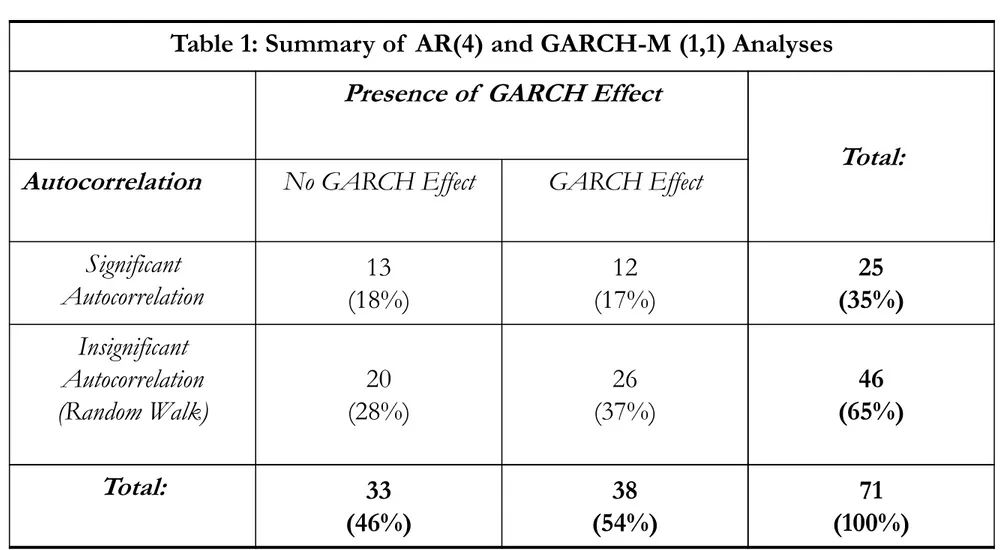
Due to case number restriction of ARIMA and GARCH models, we analyze stocks with at least 50 monthly observations. This restriction has reduced total sample size to 71 stocks.
Research Methodology
t t t t t t r r r r er 01 12 23 31 4 AR(4) – Fourth Order
Autoregressive Model t t t t t r r h e
r
0
1 1
2 2
AR(2) Standart GARCH-M(Generalized Autoregressive Conditional Heteroscedastic in Mean) Model
t
t h e ~ 0, 1 2 1 1 0 t t t h e h
Findings of market efficiency tests for individual stocks
Table 1: Summary of AR(4) and GARCH-M (1,1) Analyses
Presence of GARCH Effect
Total: Autocorrelation No GARCH Effect GARCH Effect
Significant Autocorrelation (18%) 13 (17%) 12 (35%) 25 Insignificant Autocorrelation (Random Walk) 20 (28%) 26 (37%) 46 (65%) Total: 33 (46%) 38 (54%) 71 (100%)
Market efficiency tests for ISE 100 Index
AR(2) Standart GARCH-M (1,1) Model
13 June 1991 – 29 November 2001 Period Weekly Data (Full Period)
AR(2) Standart GARCH-M (1,1) Model Results N=523
rt = 0.012 + 0.191 rt-1 + 0.012rt-2 - 0.005ht (0.67) (2.68)*** (0.2) (-0.01) ht = 0.000 + 0.62 ht-1 + 0.23et-1
(1.6) (4.48)*** (3.01)***
13 June 1991 - 08 August 1996 Period Weekly Data (First Period)
AR(2) Standart GARCH-M (1,1) Model Results N=261 rt = 0.014 + 0.095 rt-1 + 0.033 rt-2 - 0.039ht (0.99) (2.06)** (0.75) (-0.19) ht = 0.000 + 0.725 ht-1 + 0.187et-1 (2.69)***(13.77)*** (5.33)*** rt = 0.008 + 0.003 rt-1 + 0.07rt-2 + 0.043ht (0.24) (0.05) (1.00) (0.1) ht = 0.001 + 0.666 ht-1 + 0.147et-1 (1.59) (4.35)*** (2.53)**
15 August 1996 – 29 November 2001 Period Weekly Data (Second Period)
AR(2) Standart GARCH-M (1,1) Model Results N=262
Market efficiency tests for ISE 100 Index
AR(1) Standart GARCH-M (1,1) Model
13 June 1991 – 29 November 2001 Period Weekly Data (Full Period)
AR(1) Standart GARCH-M (1,1) Model Results N=523
13 June 1991 - 08 August 1996 Period Weekly Data (First Period)
AR(1) Standart GARCH-M (1,1) Model Results N=261
15 August 1996 – 29 November 2001 Period Weekly Data (Second Period)
AR(1) Standart GARCH-M (1,1) Model Results N=262 rt = 0.100 rt-1 + 0.153ht (2.19)** (3.23)*** ht = 0.000 + 0.716 ht-1 + 0.188et-1 (2.67)*** (12.82)*** (5.25)*** rt = 0.184 rt-1 + 0.178ht (2.68)*** (2.17)** ht = 0.000 + 0.62 ht-1 + 0.23et-1 (1.68)* (4.9)*** (3.18)*** rt = 0.009 rt-1 + 0.144ht (0.13) (2.32)** ht = 0.001 + 0.65 ht-1 + 0.16et-1 (1.61) (4.16)*** (2.68)**
Market efficiency tests for ISE 100 Index
MA(1) Standart GARCH-M (1,1) Model
13 June 1991 – 29 November 2001 Period Weekly Data (Full Period)
MA(1) Standart GARCH-M (1,1) Model Results N=523
13 June 1991 - 08 August 1996 Period Weekly Data (First Period)
MA(1) Standart GARCH-M (1,1) Model Results N=261
15 August 1996 – 29 November 2001 Period Weekly Data (Second Period)
MA(1) Standart GARCH-M (1,1) Model Results N=262 rt = 0.092 et-1 + 0.154ht (1.95)* (3.31)*** ht = 0.000 + 0.715 ht-1 + 0.189et-1 (2.67) (12.79)*** (5.27)*** rt = 0.169 et-1 + 0.178ht (2.48)** (2.29)** ht = 0.000 + 0.62 ht-1 + 0.23et-1 (1.69)* (4.75)*** (3.15)*** rt = 0.007 et-1 + 0.141ht (0.11) (2.28)** ht = 0.001 + 0.65 ht-1 + 0.16et-1 (1.62) (4.28)*** (2.72)***
The Analysis of the Determinants of Random-Walk
Behavior of Stock Returns
Discriminant analysis is conducted to determine which types of the stocks are more likely to show random-walk behavior.
Dicriminating Variables:
‒ The relative size of the market capitalization of individual stocks ( MC) (computed as the the average weight of constituent companies in the ISE National-100 Index in December 2001)
‒ The relative size of the liquidity of individual stocks (LIQ) (computed as the the ratio of the liquidity of individual stocks to the total liquidity of the Istanbul Stock Exchange in December 2001)
‒ Value turnover ratio (VT) (computed as t: traded value / daily average market
capitalization calculated according to stock kept in custody at Takasbank in December 2001)
‒ The price to book ratio of individual stocks (MVBV) (computed using data in December 2001)
Dependent Variable
‒ Random-walk behavior of stock returns
0 = Stock returns show non-random walk behvior
The Analysis of the Determinants of Random-Walk
Behavior of Stock Returns
The results of discriminant analysis shows that discriminant function is not statistically significant.
From these results we may also conclude that random-walk behavior of individual stock returns is not discriminated by research variables.
Table 4: Results of the Discriminant Analysis
N MC LIQ VT MVBV
Non-Random Walk 17 1.95 1.46 10.50 5.22
Random Walk 42 1.00 1.09 10.62 4.92
Total : 59 1.27 1.20 .10.59 5.01
Tests of Equality of Group Means
Wilk’s Lambda (F-statistics are on parentheses) 0.97 (2.05) 0.99 (0.47) 1.00 (0.01) 1.00 (0.01)