ISSN: 1583-3410 (print), ISSN: 1584-5397 (electronic)
COMPARISON OF EXPECTATIONS AND PERCEPTIONS OF RESIDENT EUROPEAN UNION (EU) CITIZENS ABOUT HOSPITAL SERVICE
QUALITY IN THEIR HOME COUNTRIES AND TURKEY Yavuz YILDIRIM, Sahin KAVUNCUBASI
Revista de cercetare și intervenție socială, 2020, vol. 71, pp. 285-304
https://doi.org/10.33788/rcis.71.18
Published by:
Expert Projects Publishing House
On behalf of:
„Alexandru Ioan Cuza” University, Department of Sociology and Social Work
and
HoltIS Association
REVISTA DE CERCETARE SI INTERVENTIE SOCIALA
is indexed by Clarivate Analytics (Social Sciences Citation Index), SCOPUS and CROSSREF
expert projects
Comparison of Expectations and Perceptions
of Resident European Union (EU) Citizens
About Hospital Service Quality In Their Home
Countries and Turkey
Yavuz YILDIRIM
1, Sahin KAVUNCUBASI
2Abstract
The aim of this research is to reveal the assessment of EU (European Union) citizens residing in Alanya regarding the quality of hospital services in both their own countries and Alanya. The study was carried out face-to-face with a survey method with 295 resident EU (European Union) citizens between June and August 2018 in Alanya. The analysis was done with the SPSS 22.0 package program. 229 (76.60%) of the participants are women and 66 (22.40%) are men, 159 (54%) are German citizens and 30 (10.22%) are British citizens. Expectations of EU citizens regarding hospital service quality are empathy, reliability and assurance, particularly physical assets and accountability. It was found that quality expectations of EU citizens were met in terms of accountability and reliability, whereas expectations related to other dimensions were not satisfi ed. The overall perception levels of EU citizens regarding hospitals in their own countries are higher than the overall levels of perception of hospitals in Alanya. For this, Hospital managers in Alanya need to pay particular attention to assurance, physical assets and empathy dimensions for better quality health service delivery.
Keywords: resident foreigners, Servqual, health service quality, Alanya,
satisfaction, dependability.
1 Graduate School of Soc al Sc ences, Near East Un vers ty, N cos a, Northern Cyprus TR-10 Mers n, TURKEY E-ma l: yavsut@gma l.com
2 Faculty of Health Sc ences, Başkent Un vers ty, 06790 Et mesgut, Ankara, TURKEY. E-ma l: kavuncubas @gma l.com
Introduction
Service quality is rising step by step in numerous markets and industries, and it has gotten a noteworthy subject in various literature writing. These quality traits in healthcare, for example, elusiveness, multifaceted nature, connection and perishability render it all the more diffi cult to characterize and measure service quality rather than product quality (Parasuraman, Zheitmal, & Berry, 1985; Zeithaml, Bitner, & Gremler, 2006).
Various writing proposes that customer perception and exception is all the more much of the time encountered in examinations of service quality research (Díaz‐Martín et al., 2000; Ojasalo, 2001; Robledo, 2001; Dean, 2004; Ali, Dey, & Filieri, 2015; Oghuma et al., 2016). The organization will protect that client needs will be satisfi ed by the norm of the consideration rendered, a service that has so far demonstrated diifi cult to handle (Yelkur & Chakrabarty, 2006; Renedo
et al., 2015).
Main purpose of the health systems is to improve the health and well being of the population (including migrants and resident foreigners) health by assuring fi nancial risk protection and responsiveness (World Health Organization, 2000). The purpose of this study, applied SERVQUAL methodology, is to determine the satisfaction level of resident foreigners (immigrants) population who left their own European Union (EU) member country to live in Alanya ,Turkey, and to compare the expectations levels of immigrants in their own EU countries and in Turkey. This comparative study is expected to give impetus the quality improvement movements in Turkey. International comparisons of patient expectations and perceptions create opportunities to determine potential problem areas and to formulate national strategies and policies and programs addressing these problems. This study also will help EU citizens to make an informed decision for migration to Turkey. The models that conceptualizing service quality were fi rstly emerged in the 1980s by the works of Portugal et al. (2007), called as Nordic perspective and the Parasuraman, Zeithaml, & Berry (1988) and Fiala (2012) called as American perspective. Nordic Model assumes that the concept of quality has two dimensions, namely technical quality and functional quality. While technical quality defi nes what consumers receive as an outcome of the interactions with the service provider, functional quality focuses on how consumers receive the services. Technical quality can be considered to be much like the service equivalent of a quality specifi cation for a manufactured item. In health services, for example, the return of function, absence of mortality, morbidity, or lack of perioperative complications would be considered generic examples of technical quality criteria (Hossain, 2014).
Parasuraman, Zeithaml, & Berry (1988) and Fiala (2012) developed a servqual model to assess service quality based on the discrepancy between patient expectations and their perceptions regarding to health services provided to them. SERVQUAL scale has become the most widely used instrument in the quality
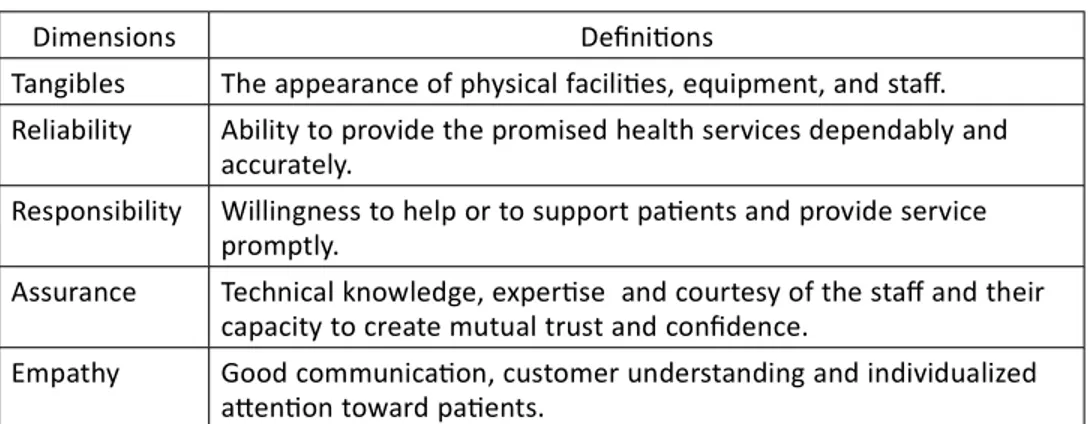
measurement studies around the World and in Turkey (Isik, Tengilimoglu, & Akbolat, 2011; Devebakan & Aksarayli, 2003; Zeithaml, Bitner, & Gremler, 2018). Servqual scale consists of fi ve components that describe the dimensions of service quality. Dimensions of Servqual scale are summarized in Table 1 (Parasuraman, Berry, & Zeithaml, 1990).
Table 1. Dimensions of Servqual Scale
Servqual scale enables healthcare managers to determine the direction and the severity of the quality defi cits or “gaps” as causes of service delivery failures occurred in the entire service provision process. Zeithaml, Bitner, & Gremler (2018) grouped quality gaps in two main categories: (1) Customer (patient) gap and (2) Provider gaps. The patient gap concerns the diff erence between patients’ service expectations and perceptions. Service expectations are developed by past experiences, personal needs and Word of mouth communications (Kiliç, 2016).Oh the other hand, provider gaps occur within the health care organization providing the service. Provider gaps, briefl y explained in Table 2, are possibly under the control of the health care managers (Parasuraman, Berry, & Zeithaml, 1990).
Table 2. Types of Provider Gaps
Dimensions Defi ni ons
Tangibles The appearance of physical facili es, equipment, and staff . Reliability Ability to provide the promised health services dependably and
accurately.
Responsibility Willingness to help or to support pa ents and provide service promptly.
Assurance Technical knowledge, exper se and courtesy of the staff and their capacity to create mutual trust and confi dence.
Empathy Good communica on, customer understanding and individualized a en on toward pa ents.
Types of Provider Gaps Defi ni on
Gap 1: The listening gap The diff erence between pa ent expecta ons of service and provider understanding of these expecta ons. Gap 2: The service design
and standards gap
The diff erence between provider understanding of pa ent expecta ons and the development of pa ent focused service designs and standards
Gap 3: The service performance gap
the diff erence between the development of pa ent-focused service standards and actual service performance by staff providing health services Gap 4: The
communica on gap
The diff erence between service delivery and the service provider’s external communica ons
Literature review
Expectation of Service QualityThe evaluation of service quality eff ectiveness is impacted drastically by Clients expectation recommend that buyer inclinations might be portrayed as decisions on administration conveyance that fi ll in as measures to decide service quality (Brown & Swartz, 1989; Tam, 2005; Zeithaml, Bitner, & Gremler, 2018). At the point when clients based their encounters to expectation while assessing the degree of administration and utilities for this reason institution need to think about the client’s norms or expectation and control them (Zeithaml, Bitner, & Gremler, 2018)
The degree of service quality relies upon the mastery and abilities expected to dominate clients expectations (Taam, 2005). Zeithaml et al. (1990) recommend that the absence of understanding about clients inclinations or expectation is one of the key wellsprings of low service quality (Palmer, 2001) In this way, knowing client inclinations is a basic move in accomplishing great productivity. There is little attention to what organizations would foresee to add to the loss of clients; contributing capital, vitality, and diff erent assets wastefully and and likely proceeded with organization disappointment in a turbulent market (Zeithaml, Bitner, & Gremler, 2018). At the point quality is identifi ed with how an organization fulfi lls the desires for clients, it is imperative to characterize such desires. Most conceptualizations of service quality begin from hypothetical clients recognitions. The inclinations of clients are, as a general rule key in any institution (Palmer, 2001). The utilization of the expectation of clients as models for assessing nature of service quality, and these observations impact their comprehension of actuality (Choi & Mattila, 2008; Tam, 2005). Showing principles of expectation and customer fulfi llment has been centered around diff erent signifi cances. How the Service of an organization is rendered to a Clients will convey the expectation (Fiala, 2012). Teas (1993) noticed that client satisfaction is the positive result of the service meeting the client expectation. Tam (2005) states that predictive and normative are the two most dominating types of client expectation. Predictive expecation principles are organized to anticipate a client degree of service quality that a specialist co-op can convey. The basis for satisfaction is measurable desires (Churchill & Surprenant, 1982). Normative expectation are utilized to quantify service quality (Zeithaml, Berry, & Parasuraman, 1993; Dash, Bruning, & Acharya, 2009). The disparity among expected and foreseen nature of activity is conceptualized (Dash, Bruning, & Acharya, 2009). The estimation of profi ciency as a method of accomplishing competitive edge is centered around our customers’ expecctation of service quality (Palmer, 2001).Boulding et al.(1993) asserted that clients expectation on service quality were aff ected by suppositions. On account of its inclination, Anderson and Sullivan (1993) presume that expectation have a noteworthy infl uence on clients appraisal towards service quality profi ciency. Thus, Olshavsky and Miller (1972)
demonstrate that client perspectives of service quality could be as the same as expectaion in situation of explicit products or complicated services.
The impression of patients are centered around past communications of current patients; expectation of potential clients depend on the mindfulness or assessments of client experience, for example, interpersonal communication with groups (Svarin & Olsen, 2012).The objective was portrayed as the “apparent capacity of elective providers and items in a specifi c buy choice to accomplish an assortment of obvious and inferred points” (Svarin & Olsen, 2012).Be that as it may, Lin (2009) states that expectation is the initial phase in the dynamic stage of decison making before client dependability and satisfaction on service is achieved. Parasuraman, Zeithaml, & Berry (1988) and Fiala (2012) recommend that while looking into the SERVQUAL model, customers evaluate service quality by standing out their recognitions from the degree of administration they experience. In medical context, the technical and functional components of service quality are arranged as a norm of activity. While Mosadeghrad (2013)recommends three classifi cations: innovative (care adequacy), settings (comfort level) and relational (tolerant requirements and inclinations). Kucukarslan and Schommer (2002)likewise investigate the forms of exppectation, including business setting, verifi able information and the characters of the providers. It is intriguing that this last perspectives are an indispensable segment of the impression of patients.
Perception of Service Quality
Despite the fact that of institution that off er equivalent types of service, there is clearly a variety in their comprehension of service experience (Liat et al., 2017). The perception, actions of the organization and the states of innovation infl uence service quality and their presentation. Client experience frequently proposes whether customers are satisfi ed or disappointed with service (Czepiel et
al., 1985). In past research, consumers’ perceptions of service quality are generally
defi ned in terms of “consumers’ judgments and impressions of an overall entity’s excellence or superiority” (Dagger, Sweeney, & Johnson, 2007: 124). Narang (2010) states that the quality of service is diff erent from that of various actors such as government, physicians , and patients. It states that the quality evaluation of health services, providers of services and government opinions is a priority in conventional approaches. Nevertheless, the research argues that in recent times the perceptions of patients have been increased. Schneider & White (2004) 43 argue that the perception of people is a key factor to evaluate the quality of service. Customer consistency is a central factor of single company consumer assessment (Zeithaml et al., 1990). The 2 key quality components are technical and functional (Gronroos, 1984). Technical quality refers to quantifi able aspects of the service, and functionality is how customers are provided with technical quality. Gronroos (1984) says it is diffi cult to calculate consistency yet to evaluate
technological effi ciency. Unlike Gronroos (2000), quality is perceived as one-dimensional building, rust and quality quality.
In relation to two features-service performance and services environments, Rust & Oliver (1994) determines the quality of service encounter. Zeithaml, Bitner, & Gremler (2018) also assume that quality is not achieved by customers in an individualized manner. Service quality considerations are found by customers to be critical by Parasuraman Zeithaml, & Berry (1988); all other aspects of this law are not applicable. They claim that when the company meets customer standards and service effi ciency, it is of high standard. In previous research Parasuraman, Zeithaml, & Berry (1988), the diff erence between objective quality and perceived quality was highlighted). Consumers and researchers do not likewise understand the term quality according to Holbrooke and Corman (1985) Quality was determined conceptually by the researchers. The conceptual meaning diff erentiates between the various qualities that are human and mechanical. Human quality is a personal response to something that diff ers between people. The objective response to an entity or an occurrence is mechanical consistency (Holbrooke & Corman, 1985). Nonetheless, Parasuraman, Zeithaml, & Berry (1988) say that the service quality defi nition is an comprehensive and situation-like measurement (previously believed by this study).
Health Care Service Quality
Service quality is the interaction with providers and the extent to which the service satisfi es their needs (Duff y & Ketchand, 1998; Parasuraman, Zeithaml, & Berry, 1988). A good health care is the continuous assistance of the patient by delivering appropriate and effi cient healthcare in accordance with the current therapeutic guidance and guidelines that match the patient’s needs and satisfy caregivers.’ In order to decide what is quality of service and aff ect expectations of service, customer viewpoints are becoming increasingly essential Customer consistency is a central factor of single company consumer assessment (Zeithaml, Bitner, & Gremler, 2018). As previously mentioned, the two main quality components are technical and functional44. Technical quality refers to quantifi able
aspects of the service, and functionality is how customers are provided with technical quality. Gronroos (1984)says it is diffi cult to calculate consistency yet to evaluate technological effi ciency.Rust and Oliver (1994)defi ne service quality in terms of two features – service performance and service environment – as opposed to Gronroos (1994) perception that quality of service is one dimension structure. Zeithaml, Bitner, & Gremler, (2018)also assume that quality is not achieved by customers in an individualized manner. Quality of service considerations are found by customers to be critical by Parasuraman, Zeithaml, & Berry (1988), all other aspects of this law are not applicable. They claim that when the company meets customer standards and service effi ciency, it is of high standard.
Donabedian (1988: 1745)says that health quality is “applied in a way that improves health gain without raising risk in return to medical science and technology”. Ovretveit (1992) considered the quality of service to be the delivery of treatment which goes beyond patient expectations and achieves the highest possible clinical results utilizing resources available. The quality of service measurement diff ers greatly from the most complex physical products. Measuring service quality has nevertheless become a condition of the market and branding as well as customer loyalty in this age of global contest. Global research volumes in several sectors address research on service quality indicators and on the development of meaningful service quality statistical structures (Al-Damen, 2017; Fatima, Malik, & Shabbir, 2018).The paper addresses the literature on models of service quality in general and on medical quality, in particular the factors which diff erent researchers consider modeling service quality and measurability technology. The scope of the experimental facilities in this literary review is measured by the SERVQUL model. Service quality. The following way is organized. First, since 1985, the early literature has been revised for the diff erent service sectors, with a view to evaluating service characteristics and benefi ts based on SERVQUAL models.
To assess the trust and satisfaction of 350 patients in Jordan’s public and private hospitals, Alrubaiee & Alkaa’ida (2011) have been using SERVQUAL to assess fi ve dimensional factors (tangibility, empathy, response, awareness and reliability). Their conceptual model suggests that the trust and satisfaction of patients depends on the quality of services provided by the hospital. Whereas Naidu (2009)has concluded that the measurement structure is multidimensional and based on experience from the health sector in developed countries the patient’s perception and an expert assessment of every fi nal result has to be considered. Shabbir, Malik, & Janjua (2017) has found a positive relationship between customer satisfaction and the health care services of private sector hospitals in Egypt in four models, the SERVQUAL model, and the weighted SErespref model and the SERVPEFER weighting models, and it has also shown that customer satisfaction is signifi cantly benefi cial to the fi nancial performance of the hospital. Kavitha (2012) contrasted two hospitals in the Salem region of Tamil Nadu with a SERVQUAL model to decide if their expectations of service effi ciency and management competence is administrative and patient.
Expectancy Confi rmation Theory
The theory of confi rmation of expectations that presents a perception of customer satisfaction (Barsky, 1992).Oliver (1980) introduced the theory to study customer satisfaction, which results from the corresponding perceptions and expectations of customers. Confi rmation and desire also decide satisfaction. The ECT theory suggests that a fi ve-stage cycle is the product of the degree of customer satisfaction. First, prior to purchase, consumers are initially expected to expect a particular product or service. Secondly, the products or services are accepted
and used. They shape expectations of their success on outstanding features after a time of initial consumption. Thirdly, they compare these perceptions with their previous levels of expectation and establish to what extent their expectations are confi rmed. Expectations may be confi dently ambiguous (perceived expectations are greater than expected), confi dent (perceived outcomes are better than expected), or doubtful (perceived success is less than expected). Third, depending on their degree of conviction, they build emotions of complacency and unhappiness. Confi rming, enhancing the enjoyment of positive reinforcement and reducing discomfort of negative affi rming should preserve a modest degree of happiness (Chou et al., 2013). Finally, satisfi ed clients intend to reuse the product or service in the future, while disappointed users later stop using it.
Methodology
SamplingThere are more than 12.625 foreign residents live in Alanya situated in Mediterranean coast of Turkey where leisure and entertainment infrastructure, as well as health care facilities such as family health clinics, hospitals, and rehabilitation centers, are available. The target population of this study is foreign residents moved from EU countries permanently. In 2017 there were 4.022 EU citizens in Alanya. Sample size is determined as 295 by using sample size calculation formula (1) where Z, p and d denote confi dence level, the proportion of the population that has certain characteristics and tolerable deviation level respectively. P-value was chosen as e 0,50 to maximize sample size, confi dence level and tolerable deviation (d) level were chosen as 95,5 % (Z=2), and 6 %. A convenience sampling method was used for collecting data. (1)
Survey Instrument and Data collection
Turkish version of Servqual questionnaire that validity and reliability analysis done by was used to measure respondents’ agreement on expectations and perceptions about fi ve-service quality dimensions. Servqual questionnaire includes 18 paired items with a seven-point Likert scale for measuring expectations and perceptions about the quality of services. During the fi eld survey, the researcher visited to homes, churches, and societies of EU citizens in Alanya. After explaining research proposes and getting permission to participate survey, questionnaires were administrated by the face to face interviews from June 2018 to August 2018.
Data Analysis
through the calculation of Cronbach alpha coeffi cient separately for both the expectations and the perceptions. At the second stage, in order to evaluate the dimensionality of the Servqual instrument, exploratory factor analysis with varimax rotation was performed separately for both expectations and perceptions. Results of the Kaiser-Meyer-Olkin (KMO) measure of sampling adequacy (MSA) and Bartlett’s test of sphericity were checked to assure that the data was suitable for factor analysis. Finally, a series of paired-samples t-tests were employed to investigate whether observed diff erences between expectations and perceptions are statistically signifi cant. The confi dence level was chosen as 95 %.
Results
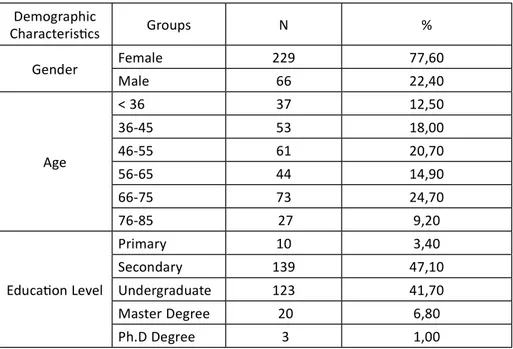
Based on frequency distribution and percentages, descriptive statistics of demographic variables which include nationality, age, gender, education, and income are presented in Table 3. 295 foreign residents, mostly German (54%) and UK citizens (10%) comprised the study sample. Of the 295 participants, 229 were female (78%) and 66 male (22%). Half of the respondents have resided in Alanya for six years or more. The average monthly income level of participants was € 1200 or equivalently €1630 when adjusted by purchasing power parities of the year 2018. (see eurostat). 146(49.5%) participants had an undergraduate degree or higher.
Table 3. Descriptive Statistics Demographic Characteris cs Groups N % Gender Female 229 77,60 Male 66 22,40 Age < 36 37 12,50 36-45 53 18,00 46-55 61 20,70 56-65 44 14,90 66-75 73 24,70 76-85 27 9,20 Educa on Level Primary 10 3,40 Secondary 139 47,10 Undergraduate 123 41,70 Master Degree 20 6,80 Ph.D Degree 3 1,00
Validity and Reliability of Servqual Scale
As shown in Table 4 principal component analysis with varimax rotation procedure was employed to confi rm the dimensionality of Servqual scale that was hypothesized to be have a fi ve-dimensional structure. The Kaiser-Meyer-Olkin values for both scales were 0,888 for expectations and 0.879 for perceptions, indicating that data were suffi cient principal component analysis. Bartlett’s Test statistics are λ2 =6454.159, (df=231, p<0.000) for expectations, and λ2 =9824.713,
(df=231, Sig.=0.000 ) for perceptions. Bartlett test statistics suggest that that correlation matrix showing correlation coeffi cients among the Servqual items is statistically diff erent from unit matrix .
Mounty Income €500-1000 153 51,90 €1001-1500 77 26,10 €1501-2000 22 7,50 €2001-2500 25 8,50 €2501-3000 12 4,10 > €3001 6 2,00 Home Country Germany 159 53,90 UK 30 10,20 Holland 22 7,50 Finland 27 9,20 Denmark 14 4,70 Sweden 14 4,70 Norway 12 4,10 Poland 17 5,80 Dura on of Residency 1-5 years 149 50,50 6-10 years 94 31,90 11-15 years 42 14,20 16-20 years 4 1,40 >21 years 6 2,00 Hospital Name Alanya Training Hospital 146 51.4 Private Hospital 124 43.7 Home Country Hospital 12 4.2 Other 2 0.7
Tablo 4. Principal Components Analysis
Principal component analysis with varimax rotation showed that 66.2% of the total variance in expectations and 65.7 % of the total variance in perceptions were explained by 5 latent variables (factors). Extracted factor structure for expectations and perceptions consisted of the structure of Serqual scale proposed by Parasuraman, Zeithaml, & Berry (1988). For this reason, it can be argued that Servqual scale is a suffi cient tool for measuring consumer’s expectations and perceptions for hospital services by the fact that perception and expectation items of the scale are highly correlated with their respective dimensions. As shown in
Items
Expecta ons Percep ons
Factor Loadings Factor Loadings Empathy 1 0,717 0,609 Empathy 2 0,549 0,735 Empathy 3 0,647 0,712 Tangibles 1 0,636 0,697 Tangibles 2 0,726 0,679 Tangibles 3 0,778 0,652 Tangibles 4 0,616 0,512 Tangibles 5 0,424 0,506 Assurance 1 0,741 0,746 Assurance 2 0,637 0,491 Assurance 3 0,596 0,564 Reliability 1 0,640 0,670 Reliability 2 0,697 0,689 Reliability 3 0,663 0,594 Reliability 4 0,772 0,515 Responsiveness 1 0,709 0,731 Responsiveness 2 0,619 0,747 Responsiveness 3 0,750 0,725 Responsiveness 4 0,783 0,738 Overall Cronbach Alpha
Table 4 Cronbach’s alpha values, for the overall scale for the quality expectations
and perceptions were 0,94 and 0,91 respectively. Cronbach’s alpha values for subdimensions of expectation and perception were ranging 0,72 to 0.80, suggesting that both the overall scale as well as each of the fi ve dimensions of Servqual are reliable for measuring service quality (Parasuraman, Zeithaml, & Berry, 1988).
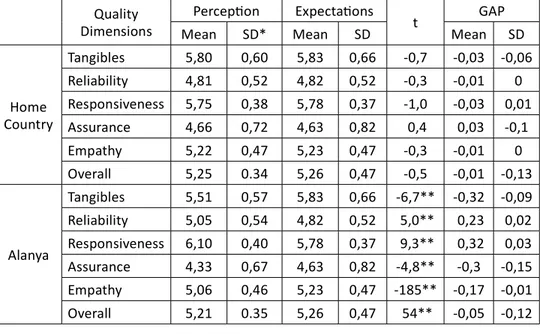
Table 5. Expectations and perceptions of EU citizens for hospital services in Home Country and Alanya
SD: Standard deviation, **P<0,001
The mean scores of the service quality expectations of EU citizens about hospital services appeared to be moderate and ranged from 4.63 for assurance to 5.83 for tangibles. Among the fi ve dimensions quality, the highest expectations of EU residents related to the tangibles and responsiveness, suggesting that physical elements of service environment and prompt service delivery are regarded to be the most important factors by EU citizens living in Alanya. In other words this fi nding suggests that EU citizens highly prefer hospitals to have up to date equipment, visually appealing facilities, and staff neat in appearance. Perception scores of EU residents for Alanya hospitals range from 6,10 for responsiveness to 4,33 for assurance whereas for their home country from 5,80 for tangibles to 4,66 for assurance.
The overall perception levels of EU citizens about the hospitals in their own countries (mean = 5.25) is higher than the overall perception levels about the hospitals in Alanya (mean = 5.21). EU citizens seem to make a more positive review about the hospitals in Alanya in terms of responsiveness and reliability.
Quality Dimensions
Percep on Expecta ons
t GAP
Mean SD* Mean SD Mean SD
Home Country Tangibles 5,80 0,60 5,83 0,66 -0,7 -0,03 -0,06 Reliability 4,81 0,52 4,82 0,52 -0,3 -0,01 0 Responsiveness 5,75 0,38 5,78 0,37 -1,0 -0,03 0,01 Assurance 4,66 0,72 4,63 0,82 0,4 0,03 -0,1 Empathy 5,22 0,47 5,23 0,47 -0,3 -0,01 0 Overall 5,25 0.34 5,26 0,47 -0,5 -0,01 -0,13 Alanya Tangibles 5,51 0,57 5,83 0,66 -6,7** -0,32 -0,09 Reliability 5,05 0,54 4,82 0,52 5,0** 0,23 0,02 Responsiveness 6,10 0,40 5,78 0,37 9,3** 0,32 0,03 Assurance 4,33 0,67 4,63 0,82 -4,8** -0,3 -0,15 Empathy 5,06 0,46 5,23 0,47 -185** -0,17 -0,01 Overall 5,21 0.35 5,26 0,47 54** -0,05 -0,12
There may be various reasons for this. The fi rst reason can be that EU citizens use the private hospitals in Alanya more. As can be seen in Table 3, a large majority of EU citizens (85%) prefer Alanya Training and Research Hospital and private hospitals outside emergencies. Başkent University Alanya Training and Research Hospital is a foundation hospital operatig under Başkent University and it is a non-profi t yet patient focused hospital. Gules, Çağliyan, & Gelmez (2011), Taner & Antony (2006) andIsik et al. (2011)compared patient perceptions by ownership status and found out the perception levels about private hospital services were higher than other hospital types. Ataman & Yarimoglu (2018)also found that the satisfaction levels of patients in special hospitals were higher than the satisfaction level in public hospitals.Meanwhile, EU citizens seem to have a more positive perception about their own countries in terms of tangibles, assurance and empathy. It can be suggested that hospitals in EU have more modern physical capabilities and their health systems generally have a higher performance.
Discussion
There were minimal discrepancies between services for health care providers expected and perceived, and no gaps in the patient’s expectations and minimal gap in perceptions were found in hospitals across the EU in comparison with those in Alanya. From the fi ndings, measurable and sensitive demands within the European Union community in the fi ve dimensions of effi ciency have been seen to be strongest, suggesting that the key drivers for EU people residing in Alanya are the functional elements of the service system and the availability of services immediately. This is a result which indicates that citizens in the European Union want hospitals that are visually appealing and elegant in the appearance of employees to have the most up to date equipment and faciliities. This result relates to previous inquiries (Bebko, 2000; Prakoso et al., 2017; Martini, Suardana, & Astawa, 2018). The degree of public perception of EU people in hospitals in their countries is higher than that of hospitals in Alanya and, in terms of reaction and effi ciency, tend to have a more benefi cial impact on hospitals in Alanya. Around the same period , people of the European Union tend to have a more optimistic concrete, assured and compassionate view of their nations. It can be noted that in the European Union, the physical capabilities of hospitals are more modern and their health systems are generally more eff ective. According to Thawesaengskulthai, Wongrukmit, & Dahlgaard (2015), the quality range of their healthcare systems has been strengthened in European countries. In terms of connectivity, consistency and performance, facilities have been enhanced.
The study showed that tangibility, reliability and response signifi cantly aff ect the comprehensive quality reports of the citizens of the European Union. The tangibility of certain health research has, as stated earlier, been found to be signifi cant. In this study, questions about tangible issues were examined with
a focus on technology, appliances, written materials and the development of a case manager. The European Union citizen’s lowest degree of understanding was the pledge. Such weak standards may be attributed to the assumption that such aspects do not infl uence patients’ views of consistency and overall satisfaction. The durability and reaction evaluation relative to the matching insurance products is more task focused. Nevertheless, managerial focus and frequent assessment is needed in such fi elds because the Effi ciency Metric off ers guidance on the quality and pacing of case managers and the reaction metric shows case manager interaction and client support skills. It is noteworthy that all fi elds identifi ed by EU residents had a stronger eff ect on their views than their home nation. Effi ciency and sensitivity were also important. Support, personal care and reassurance could therefore be what the citizens of the European Union are looking for from the Management Services.
Our results can leave health managers wondering how the concrete aspects can be strengthened and how EU citizens sympathy and sympathy can be guaranteed. Our research showed that measurable, confi dent and empathic experiences in the EU that go beyond happiness and overall content ratings would possibly be strengthened. In order to documents improvements in the fi eld and in quality and overall satisfaction, measurement and evaluation of patient perceptions and services are essential following an education-based intervention. The meetings and the qualities of services off ered often diff er in patients and health care providers’ perceptions. Often healthcare professionals focus on delivering resources while patients focus on personal experiences. Thus, it takes detailed communication expectations between the patient and the healthcare provider to capture and detect any unrealistic expectations they have. Considering the complicated laws and demands of health care agencies, it is much diffi cult for employees to invest time with customers on a face-to-face basis (Granata & Hamilton, 2015). Therefore, service providers and administrators are advised to seek process changes that allow greater contact time between service providers and patients.
Conclusion
The main purpose of this study is to reveal the evaluations of EU citizens who are resident in Alanya about the quality of the services in hospitals in their own countries and in Alanya. Despite not being the main purpose of this study, it was demonstrated with a factor analysis that the Servqual scale is highly compatible with the specifi c model developed by Parasuruman et al.4 on Turkey conditions.
The expectations of EU citizens about the hospital service quality are in the order of tangibles and resposiveness, empathy, reliability and assurance. As the diff erence between EU citizens’ quality expectations and quality perceptin is not statistically signifi cant, it can be suggested that their expectations are highly
about the hospitals in Alanya, it was determined that the EU citizens’ quality expectations are met in terms of responsiveness and reliability, however, their expectations are not satisfi ed in other dimensions. The largest gap between the quality expectations and perceptions is in tanginles and assurance. The gap analysis based on service perceptions and expectations provides valuable information with hospital managers to make informed decisions for quality control, quality improvement, and marketing. First of all, GAP scores enable managers to understand and evaluate the current service quality. By comparing perceptions with expectations hospital managers can develop strategies and action plans to close quality gaps that occurred. Hospital managers in Alanya especially need to focus on areas in relation to assurance, tangibles and empathy.
There is no consensus on the relative importance of each dimension of quality expectations in the health arena. For example, Yoo (2005)found that the major determinants of quality, measured as patient satisfaction, at outpatient clinics are aspects related with ‘tangibles’ and ‘empathy’ dimensions of services, on the other hand, ‘reliability’ is the important determinant of consumer satisfaction at hospitals. The most comprehensive and disease-specifi c (diabetes and stroke patients) study was conducted by Konerding et al. (2019)in six European Countries (England, Finland, Germany, Greece, The Netherlands, and Spain) to develop short universal patient satisfaction questionnaire based on Servqual scale with six dimensions. This study revealed that the correlations with general satisfaction were 0.58 for responsiveness, 0.56 for reliability, 0.56 for communication. 0.53 for empathy, 0.48 for tangibles and 0.47 for assurance. Karydis et al. (2001) investigated the perceptions and expectations of Greek patients regarding to quality of dental healthcare services and found that empathy was the most important dimension that patient desire to be fulfi lled followed by assurance, responsiveness, and reliability. Fan et al. (2017) found that Chinese patients’ expectations of service quality were ranked as follows (high to low): assurance, empathy, responsiveness, reliability, economy, and tangibles. Lee (2006), found that reliability and assurance were equally the most important dimensions of occupational health service followed by responsiveness, empathy, and tangibility. Research on the use of health services by Melo, Santinha, & Lima (2018)in Portugal found that physical assets were below expectations. Similarly, Tan & Pitir (2017)stated that the lowest perceived service quality dimension is physical assets in their research on patients in a public hospital.
The SERVQUAL methodology is based on the concept of “gap” measured as the diff erence between the expectations and perceptions of a consumers related to a healthcare services. Gap scores calculated in this study were presented in Table 5. Positive gap scores occurs when perceptions exceed expectations, indicating that the expectations were fulfi lled, whereas negative scores mean that expectations could not met. Without a doubt, whether these diff erences have a statistical signifi cance is as important as the direction of the diff erence between the mean scores in perception and expectation. As a result of the paired t test conducted to
determine if the diff erence observed between perception and expectation means is diff erent than zero, it can be seen that although the diff erence between perception and expectation about the hospital services in their own countries among EU citizens is negative, it is not signifi cant (p > 0.05); in other words, the expectations of EU citizens are highly met in their own countries.
L
imitation and future studiesThe study is limited to resident European Union citizens in Alanya health service. Future studies can address the expected and perceived services through diff erent healthcare service quality dimensions rather that just health care service in one region. Diff erent hospitals in diff erent regions and diff erent wards/departments can also give better understanding of healthcare conditions implemented in the hospitals. This research focused solely on the healthcare sector. Additional empirical eff orts could examine other types of service providers to determine whether fi ndings similar to this study would be obtained.
References
Al-Damen, R. (2017). Health care service quality and its impact on patient satisfaction “case of Al-Bashir Hospital”. International Journal of Business and Management, 12(9), 136 -152, DOI: 10.5539/ijbm.v12n9p136.
Ali, F., Dey, B. L., & Filieri, R. (2015). An assessment of service quality and resulting customer satisfaction in Pakistan International Airlines. International Journal of Quality & Reliability Management, 32(5), 486-502, DOI: 10.1108/ IJQRM-07-2013-0110.
Alrubaiee, L., & Alkaa’ida, F. (2011). The Mediating Eff ect of Patient Satisfaction in the Patients. In Perceptions of Healthcare Quality-Patient Trust Relationship, International Journal of Marketing Studies, 3(1), 103-127, DOI: 10.1.1.663.5764. Anderson, E.W., & Sullivan, M.W. (1993). The antecedents and consequences of
customer satisfaction for fi rms. Marketing science, 12(2), 125-143, DOI: 10.1287/ mksc.12.2.12.
Ataman, G., & Yarimoglu, K.E. (2018). Factors aff ecting patient satisfaction and hospital selection by hospital types. Hacettepe Health Administration Journal, 21(2), 273-288.
Barsky, J.D. (1992). Customer satisfaction in the hotel industry: meaning and measurement. Hospitality Research Journal, 16(1), 51-73, DOI: 10.1177/109634809201600105.
Bebko, C.P. (2000). Service intangibility and its impact on consumer expectations of service quality. Journal of services marketing 14(1), 9-26, DOI: 10.1108/08876040010309185. Bould ng, W., Kalra, A., Stael n, R., & Ze thaml, V. A. (1993). A dynam c process model
of serv ce qual ty: from expectat ons to behav oral ntent ons. Journal of market ng research, 30(1), 7-27, DOI: 10.1177/002224379303000102.
Brown, S.W., & Swartz, T.A. (1989). A gap analys s of profess onal serv ce qual ty. Journal of market ng, 53(2), 92-98, DOI: 10.1177/002224298905300207.
Cho , S., & Matt la, A. S. (2008). Perce ved controllab l ty and serv ce expectat ons: Infl uences on customer react ons follow ng serv ce fa lure. Journal of Bus ness Research, 61(1), 24-30, DOI: 10.1016/j.jbusres.2006.05.006.
Chou, C. H., Ch u, C. H., Ho, C. Y., & Lee, J.C. (2013, June). Understand ng Mob le Apps Cont nuance Usage Behav or and Hab t: An Expectance-Conf rmat on Theory. In PACIS (p. 132).
Church ll, Jr.G.A., & Surprenant, C. (1982). An nvest gat on nto the determ nants of customer sat sfact on. Journal of market ng research, 19(4), 491-504, DOI: 10.1177/002224378201900410.
Czep el, J.A., Solomon, M.R., Surprenant, C.F., & Gutman, E.G. (1985). Serv ce encounters: an overv ew. The serv ce encounter: Manag ng employee/customer nteract on n serv ce bus nesses, 3-15.
Dagger, T.S., Sweeney, J.C., & Johnson, L.W. (2007). A h erarch cal model of health serv ce qual ty: scale development and nvest gat on of an ntegrated model. Journal of serv ce research, 10(2), 123-142, DOI: 10.1177/1094670507309594.
Dash, S., Brun ng, E., & Acharya, M. (2009). The eff ect of power d stance and nd v dual sm on serv ce qual ty expectat ons n bank ng. Internat onal Journal of Bank Market ng, 27(5), 336 -358, DOI: 10.1108/02652320910979870.
Dean, A.M. (2004). Reth nk ng customer expectat ons of serv ce qual ty: are call centers d ff erent?. Journal of Serv ces Market ng, 18(1), 60-77, DOI: 10.1108/08876040410520717.
Devebakan, N., & Aksarayl , M. (2003). Sağl k şletmeler nde alg lanan h zmet kal tes n n ölçümünde SERVQUAL skorlar n n kullan m ve Özel Alt nordu Hastanes uygulamas , Dokuz Eylül Ün vers tes Sosyal B l mler Enst tüsü, 5(10), 38 -52. Díaz‐Martín, A.M., Igles as, V., Vazquez, R., & Ru z, A.V. (2000). The use of qual ty
expectat ons to segment a serv ce market. Journal of Serv ces Market ng, 14(2), 132-146, DOI: 10.1108/08876040010320957.
Donabed an, A. (1988). The qual ty of care: how can t be assessed?. Jama, 260(12), 1743-1748, DOI: 10.1001/jama.1988.03410120089033.
Duff y, J.A.M., & Ketchand, A.A. (1998). Exam n ng the role of serv ce qual ty n overall serv ce sat sfact on. Journal of Manager al Issues, 10(2), 240-255.
Fan, B.Z., Gao, L., L u, X., Zhao, S. H., Mu, H. T., & L , Z. (2017). Y. 2017. The moderat ng eff ect of external pressure on the relat onsh p between nternal organ zat onal factors and the qual ty of open government data. GOV INFORM Q, 34(3). Fat ma, T., Mal k, S.A., & Shabb r, A. (2018). Hosp tal healthcare serv ce qual ty, pat ent
sat sfact on and loyalty. Internat onal Journal of Qual ty & Rel ab l ty Management, 35(6), 1195-1214, DOI: 10.1108/IJQRM-02-2017-0031.
F ala, T.G. (2012). What do pat ents want? Techn cal qual ty versus funct onal qual ty: a l terature rev ew for plast c surgeons. Aesthet c Surgery Journal, 32(6), 751-759, DOI:10.1177/1090820X12452555.
Granata, R.L., & Ham lton, K. (2015). Explor ng the eff ect of at-r sk case management compensat on on hosp tal pay-for-performance outcomes: Tools for change. Profess onal Case Management, 20(1), 14-27, DOI: 10.1097/ NCM.0000000000000067.
Gronroos, C. (1984). A serv ce qual ty model and ts market ng mpl cat ons. European Journal of market ng 18(4), 36-44, DOI: 10.1108/EUM0000000004784.
Gronroos, C. (1994). From market ng m x to relat onsh p market ng: towards a parad gm sh ft n market ng. As a-Austral a Market ng Journal, 2(1), 9-29, DOI: 10.1016/ S1320-1646(94)70275-6.
Gronroos, C. (2000). Serv ce management and market ng: A customer relat onsh p management approach. John W ley and Sons, Ltd., Hoboken.
Gules, H.K., Çağl yan, V., & Gelmez E. (2011). Sympos um on Product on Research, Istanbul.
Holbrooke, M. B., & Corfman, K. P. (1985). Qual ty and value n the consumpt on exper ence: Phaedrus r des aga n. Perce ved Qual ty, 31(2), 31-57.
Hossa n, M.M. (2014). Pervas veness of SERVQUAL and ts potent al for the standards for funct onal qual ty of serv ce. Internat onal Journal of Serv ces and Standards, 9(1), 67-83, DOI: 10.1504/IJSS.2014.061061.
Is k, O. Ğ.U.Z., Teng l moglu, D., & Akbolat, M. (2011). Measur ng health care qual ty w th the Servqual method: a compar son n publ c and pr vate hosp tals. HealthMed 5(6), 1921 -1930.
Karyd s, A., Kombol ‐Kodovazen t , M., Hatz georg ou, D., & Pan s, V. (2001). Expectat ons and percept ons of Greek pat ents regard ng the qual ty of dental health care. Internat onal Journal for Qual ty n Health Care, 13(5), 409-416, DOI: 10.1093/ ntqhc/13.5.409.
Kav tha, R. (2012). Serv ce Qual ty Measurement n Health Care System - A Study n Select Hosp tals n Salem C ty, Tam lNadu. IOSR Journal of Bus ness and Management, 2(1), 37-43.
K l ç, S. (2016). Cronbach’ n alfa güven rl k katsay s . Journal of Mood D sorders, 6(1), 47-48.
Konerd ng, U., Bowen, T., Elkhu zen, S. G., Faubel, R., Forte, P., Karampl , E., ... & Torkk , P. (2019). Development of a un versal short pat ent sat sfact on quest onna re on the bas s of SERVQUAL: Psychometr c analyses w th data of d abetes and stroke pat ents from s x d ff erent European countr es. PloS one, 14(10), e0197924, DOI: 10.1371/journal.pone.0197924.
Kucukarslan, S., & Schommer, J. C. (2002). Pat ents’ expectat ons and the r sat sfact on w th pharmacy serv ces. Journal of the Amer can Pharmaceut cal Assoc at on, 42(3), 489-496, DOI: 10.1331/108658002763316923.
Lee, J. (2006). Measur ng serv ce qual ty n a med cal sett ng n a develop ng country: the appl cab l ty of SERVQUAL. Serv ces Market ng Quarterly, 27(2), 1-14, DOI: 10.1300/J396v27n02_01.
L at, C.B., Mansor , S., Chuan, G.C., & Imr e, B.C. (2017). Hotel serv ce recovery and serv ce qual ty: Infl uences of corporate mage and generat onal d ff erences n the relat onsh p between customer sat sfact on and loyalty. Journal of Global Market ng, 30(1), 42-51, DOI: 10.1080/08911762.2016.1262932.
L n, W.B. (2009). A study of relat ons among serv ce qual ty d ff erences, post‐purchase behav or ntent ons w th personal ty tra ts, and serv ce recovery strategy as nterven ng var ables. Internat onal Journal of Commerce and management 19(2), 137-157, DOI: 10.1108/10569210910967897.
Mart n , L.K.B., Suardana, I.B.R., & Astawa, I.N.D. (2018). D mens on Eff ect of Tang bles, Rel ab l ty, Respons veness, Assurance, Empathy, Leadersh p towards
Employee Sat sfact on. Internat onal research journal of management, IT and soc al sc ences, 5(2), 210-215.
Melo, A.I., Sant nha, G., & L ma, R. (2018). Measur ng the Qual ty of Health Serv ces Us ng SERVQUAL: Ev dence From Portugal. In: Handbook of Research on Modern zat on and Accountab l ty n Publ c Sector Management (pp. 300-318). IGI Global, DOI: 10.4018/978-1-5225-3731-1.ch014.
Mosadeghrad, A.M. (2013). Healthcare service quality: towards a broad defi nition. International Journal of Health Care Quality Assurance, 26(3), 203 – 219, DOI: 10.1108/09526861311311409.
Naidu, A. (2009). Factors aff ecting patient satisfaction and healthcare quality. International Journal of Health Care Quality Assurance, 22(4) 366-381, DOI: 10.1108/09526860910964834.
Narang, R. (2010). Measuring perceived quality of health care services in India. International Journal of Health Care Quality Assurance, 23(2) 171- 186, DOI: 10.1108/09526861011017094.
Oghuma, A.P., Libaque-Saenz, C.F., Wong, S.F., & Chang, Y. (2016). An expectation-confi rmation model of continuance intention to use mobile instant messaging. Telematics and Informatics, 33(1), 34-47, DOI: 10.1016/j. tele.2015.05.006.
Ojasalo, J. (2001). Managing customer expectations in professional services. Managing Service Quality: An International Journal, 11(3), 200-212, DOI: 10.1108/09604520110391379.
Oliver, R.L. (1980). A cognitive model of the antecedents and consequences of satisfaction decisions. Journal of Marketing Research, 17(4), 460-469, DOI: 10.1177/002224378001700405.
Olshavsky, R.W., & Miller, J.A. (1972). Consumer expectations, product performance, and perceived product quality. Journal of Marketing Research, 9(1), 19-21, DOI: 10.1177/002224377200900105.
Ovretveit, J. (1992). Health service quality: an introduction to quality methods for health services. Blackwell Scientifi c.
Palmer, A. (2001). Principles Of Services Marketing, UK: McGraw-Hill Companies. Parasuraman, A., Berry, L.L., & Zeithaml, V.A. (1990). Guidelines for Conducting Service
Quality Research. Marketing Research, 2(4), 34 -44.
Parasuraman, A., Zeithaml, V.A., & Berry, L.L. (1985). A conceptual model of service quality and its implications for future research. Journal of marketing, 49(4), 41-50. DOI: 10.1177/002224298504900403
Parasuraman, A., Zeithaml, V.A., & Berry, L.L. (1988). Servqual: A multiple-item scale for measuring consumer perc. Journal of retailing, 64(1), 12.
Portugal, R., Padilla, B., Ingleby, D., De Freitas, C., Lebas, J., & Miguel, J.P. (2007, September). Good practices on health and migration in the EU. In Final Draft: Conference Health and Migration in the EU: Better health for all in an inclusive society. Lisbon, 37-241.
Prakoso, A. F., Nurul, R., Wulandari, A., Trisnawati, N., Fitrayati, D., Rachmawati, L., & Andriansyah, E. H. (2017). Reliability, Responsiveness, Assurance, Empathy, and Tangible: Still Can Satisfy The Customer. International Journal of Business and Management Invention, 6(3), 68-75.
Renedo, A., Marston, C.A., Spyridonidis, D., & Barlow, J. (2015). Patient and public involvement in healthcare quality improvement: how organizations can help patients and professionals to collaborate. Public Management Review, 17(1), 17-34, DOI: 10.1080/14719037.2014.881535.
Robledo, M.A. (2001). Measuring and managing service quality: integrating customer expectations. Managing Service Quality: An International Journal 11(1), 22-31, DOI: 10.1108/09604520110379472.
Rust, R.T., & Oliver, R.L. (1994). Service quality: insights and managerial implications from the frontier. Service Quality: New directions in Theory and Practice, 1-19, DOI:10.4135/9781452229102.
Schneider, B., & White, S. S. (2004). Service quality: Research perspectives. Sage. Shabbir, A., Malik, S.A., & Janjua, S.Y. (2017). Equating the expected and perceived
service quality. International Journal of Quality & Reliability Management 34(8), 1295-1317, DOI: 10.1108/IJQRM-04-2016-0051.
Svari, S., & Olsen, L.E. (2012). The role of emotions in customer complaint behaviors. International Journal of Quality and Service Sciences, 4(3), 270-282, DOI: 10.1108/17566691211269585.
Tam, J.L. (2005). Examining the dynamics of consumer expectations in a Chinese context. Journal of Business Research, 58(6), 777-786, DOI: 10.1016/j. jbusres.2003.08.011.
Tan, M., & Patir, S. (2017). Measurement and Evaluation of Healtcare Service Quality Application in the Bingol State Hospital. Journal of Current Researches on Health Sector, 7(2), 29-40, DOI: 10.26579/jocrehes_7.2.3.
Taner, T., & Antony, J. (2006). Comparing public and private hospital care service quality in Turkey. Leadership in Health Services, 19(2), i – x, DOI: 10.1108/13660750610664991. Teas, R. K. (1993). Consumer expectations and the measurement of perceived service quality. Journal of Professional Services Marketing, 8(2), 33-54, DOI: 10.1300/ J090v08n02_05.
Thawesaengskulthai, N., Wongrukmit, P., & Dahlgaard, J. J. (2015). Hospital service quality measurement models: patients from Asia, Europe, Australia and America. Total Quality Management & Business Excellence, 26(9-10), 1029-1041, DOI: 10.1080/14783363.2015.1068596.
World Health Organization. (2000). The world health report 2000: health systems: improving performance. World Health Organization.
Yelkur, R., & Chakrabarty, S. (2006). Gender diff erences in service quality expectations in the fast food industry. Services Marketing Quarterly, 27(4), 141-151, DOI: 10.1300/J396v27n04_08.
Yoo, S. (2005). Service quality at hospitals. ACR Asia-Pacifi c Advances in Consumer Research 6, 188-193.
Zeithaml, V.A., Berry, L.L., & Parasuraman, A. (1993). The nature and determinants of customer expectations of service. Journal of the Academy of Marketing Science, 21(1), 1-12, DOI: 10.1177/0092070393211001.
Zeithaml, V.A., Bitner, M.J., & Gremler, D.D. (2018). Services marketing: Integrating customer focus across the fi rm. McGraw-Hill Education.
Zeithaml, V. A., Parasuraman, A., Berry, L. L., & Berry, L. L. (1990). Delivering quality service: Balancing customer perceptions and expectations. Simon and Schuster.