GRADUATE SCHOOL OF NATURAL AND APPLIED
SCIENCES
DEPARTMENT OF ELECTRICAL&ELECTRONICS
ENGINEERING
MASTER OF SCIENCE THESIS
ANALYSIS OF TRANSIENT STABILITY BY USING
POWER SYSTEM STABILIZER AND STATIC VAR
COMPENSATOR
Prepared by: HALKAWT ABDALQADIR KH AHMEED AL-SHEKHANI
Thesis Supervisor: Assoc. Prof. Dr. Fevzi HANSU
ii
APPROVAL OF THE THESIS
The thesis titled Analysis of Transient Stability by Using Power System Stabilizer and Static VAR Compensator submitted by HALKAWT ABDALQADIR KH AHMEED AL-SHEKHANI in partial fulfillment of the requirements for the degree of Master of Science in Electrical and Electronics Engineering Department, Siirt University, in 26.06.2018
approved by,
Jury Members Signatures
Chairman
Assoc. Prof. Dr. Ömer Faruk ERTUĞRUL ………..
Thesis Supervisor
Assoc. Prof. Dr. Fevzi HANSU ………..
Member
Assist. Prof. Dr. Melih KUNCAN ………..
I confirm the above results.
Assoc. Prof. Dr. Fevzi HANSU
iii
ACKNOWLEDGEMENT
I am highly grateful to my best supervisor (Assoc. Prof. Dr. Fevzi HANSU) for his guidance and supervision of my thesis. I would like to thank especially to my friend (Faraedoon Waly) who works at the University of Halabja and also I would like to a special thank to my dearest family.
iv CONTENTS
APPROVAL OF THE THESIS ... ii
ACKNOWLEDGEMENT ... iii
LIST OF TABLES ... v
LIST OF FIGURES ... vi
SYMBOLS AND ACRONYMS ... vii
ÖZET ... viii
ABSTRACT ... ix
1. INTRODUCTION ... 1
1.1. Objectives ... 2
1.2. Fault Analysis: ... 3
1.3. Power System Stability ... 4
1.3.1. Transient stability analysis ... 6
1.3.1.1. Critical clearing time and fault clearing time ... 7
1.3.2. Rotor angle stability ... 8
1.3.3. Voltage stability ... 8
1.3.4. Frequency stability ... 9
1.4. Static VAR Compensator ... 9
1.5. Power System Stabilizer (PSS) ... 11
2. LITERATURE REVIEW ... 12
3. SYSTEM DESCRIPTION AND METHOD ... 16
3.1. System Description ... 16
3.1.1. Swing equation ... 16
3.2. Method ... 17
3.2.1. Simulation model explanation ... 17
3.2.2. Simulation model ... 21
3.3. Employed Procedure ... 23
4. RESULTS AND DISCUSSIONS ... 24
4.1. Results ... 24
4.2. Discussion ... 38
5. CONCLUSIONS AND RECOMMENDATIONS ... 41
5.1. Conclusions ... 41
5.2. Recommendations ... 41
6. REFERENCES ... 42
v
LIST OF TABLES
Page
Table 3.1: M1 parameters ... 22
Table 3.2: M2 parameters ... 23
vi
LIST OF FIGURES
Page
Figure 1.1: Type of faults ... 4
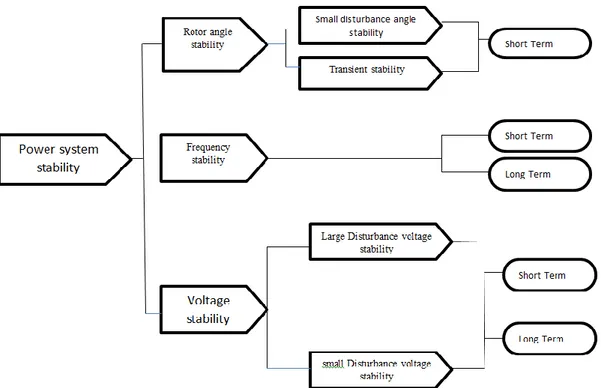
Figure 1.2: Classification of stability... 6
Figure 1.3: Static VAR Compensator ... 10
Figure 1.4: The system diagram of power system stabilizer ... 11
Figure 3.1: Two machine transmission system ... 16
Figure 3.2: Transient stability of a two machine system with PSS&SVC ... 18
Figure 3.3: Turbine and regulators of M1 ... 19
Figure 3.4: Turbine and regulators of M2 ... 20
Figure 4.1: Transmission system without PSS and SVC ... 24
Figure 4.2: Transmission system results without (PSS and SVC) ... 25
Figure 4.3: Transmission system with PSS but without SVC and without fault ... 26
Figure 4.4: Transmission system results with PSS but without SVC ... 27
Figure 4.5: The system without PSS and SVC when L-G fault occurred ... 28
Figure 4.6: The system results without PSS and SVC when L-G fault occurred ... 29
Figure 4.7: Transmission system with PSS but without SVC when L-G fault occurs ... 30
Figure 4.8: The results with PSS and SVC when L-G fault occurs ... 31
Figure 4.9: Transmission system with PSS and SVC when L-L fault occurred ... 32
Figure 4.10: The results of L-L FAULT with PSS and SVC ... 33
Figure 4.11: Transmission system with PSS and SVC when L-L-G fault occurred ... 34
Figure 4.12: The results of the system run with PSS and SVC when L-L-G fault occurs ... 35
Figure 4.13: The results of the system running with PSS and SVC when L-L-L fault occurs ... 36
Figure 4.14: The results of the system running with PSS and SVC when L-L-L-G fault occurs ... 37
vii
SYMBOLS AND ACRONYMS
Symbols Explanation Δ Delta λ Star ω Omega T Torque Acronyms Explanation AC Alternating Current
AVR Automatic Voltage regulator CCT Critical Clearing Time DC Direct Current
FACTS Flexible AC Transmission System FCT Fault Clearing Time
FT Fault Time
G Ground
L Line
L-G Line to Ground L-L Line to Line
L-L-G Line to Line to Ground L-L-L Line to Line to Line
L-L-L-G Line to Line to Line to Ground MVA Mega Volt Ampere
PSS Power System Stabilizer SVAR Static-Volt-Ampere-Reactive SVC Static VAR Compensator
TCSC Thyristor Controlled Series Capacitor VAR Volt-Ampere-Reactive
viii ÖZET
YÜKSEK LİSANS TEZİ
GÜÇ SİSTEMİ KARARLILAŞTIRICISI VE STATİK VAR
KOMPANZASYONU YÖNTEMİ İLE GECİŞ KARARLILIĞI ANALİZİ
HALKAWT ABDALQADIR KH AHMEED Siirt Üniversitesi Fen Bilimleri Enstitüsü Elektrik-Elektronik Mühendisliği Anabilim Dalı
Danışman: Doç. Dr. Fevzi HANSU
2018, 45+ix Sayfa
Bu tez çalışmasında, bir güç iletim sisteminin dengeli ve dengesiz arıza durumlarında geçiş kararlılığını arttırmak amacıyla sisteme dâhil edilen Güç Sistemi Kararlılaştırıcısı (GSK) ve Statik Var Kompanzasyonunun (SVK) sistem üzerindeki etkileri incelenmiştir. Çalışma kapsamında MATLAB SIMULINK programı kullanılarak 3-Baralı bir güç aktarım sistemi modellenmiştir. Güç sistemi temel olarak üç fazlı bara sistemi, iki adet yükseltici transformatör ve iki üniteden (Senkron Jeneratör) oluşmaktadır. Birinci Jeneratör 1000 MVA üretme kapasitesine sahip, ikincisi ise 2000 MVA elektrik gücü üretme kapasitesine sahip olacak şekilde seçilmiştir. Analiz işlemleri, sistemde sadece GSK varken, GSK yokken ve GSK+SVK birlikte varken ki durumlar göz önüne alınarak; Faz-Toprak (F-T), Faz-Faz (F-F), Faz-Faz-Toprak (F-F-T), Faz-Faz-Faz (F-F-F) ve Faz-Faz-Faz-Toprak (F-F-F-T) gibi çeşitli arıza durumlarındaki sistemin tepkisine ait benzetim (simülasyon) sonuçlarını içermektedir. Simülasyon sonuçları, GSK+SVK'nın sistemde birlikte kullanılmasının sistemin gerilim kararlılığını, aktif güç kararlılığını, reaktif güç kararlılığını, rotor hız kararlılığını ve Senkron Jeneratörlerin rotor açısı kararlılığını önemli ölçüde artırabildiğini göstermiştir. Ayrıca, GSK+SVK'nın devre kesicilerin röle ayarlarının hassasiyeti için çok önemli olan Kritik Toparlanma Sürelerinin (KTS) belirlenmesinde de etkin bir rolü olduğu sonucuna varılmıştır.
Anahtar Kelimeler: Güç Sistem Kararlılaştırıcısı, Statik Var Kompanzatörü, Geçiş Kararlılığı, Dengeli veya Dengesiz Arızalar
ix ABSTRACT
MSc. THESIS
ANALYSIS OF TRANSIENT STABILITY BY USING POWER SYSTEM STABILIZER AND STATIC VAR COMPENSATOR
HALKAWT ABDALQADIR KH AHMEED
The Graduate School of Natural and Applied Science of Siirt University The Degree of Master of Science
In Electrical-Electronics Engineering Department Supervisor: Assoc. Prof. Dr. Fevzi HANSU
2018, 45+ix Pages
In this thesis, the effect of Power System Stabilizer (PSS) and Static Var Compensator (SVC) was analyzed to improve the transient stability of a power transmission system in the case of balanced or unbalanced faults. In the scope of work, a 3-bus power transmission system has been modeled by using MATLAB SIMULINK program. The power transmission system basically consists of three bus systems, two step up transformers and two units (Synchronous Generators). The first Generator generates 1000 MVA and the second one generates 2000 MVA electrical power. The thesis consist of the simulation results for different cases such as with PSS alone, without PSS and with PSS&SVC together in the conditions of various types of faults such Line to Ground (L-G), Line to Line (L-L), Line to Line to Ground (L-L-G), Line to
Line to Line (L-L-L) and Line to Line to Line to Ground (L-L-L-G). The results show
that PSS&SVC could significantly improve the voltage stability, the active power stability, the reactive power stability, the rotor speed stability and the rotor angle stability of the Synchronous Generators. And also, it could help determining Critical Clearing Times (CCT) that is very important for better relay settings of circuit breakers. Keywords: Power System Stabilizer, Static Var Compensator, Transient Stability,
1 1. INTRODUCTION
Generation station, transmission line, and distribution system are the main three parts of an electrical power system. Electrical Generators are used to generate the electrical power (Ramlal Das, 2014). Generating stations are connected to the distribution systems (load centres) via transmission lines. Transformers are used to step up the voltage level while they reduce the current level related to which the power losses can be reduced. There must be another Transformer type which connects to the end of transmission line so that power can be distributed accordingly (Wadhwa, 2005). Engineers should make a required design for power systems to offer continuous and stable power supply. However, undesired faults sometimes occur in the system due to undesired events, such as accidents, heavy rain…etc. Expert engineers should make such a design so that electrical supply should deliver reliable and uninterrupted service to the customers (Ramlal Das, 2014). The power supply reliability can imply further than merely being available (Wadhwa, 2005).
Power systems are going to be more complex due to the increase of people’s demand. This causes installation of big power plants, increasing interconnections and extra-high voltage tie-lines (Povh, 1996). Stability can be seen as a major concerning the operation of a power system. The stability can be defined as a performance of the electrical system remain in stable operating under normal operation condition and to retain stable operating system after being subjected to an abnormal disturbance (Hashim, Hamzah, Latip, & Sallehhudin, 2012). Steady state stability and transient stability analysis are very important to be considered in stability studies. The former is described as the ability of power system to maintain synchronism after being subjected to small disturbances (P. Kundur, 1994). The second one is defined as the ability of power system to retain the initial operation condition after being subjected to a severe transient disturbance, such as three-phase to ground fault, or loss of a large load (Tailor, Bhalja, & Makawana, 2012). It is important to consider that transient stability is a function of both the normal operation condition and disturbances. Stability can be explained as a condition of equilibrium between two opposing forces, but instability
2
occurs if the disturbance results in a continuous imbalance between opposing forces (Nallagalva, Kirar, & Agnihotri, 2012).
A large interconnection system design for stable operation at effective cost might be very complex issue for engineers. In this paper we deal with modelling of transient behaviour of interconnected power system when it is subjected to various faults. Our objective here is to construct a model whose quality is judged in terms of transient simulation throughout looking at variety of faults in different places in the system (PAS&design). Fast clearing of faults is most economic and effective way to improve transient stability and to promote system stability (Kimbark, 1995) (Kundur, Balu, & Lauby, 1994). Various kinds of protective equipment have been invented to detect faults and isolate faulted parts from the power system quickly from which the system can regain synchronism else the fault energy propagates to the rest of the system. In this paper, critical clearing time (CCT) for different faults at different locations is determined. CCT helps us to establish suitable protection system, Such as setting the protective relays to disconnect the faulted part to clear the fault from the system.
There are many developed computer programs for modelling and analysing power system stability, such as ETAB, MATLAB simulation, PSpice and etc. MATLAB/Simulink is an interactive environment for modelling and simulating various dynamic systems (Patel T. S., 2002). It can be used to build systems easily via using blocks and then to display results quickly. Simulink is an ideal research tool for studying the effects of non-linearity of the system. Use of Simulink is developed quickly for research work in the most of engineering areas including electrical power system. In this paper, MATLAB/simulink is used to investigate transient stability analysis for different faults. (Patel T. S., 2002) (Prakash & Tripathi, 2015).
1.1. Objectives
This thesis concerns with investigating of transient stability behaviour of the system just in case of having various faults by analysing the machines’ characteristic states, considering rotor angle, machine speed, bus voltages and currents and also terminal voltages. Critical clearing time will be focused to analyse and evaluate the
3
transient stability of the interconnection systems by addressing the machines’ characteristic states behaviour for an applied fault. This paper will investigate the ability of PSS and SVC to stabilize electrical power system. The goal here is to determine the relation between static voltage controller (SVC) and CCT by means the effect of
SVC-voltage controller on transient period. In this work, it was demonstrated a simplified an
accessible design which is provided in MATLAB toolbox to study the transient stability performance of a practical power system through looking at stability of a system which composes of two synchronous generators, 3-Bus and load, connected via transmission line. This work is organised as follows. Firstly, faults and power system stability containing transient stability, rotor angular stability, voltage stability and frequency stability respectively will briefly be explained. Secondly, a brief description of the system design and methods to perform this work will be given. Thirdly, results obtained from different case studies will be showed and evaluated. Finally, in the conclusion part, the whole project will be summarised, and research achievement will be explained.
1.2. Fault Analysis:
Any failure in a power system, which becomes a barrier to flow a normal current, is called fault. In order to protect the system from a heavy short circuit current flow, it is necessary to disconnect the faulty part from the system. (Machowski, Bialek, & Bumby, 1997). Fault can be classified into two types; balanced fault, and unbalanced faults. Symmetrical (balanced) fault is usually happened if three line short circuit or three phases to ground short circuit occur. Although balanced fault is rarely happen, it is the most sever type of fault that may occur in transmission lines. L-G, L-L-G, L-L short circuit are called unsymmetrical or unbalanced fault. Due to unbalanced fault, there will be unequal currents with different displacement angle in the transmission systems. According to the frequency of occurred faults can be classified as; L-G, L-L, L-L-G and symmetrical faults (see Fig. 1.1). The most common type of fault in the transmission line is line to ground fault. To have proper design, symmetrical fault will be assigned for stability analysis in power systems (Chang & Hsu, 2011) . The effects of unbalanced faults condition on the plants should be determined to establish reliable protection
4
system, such as settings of protection relays and relative parameters and other control devices in the power system. In this work, we may focus on:
(i) L-G fault which is the most common type of fault
(ii) Three lines to ground fault which is the most danger type of fault. (iii) Single line to ground as a most common type of fault
(iv) Three phase to ground fault as a most severe type of fault. (Machowski, Bialek, & Bumby, 1997) (Chang & Hsu, 2011)
1- Phase-to-earth fault (L-G) 2-Phase-to-phase-to-earth fault (L-L-G)
3-Three phase-to-earth fault (L-L-L-G) 4- Phase-to-phase fault (L-L) 5- Three phase fault (L-L-L)
Figure 1.1: Type of faults
1.3. Power System Stability
Most of the equipment may be concerned with the response of the power system to a disturbance. For instance, having a fault on a critical element, and then isolating the fault by protective relays will cause changes in the network’s variables such as bus
5
voltages, power flows, and machine rotor speeds; the voltage will changes equipment’s characteristics. In addition, protective device in individual equipment will response to changing in system variables, and then these will affect the system performance (Anderson & Fouad, 2002). It is possible to say that a typical power system whose dynamic performance is influenced by a wide array of devices with various response rates and characteristics is thus a very high-order multivariable process. Therefore, instability will occur in various time and places depending on the topology of the power system, the type of the disturbance and the machine’s operating mode. Power system stability can be defined as the performance and power ability of any system to retain normal operation condition state with any abnormal disturbance occurs in the system (Kaur & Kakran, 2012) (Anderson & Fouad, 2002). There will be many different types of instabilities in the power system due to the complexity and high dimensionality of its constrictions and behaviours. Stability phenomenon is seen as a main problem, which involved with instabilities should be clearly focused and explained. To be able to understand and clarified the meaning of stability in significant power system stability analysis study, it is essentially classified based on the following considerations (Prakash & Tripathi, 2015):
(i) The nature of instability results in the system. (ii) The timeframe of stability.
(iii) The size of the disturbance.
The ability of the system to transit between two operating points under the condition of small load changes is called steady state stability (Kimbark, 1995). Dynamic stability defines as a class of rotor angle stability to describe the ability of the system to maintain the stable operation after various disturbances (Machowski, Bialek, & Bumby, 1997). Figure 1.2 shows the stability classification of the power system.
6
Figure 1.2: Classification of stability
1.3.1. Transient stability analysis
The synchronous generators used in this system will be operating in the same frequency as 60 hertz and the synchronous speed to maintain balance between mechanical power of input and electrical power of output. The system frequency falls if generation is less than the actual load, and rises if the generation is more than the actual customer load.
The power system is normally subjected to a diversity of disturbances. Large disturbances, such as a three-phase fault on a transmission line, loss of a generating unit or loss of a major load (Anderson & Fouad, 2002) due to overloading, severe lightning strikes and accidents may occur in electrical power systems. Transient stability is the ability of the system to continue the transition following a large disturbance and reach an acceptable operating condition.
The imbalance between input power and output power of the generator occurs when there is some disturbances occur in the interconnected system. Consequently, Some generators tend to slow down speed and some tend to speed up with this
7
perturbed system. This trend may be too large for a particular generator, in such a case that it cannot be synchronized with the rest of the generator so that it will automatically be disconnected from the system. This phenomenon is called as a generator going out of step. The purpose of transient stability analysis is to evaluate the electrical power system ability to endure disturbances and to survive transition to a state of normal operating condition. As a pre-requisite to transient stability analysis, it is essential to solve load flow calculations to determine the steady-state conditions of the network. Then, results are used to calculate the initial conditions for dynamic models of the system. Many fault events are assigned in the utility for transient stability simulations. For instance, setting different faults with different fault impedances and fault times have been assigned for the transient stability analyses. Critical clearing time (CCT) is assigned as a most significant factor for keeping the transient stability of the system (Nallagalva, Kirar, & Agnihotri, 2012).
1.3.1.1. Critical clearing time and fault clearing time
A large system design to ensure stable operation at effective cost is a big problem for electrical engineers. In this project we deal with modelling of transient behaviour of power system when different types of fault occur. In this project it was found that the value of CCT to shown the effect of different types of fault and to evaluate transient stability. CCT calculation is very important in transient stability (Sharma & Hooda, 2012). For each type fault, The CCT is a maximum fault duration for which power system will not loss its stability (Ananthapadmanabha, Kulkarni, Kulkarni, Pradeep, & Chetan, 2010) (Kamdar, Kumar, & Agnihotri, 2014). The system will lose stability when the FCT is more than CCT then because the rotor angles will go out of step (Nallagalva, Kirar, & Agnihotri, 2012). This means that FCT will be less than CCT to regain stability after the fault occurs. Protective relays and other relative parameters are set based on these two important times. Time-domain simulation is the only way to obtain CCT in the multi-machine power systems (Sharma & Hooda, 2012) (Nallagalva, Kirar, & Agnihotri, 2012).Time domain simulation was known as the best method to calculate CCT (Ananthapadmanabha, Kulkarni, Kulkarni, Pradeep, & Chetan, 2010).
8 1.3.2. Rotor angle stability
The stability of synchronous machines depends on the ability to maintain equilibrium between the input torque and the output torque of each synchronous machine in the system (Sharma & Hooda, 2012). For each generator with a constant speed in steady state conditions, there is equilibrium between both torques (Anderson, Kundur, & Vittal, 2004). There are two components to resolve the change in electrical torque ΔT of a synchronous machine:
(i) Damping torque component, in phase with the speed deviation (Δω). (ii) Synchronizing torque component, in phase with rotor angle p (Δδ).
where,
TS: the coefficient of the synchronizing torque
TD is the coefficient of the damping torque (Kundur, Balu, & Lauby, 1994) (Pawar,
2015).
In general, the angular stability of the rotor is depends of the initial operating conditions and the severity of the failure of the synchronous machine. Based on the nature and the location of the disturbances in the system, the angular stability of the rotor can be classified into:
(i) Small signal stability: Maintaining synchronism under small disturbances. (ii) Transient stability: Maintaining synchronism when subjected to severe
transient disturbance (Kundur, Balu, & Lauby, 1994) (Anderson, Kundur, & Vittal, 2004).
1.3.3. Voltage stability
Voltage stability in the initial operating state is defined as the ability of power system to remain steady acceptable voltages at all buses after occurred a fault (Anderson, Kundur, & Vittal, 2004) (Vikhram & S.Latha, 2012). Voltage stability
9
depends on the ability of the system to remain balance between generator and load. The system runs into a state of voltage instability when an increased demand in load causes uncontrollable decline in voltage (Kundur, Balu, & Lauby, 1994). When the load is not equal to that supplied by the generators, the voltage instability occurs.
1.3.4. Frequency stability
Frequency stability is the ability of the power system to maintain a stable frequency after a critical system start-up resulting in a significant imbalance between load and power generation (Kundur, Balu, & Lauby, 1994) (Anderson & Fouad, 2002). The loss of generation in frequency instability assessment is determined as a typical reason, which results in abrupt unbalance between the load and generation. Therefore, frequency instability depends on the system's ability to restore system load and power balance. Improving the system frequency by using the control method of the frequency deviation, activates the rotation reserve of the remaining units instantaneously and supplies the load demand of the customer to increase the frequency (Anderson, Kundur, & Vittal, 2004).
In general, poor coordination of control and protection equipment, inadequacies in equipment responses and insufficient generation reserve associate with frequency stability issues in the power system (Anderson & Fouad, 2002) (Anderson, Kundur, & Vittal, 2004). Therefore, frequency stability can be identified as a short-term phenomenon or a long-term phenomenon.
1.4. Static VAR Compensator
A static VAR compensator is a set of electrical devices that provide fast reactive power in a high voltage electrical power transmission network. (Khoshnaw Khalid Hama, 2015). The SVC typically consists of a Coupling Transformer, TCR, TSC and
ACF.
1- TCR continuously controls the reactive power by changing the current amplitude flowing through the reactor (Urmila Bainsla, 2015).
10
2- TSC switches the capacitors on and off (Urmila Bainsla, 2015).
3- AC filters provide fixed reactive power and absorb the harmonic current generated by TCR (Urmila Bainsla, 2015).
Figure 1.3: Static VAR Compensator
The magnitude of the SVC is inductive admittance BL(α) is a function of the firing angle and is given as:
BL(α)
where,
(1)
Vs is SVC bus bar voltage and QL is MVA rating of reactor. As the SVC uses a fixed capacitor and variable reactor combination
(TCR-FC), the effective shunt admittance is
Bs =
(2)
Where Xc is capacitive reactance (Khoshnaw Khalid Hama, 2015) (Urmila Bainsla, 2015).
11 1.5. Power System Stabilizer (PSS)
PSS is a generator control device used in feedback to enhance the damping of
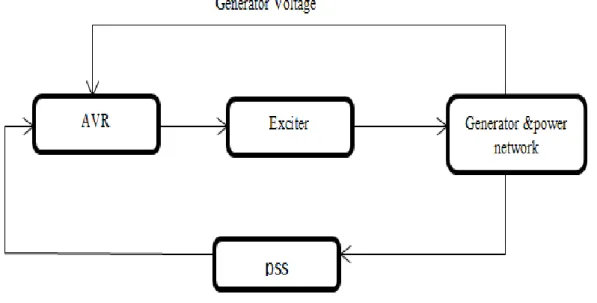
rotor oscillation due to signal disturbance. The disturbance perhaps caused even by little changes in the voltage regulator. The PSS is designed to introduce electrical torque in phase with changes in rotor speed (damping torque). This is accomplished by the auxiliary stabilization signal ΔVS applied to the generator's automatic voltage regulator (AVR), as shown in Figure 1.4(Ajay Chaudhary, 2012). PSS produce a component of torque on the machine rotors which is on phase with generator speed variations. This complementary control method is very important during line outages and large power transfers (Urmila Bainsla, 2015) (Kumar, 2016).
Figure 1.4: The system diagram of power system stabilizer
Simple setup MB - PSS acceleration force (delta Pa) PSS is given above. The need for effective attenuation of such extensive electromechanical vibration for nearly 20 years motivated the concept of multiband power system stabilizer (MB-PSS). The structure of MB-PSS is based on multiple working bands as its name implies. Three separate bands dedicated to low, mid and high frequency vibration modes are used. The low range is usually the global mode of the power system, the middle of the inter area mode, and the local mode (Kumar, 2016).
12 2. LITERATURE REVIEW
Flexible AC transmission system (FACTS) controllers such as static var compensator (SVC), thyristor control series compensator (TCSC), static synchronous compensator (STATCOM), and unified power flow controller (UPFC) damp inter-area vibration. Hence, this project presents the significant of SVC and power system stabilizer to improve the transient stability of power transmission system when balance or unbalance fault occurs. In this project 3-Bus power transmission system has been modeled by using MATLAB SIMULINK program. There are many studies related to the topic and some important studies are briefly given in below.
The study done by Sidhartha Panda Ramnarayan in 2006, includes two area system modelled with two machines. By using these machines, M1 producing 1400
MVA M2 producing 700 MVA for 500 km long transmission line, SVC and STATCOM has been used for this model has the same rating, three fault occurred at the end bus at time t = 0.1 s, the system tested with a fault, in the results showed that STATCOM is more effective in improving stability at that FCT (Sidhartha Panda, 2006).
Ajay Chaudhary and Ram Avtar Jaswal (2012) studied the comparative analysis of transient stability improvement used power system stabilizer and static VAR. In the study, they used 3 machine and 9 bus system connected to the power system stabilizer and a static VAR compensator by using the MATLAB program to simulate it. The simulation results showed that the PSS can remove only small oscillation. Although it cannot be completely removed the large oscillations, when SVC is connected, it is possible to get better results by removing oscillation. It can be concluded that SVC shows better performance than power stabilizer (Ajay Chaudhary, 2012).
In the paper done by Suparna Pal in 2012, a power system transient stability analysis and improvement by FACTS controllers topic was studied. The results of the study showed that after being introduced to the FACTS controller system, it turned out that it was stable according to reactive power supply capacity. Also it can be noticed from the study that VARs with higher reactivity are obtained without two STATCOMs connected in parallel than SVCs. The transient stability of this type of power system can
13
be improved by applying the appropriate FACTS controller to the appropriate location. The result solved the transient stability, improved the alternator parameters, the power system maintained its stability limit through a system operating in a complex synchronous system (Pal, 2012).
Mohit Yadav and his friends did a study titled used Fuzzy Logic & P controlled braking resistor to transient stability improvement of SMIB power system in 2012. From the study it can be said that, this method is very effective in improving the transient stability and the strategy is also very simple, but the main disadvantage for this study is that energy is wasted by dissipation with resistance (Mohit Yadav, 2012).
In the paper written by N. Hashim, N. Hamzah, M.F. Abdul Latip, titled Transient Stability Analysis of the IEEE 14-Bus Test System Using Dynamic Computation for Power Systems (DCPS) in 2012. In the study, Transient Stability Analysis of the IEEE 14-bus test system has been successfully analyzed by using DCPS software package. The results showed that the system lost its stability when fault time equal to 0.15s and it was found CCT equal to 0.145s when the fault occurred exactly at the main generator (Hashim, Hamzah, Latip, & Sallehhudin, 2012).
In the paper of Dhaval N Tailor, Bhavesh Bhalja, Vijay Makawana, written in 2012, it was investigated the roll of PSS and SVC to improve the transient stability of Power System. The system consists of 4 machines and each machine included 900
MVA, indicating by used that PSS along cannot maintain stability, but in some cases it is
necessary to use other equipment to maintain stability (Nallagalva, Kirar, & Agnihotri, 2012).
At the study done by Salma Keskes and her friends titled Static Var Compensator and Tuning Employing Genetic Algorithm used to Improvement of Power System Stability in 2014, they used single machine infinite bus and the results show a clearly improvement when comparing to the system that use only PSS. Also the results show that genetic algorithm allows having optimal controller parameters to ensure the convergence in a short time (Salma, 2014).
14
Tran Thi Ngoat and Le Ngoc Giang (2013) studied SVC-PSS and STATCOM-PSS for improving transient stability of power system in 2013. In the study, they used a system consists of four generator in two power plant. The first power plant generated 1000 MW and the second one generated 5000 MW. 200 MVAR Static Synchronous Compensator connected to the system to remain the stability. The results showed that the system could not remain stable when three phase fault occurred with PSS and without SVC and STATCOM. In other hand, when the system runs with SVC or
STATCOM, it could easily clear the fault (Giang, 2013).
Satvinder Singh and his friends studied cconsidering a two-area power system in 2013. The first area (power plant 1) consisted of two generators and the second area (power plant 2) consisted of three generator unit with series and shunt FACTS devices. It was considered that a (L-L-L–G) 3-phase fault occurred at the bus-3 with UPFC in the case of 1; 3-phase fault occurred at bus-2 with SVC in the case of 2. The system was simulated in MATLAB and the performance of the UPFC for power system stability improvement was compared with SVC. It was cleared from the results that there was a considerable improvement in the system performance with the presence of UPFC in order to reducing the settling time (Satvinder Singh1, 2013).
In the study written by Ramlal Das and his friend in 2014, SVC was used for transient stability of the system consists of eleven buses with three power plants and each one generates 20 kV. When operating three different power plants in parallel by using MATLAB simulation, the transient oscillations disappeared in 0.03 seconds without SVC and in 0.01 seconds before used SVC (Ramlal Das, 2014).
Waheed A. and his friends studied effects of STATCOM on CCT of faults in multi-machine power systems during transient stability in 2014. The results showed that
STATCOM caused a phase shift to the machine rotor angle and bus voltage angle.
Therefore, with the increasing in complexity of the power system transmission network, there could be a possibility that the fault clearing time may be prolonged (Waheed A. Oyekanmi, 2014).
15
In a study written by Khoshnaw and Ercelebi in 2015, PSS and SVC are used to improve transient stability for the power supply system consisted of four machines with 6 buses. Testing a system with CCT, the results show that losing of system stability with using only PSS, when the SVC is connected to the system; it retained stability (Khoshnaw Khalid Hama, 2015).
In a study of N. Anil kumar, K. Ramesh in 2016, it was titled that PSS and SVC are used to improve the transient stability of the system power supply. The system consists of two machines with three buses. The MATLAB simulation program was used for simulation of the system. PSS and SVC are improved for machine oscillations and they inject reactive power into the system or receiving reactive power by the controller (Kumar, 2016).
At the studies done by Deepak Bhataniya, Rakesh Singh Lodhi, in February 2016, transient stability of two machine system with SVC was investigated. A power transmission system consists of two machines for 700 km line with SVC and without
SVC was studied. The system simulated by MATLAB software, at abnormal time (fault
condition). The results showed that the system could remain its stability with PSS and
SVC together and also the stability could not be maintained with PSS alone (Deepak
Bhataniya, 2016).
Mohammed Omar Benaissa*, Samir Hadjeri, Sid Ahmed Zidi, studied the impact of PSS and SVC on the power system transient stability in 2017. The system consists of two synchronous generators M1 (1000 MW), M2 (5000 MW) with 700 km transmission line. The system was tested with PSS and SVC and without SVC when in the system
L-G, L-L-L-G fault occurs. The results showed that with line to ground fault, the PSS
able to sustain the stability. However, using SVC, the angle deviation was reduced but when three phase fault occur, PSS are not able to maintain the stability without SVC. At the end, it has been cleared that the multiband type quickly damped oscillation than generic type (Mohammed Omar Benaissa*, 2017).
16 3. SYSTEM DESCRIPTION AND METHOD
3.1. System Description
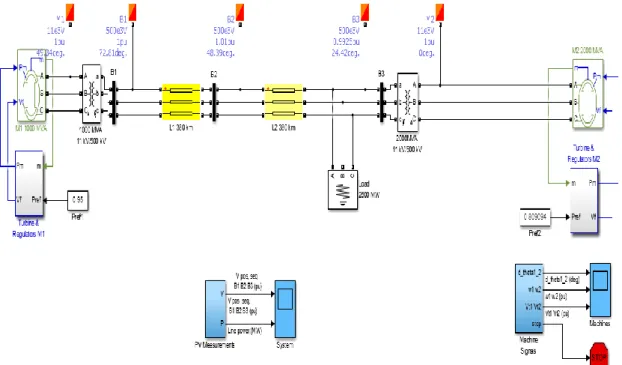
In this thesis, two interconnected machine has been used to study and analyse the transient stability performance of a multi-machine system. To do this, two hydraulic generation plants (1000 MW machine M1 and 2000 MW machine M2) were connected to the 2500 MW resistive load (load centre) via a 500 kV transmission line with 720 km in length. Furthermore, two step-up transformers (11 kV Delta to 500 kV Star) were used to connect each of the machines to the transmission line. The system was initialized so that the line carried 950 MW and this value was actually close to its surge impedance loading (SIL = 977 MW). Single line diagram of the system is shown in Figure 3.1.
Figure 3.1: Two machine transmission system
3.1.1. Swing equation
The relative position of the rotor axis and the resultant magnetic field axis is fixed under normal operation condition. The power angle or torque angle is the angle between the rotor axis and the synthetic magnetic field axis. During the disturbance, the rotor decelerates or accelerates with respect to the synchronously rotating air gap mmf, then the relative motion begins (Kundur, Balu, & Lauby, 1994) (Anderson & Fouad, 2002). Swing equation is an electromechanical equation that describes this relative motion as a function of time.
17
(i) Swing equation in terms of inertia constant is:
(3)
where;
δi: rotor angle of ith machine.
Pmi: mechanical power of ith machine.
Pei: electrical power of ith machine.
Mi: moment of inertia of ith machine.
(ii) Swing equation in terms of electrical power angle .
(4)
where,
P is the number of poles
For the studying stability analysis and perform simulation modelling of multi-machine system, all steps need to be taken are given in (Kundur, Balu, & Lauby, 1994) (Anderson & Fouad, 2002).
3.2. Method
3.2.1. Simulation model explanation
There are several computer programs and mathematical methods to be used, such as time domain simulations, direct, and artificial intelligence methods. MATLAB Simulink is used here as a powerful and effective methods for modelling and simulating a wide variety of dynamic systems and study the machines’ characteristics. MATLAB Simulink is very helpful and ease program to build our system and getting quicker
18
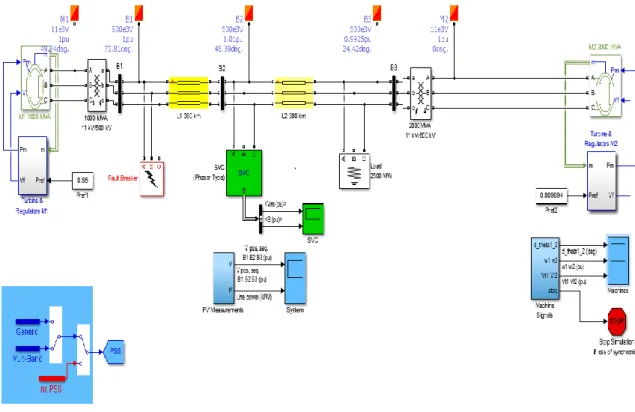
result. Use of Simulink is growing rapidly for research work in the area of power system and also in the other areas. Simulink is used for studying the effects of non-linearity of the system and thus is an ideal research tool. MATLAB provides simpower Systems library which is a very special library for power system design and stability assessment. In this thesis, two-machine transmission system 3-Bus system was modelled by using MATLAB/Simulink and transient stability analysis was assessed with different type of faults which were located at Bus1(See Fig 3.2).
Figure 3.2: Transient stability of a two machine system with PSS&SVC
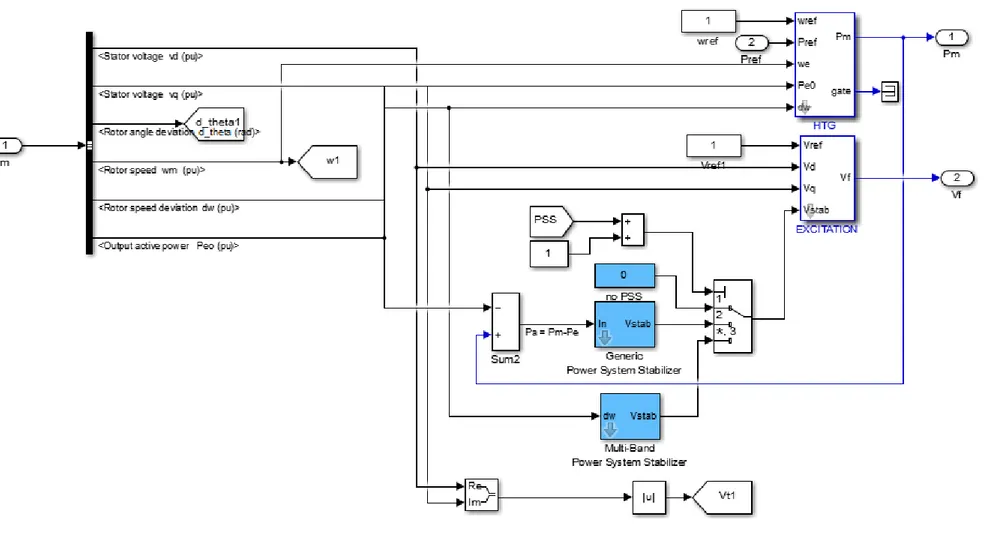
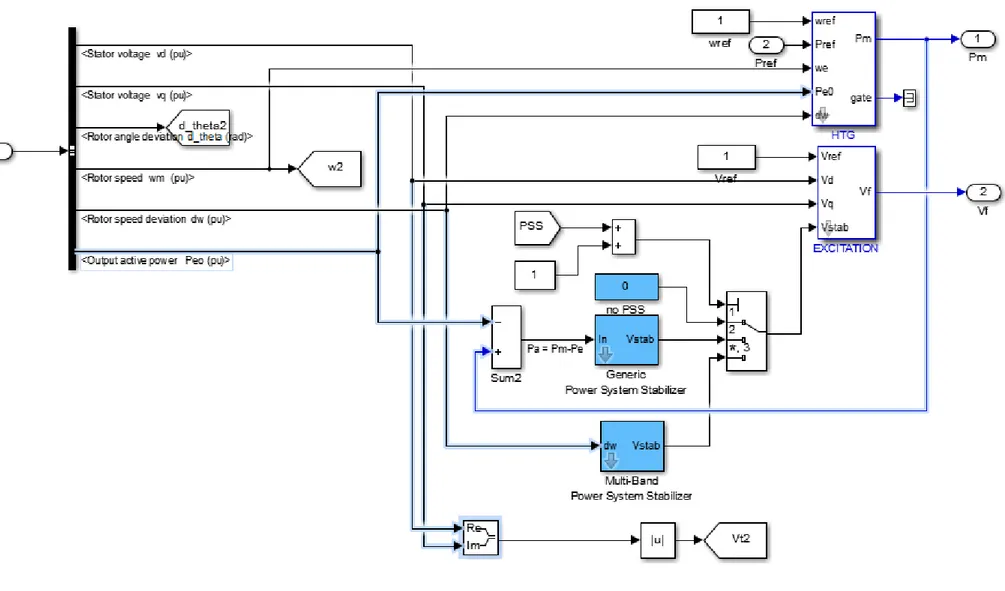
The schemes of turbine and regulators of M1 and M2 are given in Fig 3.3 and Fig 3.4. The PSS is known as a feedback controller and it is a part of the control system for a synchronous generator that provides an additional signal adding to the input summing point at the Automatic Voltage Regulator (AVR). By adding the stabilizing signal the PSS is expected to produce an electric torque component that counteracts the mechanical dynamics. The excitation control system provides the DC voltage for the field winding.
19
20
21 3.2.2. Simulation model
Simulation block diagram of a two-machine transmission system including two interconnected machines through transmission line was given in Figure 3.2. There is a power system stabilizer (PSS), hydraulic turbine and governor (HTG) and excitation system in each machine (Patel, Bhatti, & Kothari, 2002). Multi-band PSS was put in each machine as a controller to provide extra damping and improve the dynamic performance of the machine. Multi-band PSS was used because of its accuracy. Turbine&Regulator (TGM1&TGM2) for each machine was shown in Figure 3.2, includes 2000 MW for slag machine M1 and 1000 MW for the second machine. 720 km transmission line is used to connect both machines to 2500 MW resistive load. This system is used to transient stability assessment of an interconnected system, and it is also used to find out the effect of CCT on transient stability for different types of fault. In the final step of the simulation, a 200 MVAR shunt connected static VAR compensator (SVC), was connected to the transmission line, at B2, to increase transient stability performance of the system. A link between using SVC-voltage regulator on the transmission line and CCT for improving transient stability is achieved. It will be worthy to mention that this design was applied in [MATLAB-math work] by MATLAB investigator. The following notes need to be taken to understand the system design and simulation model blocks’ operation.
(i) PSS can be used to damp electromechanical oscillations by means increasing system stability when SVC can be used to improve transient performance and to increase CCT.
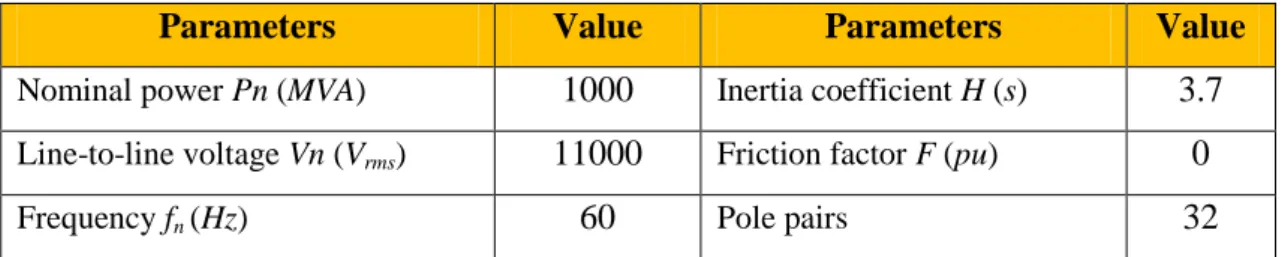
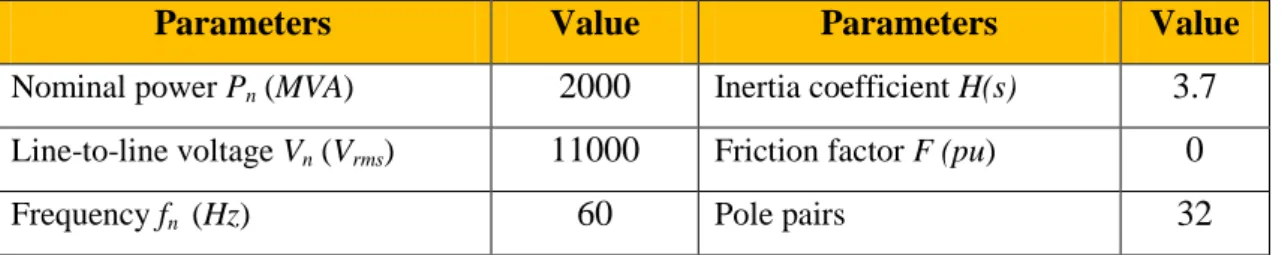
(ii) Machine M1 is set to be a ‘PV’ generator type to implement the generator controlling its output active power and voltage magnitude. Machine M2 was set to be a ‘swing’ generator type, so that this machine was used as a swing bus for balancing the power. The Machines’ parameters are given in the Table 3.1 and Table 3.2.
(iii) The reader would be able to understand how the Hydraulic Turbine and Governor (HTG), the excitation system and PSS are implemented by double clicking on each of the Regulator subsystems. This design is naturally not stable,
22
so power system stabilizer (PSS) was used to stabilize the system. Regulator subsystems IEEE-standard is already available on MATLAB for being used for different designs. SVC-voltage regulator also already exists on simpower system library in the form of icon that could be carried out by the investigator. (Vikhram & S.Latha, 2012) (Tailor, Bhalja, & Makawana, 2012).
(iv) In the Powergui block, 'phasor simulation' has been selected because it is much faster than the 'standard' detailed solution. In phasor solution method, a set of algebraic equations at a fixed frequency are used instead of the network differential equations, thus reducing the simulation time. This permits transient stability studies of interconnected systems.
(v) A load flow was performed on this system to find out steady state operation values. To start the simulation in steady-state, the machines and the regulators were already initialized in the Powergui block. Load flow has been performed according to the system specifications such that M1 is defined as a PV generation bus (P=950 MW, V=11000 V) and M2 is defined as a swing bus (V=11000 V, 0 degrees). 944 MW is carried by the transmission line which is just 33 MW less than to its surge impedance loading (SIL = 977 MW). Terminal voltages are defined by the Load Flow Bus block labelled in the system. After performing the load flow, the reference voltages and reference mechanical powers for both machines are automatically updated in the two constant blocks which are connected at excitation system and HTG inputs. Pref1=950 MW (0.95 pu), Vref1=1
pu; Pref2= 1852 MW (0.8091 pu), Vref2=1 pu.
(vi) In order to determine the CCT, simulations are performed with different FCT because repeating time-domain simulation is the only way to obtain CCT in the case of multi-machine power systems
Table 3.1: M1 parameters
Parameters Value Parameters Value
Nominal power Pn (MVA) 1000 Inertia coefficient H (s) 3.7 Line-to-line voltage Vn (Vrms) 11000 Friction factor F (pu) 0
23
Table 3.2: M2 parameters
Parameters Value Parameters Value
Nominal power Pn (MVA) 2000 Inertia coefficient H(s) 3.7
Line-to-line voltage Vn (Vrms) 11000 Friction factor F (pu) 0
Frequency fn (Hz) 60 Pole pairs 32
3.3. Employed Procedure
The idea of power stabilization means that the voltage control system should take the control decision based on the voltage error only if there is no rotor speed deviation in the system. However, if oscillations in the rotor speed appear, the voltage control system must produce a control signal based on the voltage error and on an additional signal from the PSS.
The PSS model that is used in this thesis for the theoretical PSS tuning analysis that uses rotor speed deviations as input signal is represented in Fig. 3.2. If other input signal is used with this structure, additional phase shift may require from the stabilizer. To conclude that the procedure that was needed to be followed is briefly explained in below:
(i) The design system was taken from the Mathwork and modified; parameters were changed in all blocks, and implemented according to our requirements. (ii) The system was run without fault, with PSS alone, with PSS & SVC together
and then obtained results were saved.
(iii) The system was run with (Line to Earth, Line to Line, Line to Line to Earth,
3Line, and 3Line to Earth) faults. The obtained results were saved and the CCT was determined for each case.
24 4. RESULTS AND DISCUSSIONS
4.1. Results
In this section the results of simulations of the transmission system when running with PSS & SVC and without PSS & SVC are investigated and commented. Different cases are investigated by using the presented method. In the first case given below, the system was run without PSS and SVC. In that case, the results showed that the system response was not stable and the oscillation was appeared on the lines. From these results it can be said that the system stability is degraded.
25
26
In the second case, the system was run with using PSS but without SVC on behalf of that there is no fault occurred in the system. The scheme of the system is given in Fig. 4.3. In this case, as it can be seen from the results given in Fig. 4.4 that the PSS can be able to damp out the oscillations occurred in the system when there is no fault in the system.
27
28
In the third case, the system was run without PSS and SVC when L-G fault occurred in the system. The scheme of the system is given in Fig. 4.5. In this case, as it can be seen from the results given in Fig. 4.6 that the system will lost its stability when a fault occurred in the system.
29
Figure (9) shows the system response when L-G fault with out PSS
30
In this case, the system was run with PSS and SVC when L-G fault occurred in
BUS1. The scheme of the system is given in Fig. 4.7. In that case, as it can be seen from
the results given in Fig. 4.8 that PSS could stable the system when fault time (FT) is less than 0.22. When FT is more than 0.22, the system will lose its stability and this mean that the CCT for this case is 0.22. And also when the SVC is connected to the system, the system could return to its stability conditions until fault time become equal to 0.28 s. and this mean that the CCT is equal to 0.28.
31
32
In this case, the system was run in two ways when L-L fault occurs in BUS1. In the first way, the system was run with PSS alone. In the second way, the system was run with PSS&SVC together. The scheme of the system is given in Fig. 4.9. From the Fig 4.10, it can be seen that PSS could stable the system when fault time (FT) is less than 0.18. When FT is more than 0.18, the system will lose its stability and this mean that the CCT for this case is 0.18. And also when the SVC is connected to the system, the system could return to its stability conditions until fault time become equal to 0.23 s. and this mean that the CCT is equal to 0.23.
33
34
In this step, the system was run in two ways when L-L-G fault occurs in the BUS1. In the first way, the system was run with PSS alone. In the second way, the system was run with PSS&SVC together. The scheme of the system is given in Fig. 4.11. From the Fig 4.12, it can be seen that the PSS could stable the system when fault time (FT) is less than 0.12. When FT is more than 0.12, the system will lose its stability and this mean that the CCT for this case is 0.12. And also when the SVC is connected to the system, the system could return to its stability conditions until fault time become equal to 0.14 s. and this mean that the CCT is equal to 0.14.
35
36
In this step, the system was run in two ways when L-L-L fault occurs in the BUS1. In the first way, the system was run with PSS alone. In the second way, the system was run with PSS&SVC together. The results of the system are given in Fig. 4.13. From the Fig 4.13, it can be seen that the PSS could stable the system when fault time (FT) is less than 0.09. When FT is more than 0.09, the system will lose its stability and this mean that the CCT for this case is 0.09. And also when the SVC is connected to the system, the system could return to its stability conditions until fault time become equal to 0.11 s. and this mean that the CCT is equal to 0.11.
37
In this step, the system was run in two ways when L-L-L-G fault occurs in the
BUS1. In the first way, the system was run with PSS alone. In the second way, the
system was run with PSS&SVC together. The results of the system are given in Fig. 4.14. From the Fig 4.14, it can be seen that the PSS could stable the system when fault time (FT) is less than 0.08. When FT is more than 0.08, the system will lose its stability and this mean that the CCT for this case is 0.08. And also when the SVC is connected to the system, the system could return to its stability conditions until FT become equal to 0.09 s. and this mean that the CCT is equal to 0.09.
38
The effect of SVC on the Critical Clearing Time (CCT) is given in Table 4.1.
Table 4.1: The effect of SVC on the critical clearing time (CCT)
Fault Critical Clearing Time with PSS Critical Clearing Time with PSS and SVC
L-G 0.22 0.28 L-L 0.18 0.23 L-L-G 0.11 0.13 L-L-L 0.08 0.10 L-L-L-G 0.08 0.09 4.2. Discussion
A power system is sometimes subjected to different faults at different locations. These faults may be caused by heavy rain, lightening or accidents, and these faults most probably cause instability for the system. This study is focused on the advantages of
PSS and SVC to improve the transient stability with the different type of faults. In this
case, the system tested without PSS and SVC and the results of which, are shown in the figures given above. The test procedure was done as at various fault types (G, L,
L-L-G, L-L-L, L-L-L-G) that were created at BUS1 in both with PSS and SVC and without
PSS and SVC conditions. These steps were repeated until the CCT values will be determined. In experimental analysis, the oscillations appeared in the system while the system was without PSS. In this case, the system got lost its stability. When connecting the PSS to the system, the testing results showed that the oscillations in the system get disappeared and then the system became more stable. In the third case, the system was run without PSS and SVC when LG failure occurred in the system. The results given in Figure 4.6 show that the stability of system get lost when a fault occurs in the system. When L-G fault occurred in the system and testing the system without PSS and SVC the stability of the system get lost. This instability of the system can be solved and can return to its stability only by connecting PSS to the system. In this case the CCT was determined as 0.22. When the system connected to the SVC, the CCT increased to 0.28. When L-L-L-G fault occurs in the BUS1, the system was run in two ways. In the first way, the system was run with PSS alone and in the second way; the system was run with
PSS&SVC together. The results of the system showed that the PSS could stable the
system when FT is less than 0.08. When FT is more than 0.08, the system will lose its stability and this mean that the CCT for this case is determined as 0.08. And also when
39
the SVC is added to the system, the system could return to its stability conditions until
FT become equal to 0.09 s. And this means that the CCT is equal to 0.09. For other
types of faults the system was tested and the CCT of all types of faults was determined as in the same way. This means that the fault types increases or decreases the CCT depends on the use of PSS alone or PSS&SVC together. In order to evaluate the system on behalf of the critical clearing time, it was found that the longest critical clearing time for the system was determined during L-G fault and the value of which was measured as 0.28 s. In contrast to this, the shortest CCT for the system was obtained during L-L-L-G fault and the value of which was measured as 0.08 s. This means that L-L-L-G fault is much more severe than the other remaining faults for the system. PSS enables both machines to run stable without SVC, but in various CCT on behalf of fault types. From the results mentioned above, the system regains its stability in the longer period of fault time with SVC&PSS when comparing to the system running with PSS alone. This can be inferred that SVC can be used to increase the CCT as well as can improve transient performance to reduce the protection system rates, too. In conclusion, it can be said that increasing the CCT is important for increasing the reliability of the protection system and its cost. The effect of L-L-L-G fault on the bus voltage and bus current is much more sensitive to be changed than that of L-G fault. The set values of protection relays and circuit breakers of the system need to be rearranged depend on CCT of symmetrical fault. It is a clear evident that the speed of M1 increases during the fault because the output power of M1 is lower than the input mechanical power of the M1 during the fault time period. When using PSS alone, in some cases the system cannot be stabilized. However, it is necessary to incorporate another type of controller such as a FACTS family connected to the transmission line of the system. By increasing the CCT it can keep the stability. In this thesis, the SVC was used as an active voltage controller to increase the CCT and to improve the system transient performance. The effect of Shunt connected static compensator for increasing CCT is shown in Table 4.1. It can be seen from the Table 4.1 that when connecting the SVC to the transmission line, the system could recover its stability in a longer failure period than comparing to the system running with only PSS. The vibration of the terminal voltage (Vt1) is reduced by using
SVC. The SVC is also caused to decrease the angle deviation. When the rotor angle
40
a good stability for the system. It is important to note that when this angle goes over 90 degrees for a long time, the generator will lose its synchronization and the system will deviate from the step. From the simulation results, it is cleared that if the costumer load increases up to the rate of generating, the system will also lose its stability. This means that the used load must be less than the generating power.
The distance of transmission line also affects the CCT and the stability of the system. The short distance caused better CCT when comparing to the long transmission interconnected system.
Paying attention to the system frequency, when the machine frequency decreased from 60 to 50 Hz, the CCT will increase and in contrast to this the vibration will decrease so this result a good stability for the system.
The simulation results show that the SVC controller provides superior transient stability than comparing to PSS. MB-PSS is superior to general PSS and it could stabilize the grid system which attenuates disturbance. And also, the MB-PSS signal can modulate the set point of the generator voltage regulator to improve the attenuation of the system. The MB-PSS can function in both local regions and regions of electromechanical vibration.
41 5. CONCLUSIONS AND RECOMMENDATIONS
5.1. Conclusions
This thesis presented the effects of SVC&PSS on improving the stability of Electrical Power System and finding the Critical Clearing Time for the electrical system of two machines in various types of fault conditions. In the study, the private effects of
PSS and its effects comparing with SVC on transient stability of the system consist of
two machines and three buses were simulated by using MATLAB. It was found that the
PSS and SVC could improve all different types of faults occur in the system and for each
type of fault, a different CCT was determined. It was concluded that when the system run without PSS, it couldn’t keep its stability. When comparing for CCT, it was found that the effect of using PSS&SVC together is more than using PSS alone in the system. The CCT for L-G fault was determined more than comparing with the other types of faults. When using PSS and SVC together in the system, the maximum fault time (MFT) of L-G fault could be cleared in 0.28 s time period. In the case of a L-G fault type, when using PSS alone in the system the MFT is determined as 0.22 s and on the other hand the maximum critical clearing time of the system was found as 0.08 s. In the case of
L-L-L-G fault type, when using PSS without SVC in the system, the maximum critical
clearing time of the system was found as 0.09 s. Finally, the presented system can be viewed as one subsystem of many subsystems in a large interconnected system configuration, so that the presented results can be used to evaluate the transient stability of such large interconnection systems, too.
5.2. Recommendations
The effects of SVC&PSS on improving the stability of an electrical power system were studied in this thesis. For the future work, the effect of high frequency harmonics occurring during the faults mentioned above can be taken into account to evaluate the stability of such electrical power system.
42 6. REFERENCES
Ajay Chaudhary1, R. A. (2012). A Comparative Analysis for Transient Stability
Improvement Using Power System Stabilizer andStatic VAR Compensator.
Kurukshetra: Impending Power Demand and Innovative Energy Paths - ISBN: 978-93-83083-84-8.
Ananthapadmanabha, T., Kulkarni, A., Kulkarni, A., Pradeep, H., & Chetan, S. (2010). Rotor angle stability analysis of a distributed generator connected to distribution network. Journal of Electrical and Electronics Engineering Research , 2(5), 107-113.
Anderson, G., Kundur, P., & & Vittal, V. (2004). Definition and classification of power system stability . Institute of Electrical and Electronics Engineers, Inc, 19(2), 1387-1401.
Anderson, P. M., & Fouad, A. A. (2002). Power system control and stability . Wiley-Interscience: New York.
Chang, W.-N., & Hsu, a. C.-H. (2011). Effects of Unbalanced Faults on Transient Stability of Cogeneration System. Proceedings of the 10th WSEAS international
conference on System science and simulation in engineering. Taoyuan.
Deepak Bhataniya1, R. S. (2016). Transient Stability of Two Machine System with Static Var Compensation. International Journal of Advanced Research in
Electrical,Electronics and Instrumentation EngineeringVol. 5, February 2016,
791,792,793,794.
Giang, T. T. (2013). Assessment of the Effectiveness of Two Coordinated Systems: SVC-PSS and STATCOM-PSS for Improving Transient Stability of Power System. International Journal of Computer and Electrical Engineering, Vol. 5,
No. 4, August 2013, 416,417,418,419.
Hashim, N., Hamzah, N., Latip, M. F., & Sallehhudin, A. A. (2012). Transient Stability Analysis of the IEEE 14-Bus Test System Using Dynamic Computation for Power Systems (DCPS). 2012 Third International Conference on Intelligent
Systems Modelling and Simulation. IEEE.
Kamdar, R., Kumar, M., & Agnihotri, G. (2014). Transient Stability Analysis and Enhancement of IEEE-9 Bus System. Electrical & Computer Engineering: An
International Journal (ECIJ) , 3(2), 41-50.
Kaur, D. T., & Kakran, a. S. (2012). Transient Stability Improvement of Long Transmission Line System by Using SVC. International Journal of Advanced
Research in Electrical, Electronics and Instrumentation Engg.(IJAREEIE), 1(4),
43
Khoshnaw Khalid Hama, E. E. (2015). Transient Stability Improvement in Multi-Machine System Using Power System Stabilizer (PSS) and Static Var Compensator (SVC). International Journal of Computer and Systems
Engineering, 1364.
Kimbark, E. W. (1995). Power System Stability. New York: John Wiley & Sons.
Kundur, P., Balu, N. J., & Lauby, M. G. (1994). Power system stability and control . USA: McGraw-Hill.
Machowski, J., Bialek, J. W., & Bumby, J. R. (1997). Power system dynamics and
stability. London: John Wiley & Sons Ltd.
Mohammadi, M. (2011). Voltage Stability Analysis with Static Var Compensator (SVC)
for Various Faults. Borujerd: Research Journal of Applied Sciences,
Engineering and Technology 3(7): 668-676, 2011.
Mohammed Omar Benaissa*, S. H. (2017). Impact of PSS and SVC on the Power System Transient Stability. Advances in Science, Technology and Engineering
Systems Journal Vol. 2, No. 3, 562-568 (2017), 563,564,565,566.
Mohit Yadav, S. C. (2012). Transient stability improvement of SMIB Power System
using Fuzzy Logic & P controlled braking resistor in MATLAB SIMULINK.
India: National Institute of Technology Kurukshetra.
N. Anil kumar, K. R. (2016). Transient stability improvement using svc and pss.
International Research Journal of Engineering and Technology (IRJET),
Bapatla.
Nallagalva, S., Kirar, M., & Agnihotri, G. (2012). Transient Stability Analysis of the IEEE 9-Bus Electric Power System. International Journal of Scientific
Engineering and Technology, 1(3), 161-166.
Oyekanmi, W. A., Radman, G., Babalola, A. A., & & Ajewole, T. O. (2014). Effects of STATCOM on the Critical Clearing Time of Faults in Multi-machine Power Systems during Transient Stability Analysis Studies. 2014 IEEE 6th
International Conference on Adaptive Science & Technology (ICAST), (pp. 1-6).
P. Kundur, N. J. (1994). Power system stability and control. New York: McGraw-Hill. Pal, S. (2012). A Power System Transient Stability Analysis And Improvement By
Facts Controllers. International Journal of Engineering Research & Technology
(IJERT).
Patel, R., Bhatti, T. S., & Kothari, D. P. (2002). MATLAB/Simulink-based transient stability analysis of a multimachine power system. International Journal of