Turkish Journal of Agriculture - Food Science and Technology
Available online, ISSN: 2148-127Xwww.agrifoodscience.com, Turkish Science and Technology
Determination of the Effect of Price Fluctuations on Producer Income –
the Case of Potatoes
Hasan Arısoy
*, Zeki Bayramoğlu
Department of Agricultural Economics, Faculty of Agriculture, Selcuk University, 42075 Selcuklu/Konya, Turkey
A R T I C L E I N F O A B S T R A C T
Research Article
Received 07 June 2017 Accepted 03 October 2017
Prices of agricultural products fluctuate depending upon several factors. In Turkey, potatoes are one of the main products for which price fluctuations are observed. This study was undertaken to determine the effect of the fluctuation in potato prices on producer incomes in Turkey. The Neyman Method was used to determine the sample size. The number of enterprises required to achieve a representative sample size was determined to be 56, with a 5% error margin and a 95% reliability limit. The way in which the potato cultivation area is affected by price was examined. The Koyck model was utilized for this purpose. By using Koyck analysis, average lag time was calculated to be approximately 1 year. This result indicates that the fluctuation in potato prices has quite a rapid effect on production. It was determined that producer income varies greatly depending on annual potato prices. The difference between estimated potato price and the actual price for the year 2012 resulted in an income loss of 11,198.6 $/ha. Some sustainable efforts such as production planning can be recommended to prevent these price fluctuations. Keywords: Price fluctuation Producer income Potato Koyck model Cobweb theory DOI: https://doi.org/10.24925/turjaf.v5i11.1342-1349.1356 Introduction
Price fluctuations observed in agricultural products constitute one of the most important aspects of the agricultural economy. Major changes in agricultural product prices from year to year affect product supply and producers' decisions about production (Cetin and Esengun, 2013).
In terms of agricultural product prices the effect of producers, and accordingly costs, are fairly limited in comparison with their effects in the industrial sector. Producers usually have to accept established prices as fact. This is because the price of an agricultural product for a given year is not determined by the costs incurred during that year, but by the total supply and demand for the product over the year. In addition, since the supply of agricultural products cannot be altered in the short term, demand is more determinative of price (Sarkar, 1992; Erdal and Erdal, 2008; Mulazzani and Camanzi, 2011; Ceyhan et al., 2012; Bor et al., 2014).
On the other hand, by its very nature, agricultural production is greatly affected by climatic conditions and the impact of pests and diseases, both of which lead to fluctuations in product supply. Accordingly, while prices are low in years with a high yield, in years where there is a low yield prices are much higher (Sarkar, 1992;
Caliskan et al., 2010). In addition to all of these factors, Turkish producers are unable to conduct proper production planning and establish effective marketing organizations due to their low level of education. Production is mostly undertaken in a traditional manner and the small scale of the enterprises involved also increases price uncertainties (Erdal and Erdal, 2008).
Fluctuations in agricultural product prices may be explained in several ways. First, there are the fluctuations that occur because agricultural production and yields are influenced by growing conditions. This results in lower prices in years with a high yield and higher prices in years with a low yield and is referred to as “King's Law”. The second type includes periodic price fluctuations that result from the supply of an agricultural product being the function of the market price for that product in the preceding year (Ezekiel, 1938). As one can see, various factors can result in price fluctuations for agricultural products. In times of high inflation these fluctuations can be more extreme. In such cases, it becomes harder for economic decision-making units to make healthy decisions and follow consistent policies (Ezekiel, 1938; Demirtas and Erkan, 2002; Andersen, 2013; Gouel, 2013).
*Corresponding Author:
1343 Plants that that are of high quality and have a high
yield per unit area (Ceyhan and Kahraman, 2013), have a high nutritional value (Kahraman et al., 2015), a wide range of uses, are easily digestible and cultivable under all kinds of climatic conditions (Ceyhan et al., 2013) constitute a global food source. Therefore, potatoes are produced and consumed in almost every country in the world (Gul and Tan, 2003; Tuncturk et al., 2007). The potato is an important agricultural product, particularly in developing countries, due to its ability to enhance farm income, increase food consumption and create employment in rural areas (Scott et al., 2000; Wang and Zhang, 2010). However, the stability of potato prices is a global problem (Bielza et al., 2007).
Potatoes are products that exhibit serious price fluctuations both in Turkey and among developing countries. The fluctuation of potato prices is in line with the cobweb theory. In other words, producers make production decisions based on prices from the previous year (Ezekiel, 1938; Dagdemir and Birinci, 1999; Birinci and Kucuk, 2006; Eraktan, 2011; Palabiyik, 2011; Rehber, 2012; Karsan and Gul, 2017). Many studies have been conducted on fluctuations in agricultural product prices. Different econometric models have been used in these studies to investigate the price fluctuation in agricultural products. For example, Yurdakul (1998), Bayaner et al. (1999), Dikmen (2005), Erdal (2006), Ozcelik and Ozer (2006) use the Koyck model, while Fidan ve Koc (2001) use a spatial equilibrium model. By contrast Marongiu (2005) uses a simultaneous equations econometric model, Pavlista and Feuz (2005) use a linear regression model, as does Ucak (2012), Sahinli and Ozcelik (2016) use an almon model, Ozer and Ilkdogan (2013) use box jenkins model. Some studies use a number of models, for example, Biscaro and Liviero (2012) use a combination of simultaneous equation model, multilayer perceptron model, the autoregressive integrated moving average model. Elloumi and Dhehibi (2012) use a double-logarithmic model, Garcia-Salazar et al. (2013) use a spatial and inter-temporal equilibrium model, Jiang and Wang (2013) use a dynamic correlation model. However, studies on the effects of price fluctuations on producer income are rather limited.
In the study area, the city of Nevsehir, potatoes are important in terms of production potential. For this reason, it is considered very important to examine the effect of potato price fluctuation on producer income.
The purpose of the present study is to describe the socio-economic structure of potato producers in the study area and to determine the effect of fluctuations in potato prices on producer income.
Potatoes are a very common product, cultivated in 156 countries around the world. According to 2012 data, a total of 368 million tons of potatoes were produced in an area totaling 19.3 million hectares. The average global potato yield is 19,066 kg/ha (FAOSTAT, 2013). According to 2012 data, Turkey's total potato cultivation area is 172,000 ha, producing 4.8 million tons and with a yield of 28,038 kg/ha (TSI, 2013). Turkey provides 1.3% of the world potato production. Although potato yield in
Turkey is above the world average, it is still lower than many European countries such as Germany and the Netherlands. Annual potato consumption in Turkey is 50 kg per capita. Despite the fact that this is above the world average of 33 kg per capita, it is much lower than the European average of 86 kg per capita (FAOSTAT, 2014).
Although potatoes were only introduced to Turkey 200 years ago, they are now cultivated by 200,000 farmers and in most areas of the country. However, commercial production is mainly focused on the cities of Nevsehir, Nigde and Izmir (Akinerdem and Ozturk, 2011). Nevsehir and Nigde account for 23% of the total production in the country (TSI, 2013). In 2012, the potato cultivation area in Nevsehir (the study area) was 9,325 hectares. This constitutes 5.4% of the total potato cultivation area in Turkey (TSI, 2013).
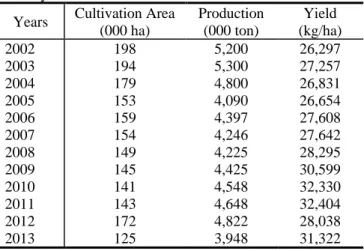
Turkey's potato cultivation area, production and yield figures from 2002 to 2013 are given in Table 1. Potato production decreased in 2012 and started to increase once again in 2013. The main reason for this fluctuation in production was the price instability experienced both internationally and at a domestic level.
Table 1 Potato cultivation area, production and yield in Turkey*
Years Cultivation Area (000 ha) Production (000 ton) Yield (kg/ha) 2002 198 5,200 26,297 2003 194 5,300 27,257 2004 179 4,800 26,831 2005 153 4,090 26,654 2006 159 4,397 27,608 2007 154 4,246 27,642 2008 149 4,225 28,295 2009 145 4,425 30,599 2010 141 4,548 32,330 2011 143 4,648 32,404 2012 172 4,822 28,038 2013 125 3,948 31,322 *TSI (2013)
Depending on the characteristics of the sector, agricultural markets usually feature competition that differs from that observed in other markets (Gouel, 2013). Agricultural production is carried out in small and medium scale enterprises where private ownership and individual enterprise are prevalent. In addition, it is known that agricultural prices are established in markets where free competition applies, production cannot be controlled and agricultural product prices are highly sensitive and variable (Ezekiel, 1938; Kip, 1975).
Agricultural product prices in Turkey are generally unstable. After 1987, however, agricultural product prices started to fall in real terms (Gul and Ozdes, 1997; Demirtas and Erkan, 2002).
Fluctuation in agricultural product prices is one of the factors that threatens economic stability (Azzam and Rettab, 2012). Price fluctuations do not only affect producers and consumers but they also compromise food safety (Gouel, 2013; Serra and Gil, 2013).
1344
Material and Methods
The primary data for the research (based on the year 2012) were obtained by questionnaire from a representative sample of farms in the region. Fertilizer, seed, pesticide, labor, fuel and other inputs for potato production, as well as selling prices were obtained using information from the survey. Using this data, the net profit (Gross Product Value - Production Cost), gross profit (Gross Product Value - Variable Cost), production cost, variable cost, and gross production value (production value × price) were calculated. Production cost is equal to the sum of the stable and variable costs. In addition to the data from the questionnaire, the results of previous studies and statistical data from different organizations were also utilized. Secondary data were obtained for the years 2002 - 2012 in relation to the use of cultivation areas, production quantity, yield, and potato price.
Data for the present study were obtained from the Taskinpasa, Sahinefendi, Mazi, Cemil, Ayvali, Sofular, Basdere and Yesiloz districts of Nevsehir city. The total population for the study comprised all agricultural enterprises operating in the areas where potato cultivation is carried out in these districts (a total of 2,254 enterprises). The Neyman method, alongside stratified sampling methods, was used to determine the sample size (Yamane, 1967).
With a 5% error margin and a 95% reliability limit, the number of enterprises required to achieve a representative sample of the population was determined to be 56. Enterprises were examined in three categories according to the size of their cultivation area (enterprises that own less than 5 hectares, between 5 and 10 hectares, and more than 10 hectares of cultivation area).
Projection analysis was carried out for the purpose of identifying the effect of the fluctuation in potato prices on producer incomes. Projection analysis was used to estimate future prices by using the Quadratic Trend Model. This model is formulated as follows:
Yt=b0+b1t1+b2t2 (1)
Where Y: price and t: time (Tari, 2002).
The relationship between the prices of agricultural products and the areas where the products are cultivated is dynamic, and the behavioral changes between these two variables need to be examined within a specific period of time. In order to examine the relationship, models where the lagged values of the independent variable are explanatory variables are utilized.
There are studies asserting that distributed lag models can be solved using the Least Squares Method (Alt, 1942; Tinbergen, 1949). However, the problem of multicollinearity between the lagged values of the independent variables is not taken into consideration. Some models have been developed to resolve these difficulties in distributed lag models (Koyck, 1954; Nervole, 1956; Cagan, 1956; Almon, 1965).
The aim of the present study was to examine the way in which the potato cultivation area is affected by prices. The Koyck model was utilized for this purpose. The Koyck model seeks to explain changes in the production of a product in terms of the lagged prices for that product (Koyck, 1954). This model is one of the most distributed lag models used in applied studies (Koutsoyiannis, 1989).
Initial model:
𝑌𝑡= 𝛼0+ 𝑏0𝑋𝑡+ 𝑏1𝑋𝑡−1+ 𝑏2𝑋𝑡−2+ ⋯ + 𝑢𝑡 (2)
Koyck's distributed lag model, presumes that lag coefficients decrease in line with a geometric progression. According to Koyck's geometric lag presumption, the value of explanatory variables in the period t-1 has a greater effect on the dependent variable than that in the period t-2 and later periods (Dikmen, 2005).
b1=λb0, b2=λ2 b0 , b3=λ3b0……bi=λib0 0 < λ < 1
Substituting these expressions into the initial model yields:
𝑌𝑡= 𝛼0+ 𝑏0𝑋𝑡+ (λ𝑏0)𝑋𝑡−1+ (λ2𝑏0)𝑋𝑡−2+ ⋯ + 𝑢𝑡 (3)
Regression analysis cannot be used in this model. Coefficients are non-linear. Therefore, Koyck developed the following model:
𝑌𝑡−1= 𝛼0+ 𝛽0𝑋𝑡−1+ 𝛽0λ𝑋𝑡−2+ 𝛽0λ2𝑋𝑡−3+ ⋯ + 𝑢𝑡−1 (4)
Multiplying (4) through by λ gives:
λY𝑡−1= λα0+ λ𝛽0𝑋𝑡−1+ 𝛽0λ2𝑋𝑡−2+ 𝛽0λ3𝑋𝑡−3+ ⋯ + 𝑢𝑡−1 (5)
Removing (5) from (3) gives this equation:
𝑌𝑡− λY𝑡−1= 𝛼0(1 − λ) + 𝛽0𝑋𝑡+ 𝑢𝑡− λ𝑢𝑡−1 (6)
Reorganizing this equation yields:
𝑌𝑡= 𝛼0(1 − λ) + 𝑏0𝑋𝑡+ λ𝑌𝑡−1+ 𝑢𝑡 (7)
In this way, the lagged values of the explanatory variable have been removed. In addition, the absence of the lagged values of the explanatory variable in the model also resolved the problem of multicollinearity. This equation (7) can be solved with the least squares method. By determining b0 and λ through this equation,
parameters of the Koyck model are determined with the use of equation number 8.
𝑏𝑘= 𝑏0λ𝑘 k= 0,1,2… 0 < λ < 1 (8)
In the Koyck model, parameters adhere to λ and b0. λ
gets a value between 0 and 1, which is bigger if the effect of lagged variables on the dependent variable is close to 1 and smaller if the effect is close to 0 towards the distant past (Dikmen, 2005). Average lag time (9), on the other hand, is calculated by using λ and explains the time
1345 needed for the changes in the independent variable to
have a perceivable effect on the dependent variable (Gujarati, 1999).
Average Lag = λ
1−λ (9)
Schwartz's criterion was used to determine the degree in the lags (Greene, 2003).
The Koyck model represents the relationship between price and production. In this model, production is a dependent (descriptor) variable and explains how it is affected by change in prices. Earlier related studies have used the dependent variable for production (Yurdakul, 1998; Bayaner et al., 1999; Dikmen, 2005; Erdal, 2006; Ozcelik and Ozer, 2006). Nevertheless, technological changes in the production of agricultural products have an effect on yield. Changes in production quantities may be affected by a combination of technology, price and public politics. Cultivation areas are specified as dependent (explained) variables so that the effect of price on production quantity, and also on producer decisions, can be observed. Hence, natural factors are normally uncontrolled, but factors that affect the yield can be partially controlled (Cinemre, 2002). Previous studies in related subjects have also reported similar results, and cultivation area was used as a dependent (explained) variable (Isyar, 1975; Kiziloglu, 1997).
Results
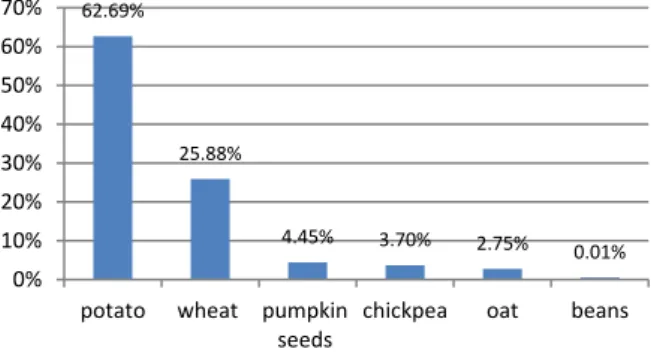
In the study area where potato cultivation is carried out intensively, average enterprise land size is 16.56 ha, which is much higher than the 6 ha Turkey average. Potatoes are cultivated on 62.69% of the total farmland for the enterprises studied, while 25.88% of the land is used for cultivating wheat, 4.45% for pumpkin seeds, 3.70% for chickpeas, 2.75% for oats and 0.53% for beans (Figure 1). Due to the prevalence of potato production by the enterprises studied, most of the farmland is irrigated. While 66.56% of the total farmland for the enterprises studied is irrigated land, 33.44% is used for dry farming. Products other than wheat and pumpkin seeds are mostly produced to meet the enterprises' own needs.
While 13% of potato production in Turkey is used to obtain seed, 16% is consumed by the enterprises producing it, 3% is used for feeding animals and the remaining 68% is supplied to the market (Palabiyik, 2011).
Producers in the study area obtain 92.45% of the gross production value (GPV) from vegetative production, while 7.55% is obtained from animal production activities.
Potatoes have the largest proportion (80.01%) of the total GPV for the enterprises examined in the study area. Potatoes are followed by wheat and pumpkin seeds with respective proportions of 17.24% and 2.06% (Figure 2).
2012 potato production data and profitability figures for the enterprises studied are given in Table 2. Potatoes constitute the most important source of income for these enterprises. For this reason, profitability calculations
made on the basis of potatoes are largely representative of the enterprises. Calculations showed that producer gross profit and net profit for 2012 were negative. This was mainly due to the fact that producers decided to increase supply on the basis of the previous year's prices which they considered to be satisfactory. The supply turned out to be higher than the available demand from the market and thereby led to reduced prices in 2012 (Table 1, Table 3).
Figure 1 Proportional distribution of the production pattern for the enterprises studied
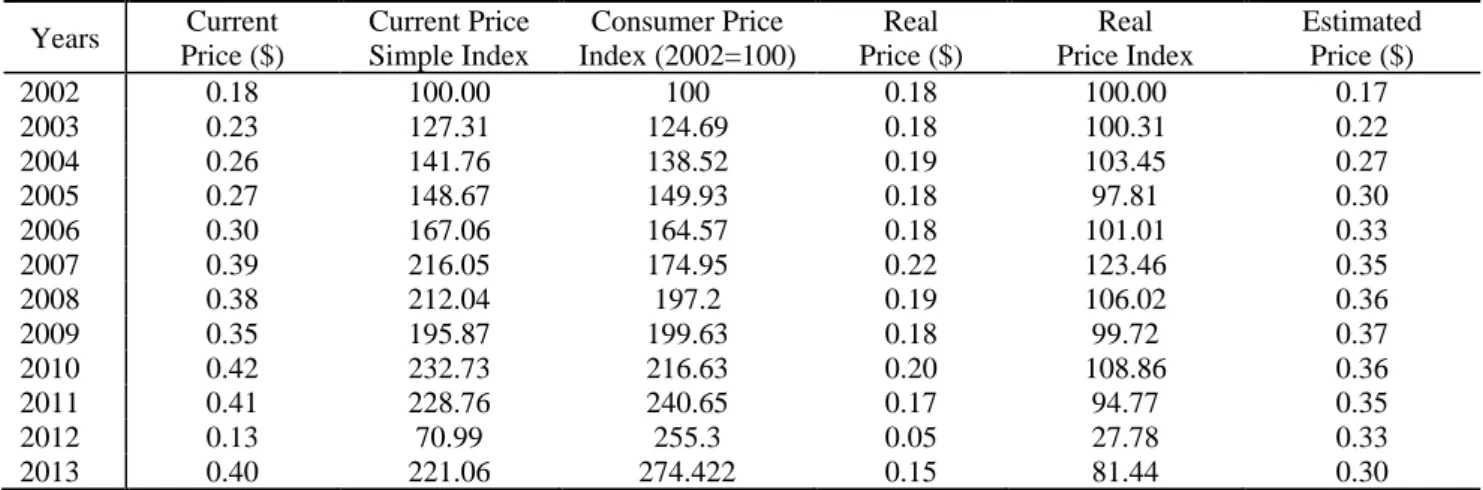
Figure 2 Proportion of total GPV for the products studied Fluctuations in potato prices in Turkey can be explained using the cobweb theory. From 2002 (the first year of the study period) until 2007, prices increased one year and decreased the next year. From 2007 to 2011 the prices increased. The main reason for this was the occurrence of potato wart disease in the Nigde - Nevsehir region. Prices increased in line with the decreasing supply caused by this disease. However, when the disease stopped affecting production, in 2012, supply increased once again and this led to a serious cut in prices. The income farmers obtained from potatoes decreased approximately 3 times in comparison to the previous year (Table 3, Figure 3). The real price index for potatoes was calculated by using the consumer prices index. A projection was made for the real price index, and an estimation was made for potato prices.
For the purposes of this study, the effect of potato price fluctuations on the producer income in the region was determined. The normal progression of prices was identified using projection analysis. In this case, the estimated potato price for the year 2012 was calculated to be 0.33 $ (Table 3). 62.69% 25.88% 4.45% 3.70% 2.75% 0.01% 0% 10% 20% 30% 40% 50% 60% 70%
potato wheat pumpkin seeds
chickpea oat beans
80.01% 17.24% 2.06% 0.36% 0.33% potato wheat pumpkin seeds chickpea beans
1346 Table 2 Potato production gross and net profits per unit area in Nevsehir ($)
Cost and income items Layers (ha)
0-5 5-10 10+ General Average
Potato yield (kg/ha) 37,479 40,416 43,783 43,071
Potato sales price ($/kg) 0.13 0.13 0.13 0.13
GPV ($/ha) 4,851.4 5,180.3 5,710.8 5,607.1
Variable costs ($/ha) 5,277.9 6,523.2 6,182.2 6,158.0
Production costs ($/ha) 6,040.2 7,322.8 6,971.6 6,946.7
Potato production cost ($/kg) 0.16 0.18 0.16 0.16
Gross profit ($/ha) -426.5 -1,342.8 -471.4 -551.0
Net profit ($/ha) -1,188.7 -2,142.4 -1,260.7 -1,339.6
Table 3 Potato prices
Years Current Price ($) Current Price Simple Index Consumer Price Index (2002=100) Real Price ($) Real Price Index Estimated Price ($) 2002 0.18 100.00 100 0.18 100.00 0.17 2003 0.23 127.31 124.69 0.18 100.31 0.22 2004 0.26 141.76 138.52 0.19 103.45 0.27 2005 0.27 148.67 149.93 0.18 97.81 0.30 2006 0.30 167.06 164.57 0.18 101.01 0.33 2007 0.39 216.05 174.95 0.22 123.46 0.35 2008 0.38 212.04 197.2 0.19 106.02 0.36 2009 0.35 195.87 199.63 0.18 99.72 0.37 2010 0.42 232.73 216.63 0.20 108.86 0.36 2011 0.41 228.76 240.65 0.17 94.77 0.35 2012 0.13 70.99 255.3 0.05 27.78 0.33 2013 0.40 221.06 274.422 0.15 81.44 0.30
Table 4 Estimated prices and potato production gross and net profits per unit area in Nevsehir ($)
Cost and income items Layers (ha)
($/ha) 0-5 5-10 10+ General Average
GPV 14,594.2 15,737.6 17,048.7 16,771.5
Variable costs 5,248.8 6,487.1 6,148.1 6,124.0
Production costs 6,006.8 7,282.3 6,933.0 6,908.3
Gross profit 9,345.4 9,250.5 10,900.7 10,647.6
Net profit 8,587.4 8,455.4 10,115.7 9,863.3
Figure 3 Change in potato prices (2002 - 2013)
0,18 0.18 0.19 0.18 0.18 0.22 0.19 0.18 0.20 0.17 0.05 0.15 0.18 0.23 0.26 0.27 0.30 0.39 0,38 0.35 0.42 0.41 0.13 0.40 0.17 0.22 0.27 0.30 0.33 0.35 0.36 0.37 0.36 0.35 0.33 0.30 0,00 0,05 0,10 0,15 0,20 0,25 0,30 0,35 0,40 0,45 2002 2003 2004 2005 2006 2007 2008 2009 2010 2011 2012 2013
1347 By using the projected 2012 potato prices obtained
from the projection analysis, the gross and net profit levels for the enterprises were calculated again (Table 4). It was determined that GPV increased by approximately 3 times. Accordingly, producers' Gross Profit and Net Profit were calculated to be 10,647.6 $/ha and 9,863.3 $/ha, respectively. It is understood that producer income varies greatly depending on annual fluctuations in potato prices. The difference between the estimated potato price and the actual price in 2012 was determined to have resulted in an income loss of 11,198.6 $/ha for producers.
Potato producers' income losses due to price fluctuations could be prevented with the use of production planning. Studies show that prices are more stable when proper production planning is carried out (Garcia-Salazar et al., 2013).
Koyck Model Results
Knowing the time needed for fluctuations in agricultural product prices to affect producer decisions is important in terms of planning and policy development. As a matter of fact, price variation for potatoes (in 2012) did affect producer decisions in the following production period (2013) and the cultivation area decreased. The Koyck model was used to analyze the effects of price on production quantity. There are many studies examining the effects of price fluctuations on production quantities. Altundag and Gunes (1991) examined the relationship between potato and onion production and prices using the cobweb model, and reported that the time taken for price fluctuations in onions and potatoes to effect producer decisions were 2.6 years and 3.3 years respectively. Ozcelik and Ozer (2006) studied the relationship between wheat prices and production in Turkey using the Koyck model. The authors determined the lag coefficient to be 3 and the average lag time to be 0.83 years. Dikmen (2005) on the other hand used tobacco data in a study which compared the Koyck and Almon models. While the lag coefficient in tobacco production was determined to be 3, the average lag time was reported as 0.67 years.
In the present study, the effects of potato price fluctuations on production were examined taking into account cultivation area. Results of the Koyck analysis undertaken are given below.
In order to estimate the Koyck model, lag coefficients for the independent variables have to be determined. In order to determine lag coefficient, Schwartz's criterion was used and the lag coefficient was calculated to be 1. PTQ = 121.614 – 146.988 PTPR + 0.514 PTQt-1 (10)
t (14.74) (23.66) (0.08) R2=0.80 F=25.409 Prob (F-statistic) = 0.000
The explanatory power of the Koyck model was 80% with a 1% significance level. Additionally, the effect of explanatory variables on the dependent variable was also statistically significant. Therefore, the PTPR - explanatory variable for potato prices and the PTQ - explanatory variable for potato production were also significant (P<0.01).
In the model estimated for Koyck, a lagged value for potato cultivation area was included in the model as an independent variable. According to the results obtained, the parameter of the lagged potato production variable was calculated to be 0.514, which is equal to the “λ” value used for obtaining the parameters of the Koyck model. This value is also used to determine the average lag time (ALT).
ALT= λ / (1- λ) = 0.514 / (1-0.514) = 1.06 years (11) Average lag time was calculated to be approximately 1 year. This value indicates that the fluctuation in potato prices has a rather rapid effect on production. As a matter of fact, in 2012, potato prices fell to 0.05 $ and in the following 2013 production period the potato cultivation area was reduced from 172,000 ha to 125,000 ha. In other words, the price reduction experienced in 2012 affected the total area cultivated in 2013. Products that have a low average lag time are generally produced in response to the market. In the face of changes in price, such products react in the short term through changes in cultivation area.
The Koyck model is calculated using the following equation:
PTQ=121.614 – 146.988 PTPR – 75.551 PTPRt-1 (12)
The coefficient of PTPR is calculated by the least square method and the number “10” shows the equity. The calculation of the PTPRt-1 coefficient is given below:
ßt = λ0b0 = 0.5140* 146.988 = 146.988
ßt-1 = λ01b0 = 0.5141* 146.988 = 75.551
In the Koyck model, the impact of lagged prices on production persists but with decreasing effect. The change in potato prices observed two years ago affects potato production in the current year less than the changes in prices in the previous year. This effect decreases as the lag number increases.
Discussion
The price of agricultural products is affected by several factors. In Turkey, potatoes exhibit a high level of price fluctuation compared to other agricultural products. The production area for potatoes is established on the basis of the previous year's prices and considerable differences are observed in the area under potato cultivation from year to year. This situation affects potato supply and leads to price fluctuations. By using the Koyck analysis in the present study, the average lag time was calculated to be approximately 1 year. This result indicates that the fluctuation in potato prices has a rather rapid effect on production.
It was determined that producer income varies depending on the annual fluctuation in potato prices. The difference between the estimated potato price and the actual price in 2012 led to a producer income loss of 11,198.6 $/ha.
1348 Conditions in Turkey mean that the long term storage
of potatoes is not feasible. In addition, potato processing and consumption habits for the products obtained from potato processing are not very widespread. Substantial proportions (91.08%) of potatoes are consumed as a final consumption commodity by households in Turkey (TSI, 2014). This consumption behavior and the storage characteristics of potatoes have led to a lack of demand, reflected in a rather rapid way by prices since demand is the determinative factor for establishing agricultural product prices.
It is essential to take steps that are focused on planning potato production in Turkey. Establishing producer unions should ensure that producers act in unison. In this way, producers may have a greater competitive advantage under free market conditions. Raising producers’ awareness about prices is another way to prevent price fluctuations.
All of the agricultural producers in Turkey receive government support in terms of production inputs such as fuel, fertilizer and certified seed. Providing this support via producer unions would facilitate production planning. Potatoes can be produced in almost every country in the world and they cannot be stored for long periods of time. Price fluctuations for potatoes can be stabilized by improvements in export opportunities.
References
Akinerdem F, Ozturk, O. 2011. Nisasta ve Seker Bitkileri. Selcuk Universitesi Ziraat Fakultesi Yayinlari, Sayfa. 1-43, Konya. Almon S. 1965. The Distributed Lag between Capital
Appropriations and Expenditures, Econometrica, vol: 30, pp: 96-178.
Alt F. 1942. Distributed Lags, Econometrica, Vol: 10, pp: 113-128. Altundag S, Günes T. 1991. Turkiye’de Patates ve Soganin Uretim
Miktarlari ile Fiyat İliskileri, TUBITAK Turk Tarim ve Orman Dergisi, 15, sf: 14-23.
Andersen PP. 2013. Contemporary Food Policy Challenges and Opportunities. Australian Journal of Agricultural and Resource Economics, 58, pp. 504–518.
Azzam A, Rettab B. 2012. A Welfare Measure of Consumer Vulnerability to Rising Food Prices of Food Imports in the UAE. Food Policy, 5: 554–560.
Bayaner A, Ege H, Uzunlu V. 1999. Konya Ilinde Bugday ve Arpanin Arz Duyarliligi, Orta Anadolu Hububat Tariminin Sorunlari ve Cozum Yollari Sempozyumu, sf: 741-744, Konya. Bielza M, Garrido A, Sumpsi JM. 2007. Finding Optimal Price Risk
Management Instruments: The Case of the Spanish Potato Sector. Agricultural Economics 36 (2007) 67–78.
Birinci A, Kucuk N. 2006. Erzurum Ili Tarim Isletmelerinde Patates Uretim Maliyetinin Hesaplanmasi. Tarim Ekonomisi Dergisi 12(2): 31 – 37, 2006.
Biscaro Q, Liviero A. 2012. A price analysis and management model for Adriatic Small Pelagic fish (anchovies and pilchards). NEW MEDIT N. 1/2012.
Bor O, Ismihan M, Bayaner A. 2014. Asymmetry in farm-retail price transmission in the Turkish fluid milk market. NEW MEDIT N. 2/2014.
Cagan P. 1956. The Monetry Dynamics of Hyper Inflations. Chicago Universty Pres.
Caliskan ME, Onaran H, Arioglu H. 2010. Overview of the Turkish Potato Sector: Challenges, Achievements and Expectations. Potato Research (2010) 53:255–266, DOI 10.1007/s11540-010-9170-1, EAPR 2010
Cetin I, Esengün K. 2013. Amasya Ilinde Yaygin Olarak Yetistirilen Urunlerde Verim ve Fiyat Riski. KMÜ Sosyal ve Ekonomi̇k Arastirmalar Dergi̇si 15 (25): 57-65, Karaman.
Ceyhan E, Harmankaya M, Kahraman A. 2014. Combining ability and heterosis for concentration of mineral elements and protein in common bean (Phaseolus vulgaris L.). Turkish Journal of Agriculture and Forestry, Vol. 38, pp: 581-590.
Ceyhan E, Kahraman A. 2013. Genetic analysis of yield and some characters in peas. Legume Research, 36 (4): 273-279. Ceyhan E, Kahraman A, Ates MK, Karadas S. 2012. Stability
analysis on seed yield and its componens in pea. Bulg. J. Agric. Sci., Vol. 18, pp: 887-893.
Cinemre HA. 2002. Tarim Ekonomisi, Ondokuz Mayis Universitesi Ziraat Fakultesi Ders Kitabi, and No: 11, sf: 171, Samsun. Dagdemir V, Birinci A. 1999. Turkiye'de Patates Pazarlamasi ve
Fiyat Dalgalanmalarinin Uretim Uzerine Etkisi. II.Ulusal Patates Kongresi, Kongre Kitabi, Ataturk Univ. Ziraat Fak., Erzurum.
Demirtas B, Erkan O. 2002. Mersin Ilinde 1988-1997 Donemi Domates Fiyatlari Analizi. Alata Bahçe Kulturleri Arastirma Enstitusu Dergisi, Alatarim, Cilt:1, Sayi:2, Mersin.
Dikmen N. 2005. Koyck – Almon Yaklasimi Ile Tutun Uretimi ve Fiyat Iliskisi, VII. Ulusal Ekonometri ve Istatistik Sempozyumu, Istanbul.
Elloumi M, Dhehibi B. 2012. Agricultural policy and poverty in Tunisian rural areas: anempirical analysis using agricultural prices and investment. NEW MEDIT N. 4/2012
Eraktan SN. 2011. Ekonomi. Ankara Universitesi Ziraat Fakultesi Tarim Ekonomisi Bolumu, Yayin No: 1512, Ders Kitabi: 465, 3.Baski, Ankara.
Erdal G. 2006. Tarimsal Urunlerde Uretim Fiyat Iliskisinin Koyck Yaklasimi ile Analizi, Gaziosmanpasa Universitesi Ziraat Fakultesi Dergisi, 23(2), sf:17-14, Tokat
Erdal G, Erdal H. 2008. Kuru Soganda Uretim - Fiyat Etkilesimi. GOU Ziraat Fakultesi Dergisi, 25 (1): 33-39, 2008, Tokat. Ezekiel M. 2013. The Cobweb Theorem. The Quarterly Journal of
Economics, Vol. 52, No. 2 (Feb., 1938), pp. 255-280, Oxford University Press, Stable URL: http://www.jstor.org/stable/ 1881734, Accessed: 07/05/2012.
FAOSTAT. 2013. Food and Agriculture Organization of the United Nations. http://faostat.fao.org/site/567/DesktopDefault.aspx? PageID=567#ancor Accessed: 20.09.2013
FAOSTAT. 2014. Food and Agriculture Organization of the United Nations. http://faostat3.fao.org/faostat-gateway/go/to/download/ FB/FB/E Accessed 10.03.2014.
Fidan H, Koc H. 2001. Dynamic Behavior of Onion Prices in Turkey. Turk J Agric For 25 (2001) 195-200.
Garcia-Salazar JA, Skaggs RK, Crawford TL. 2013. Excess Supply and Price Volatility in the Mexican Potato Market: A Decision Making Framework. Am. J. Potato Res. DOI 10.1007/s12230-013-9349-5.
Gouel C. 2013. Optimal Food Price Stabilisation Policy. European Economic Review 57(2013)118–134
Gujarati DN. 1999. Temel Ekonometri (Cevirenler: Umit Senesen, Gulay Gunluk Senesen), Literatur Yayincilik, Istanbul. Gul A, Ozdes A. 1997. Tarim Urunleri Fiyatlarinda Istikrarsizlik,
Cukurova Universitesi Z. F. Dergisi. 12(2):191-200. Adana. Gul U, Tan S. 2003. Patates. Tarimsal Ekonomi Arastirma
Enstitusu-Bakis, Sayi:2, Nusha:8, Mart 2003, Ankara.
Isyar Y. 1975. Kuzeydogu Anadolu Bolgesinde Onemli Tarla Urunlerinin Ekim Alani Arz Duyarliliklari - Ekonometrik Bir Yaklasim, Ataturk Universitesi Ziraat Fakultesi Arastirma Serisi, No: 131, Erzurum.
Jiang Y, Wang Y. 2013. Is China’s Domestic Agricultural Market Influenced by Price Fluctuations of the World Agricultural Commodities in the Short-run? AGRIC. ECON. CZECH, 59, 2013 (12): 578–589.
Kahraman A, Harmankaya M, Ceyhan E. 2015. Nutritional variation and drought tolerance in chickpeas (Cicer arietinum L.). Journa of Elementology, Vol: 19, DOI: 10.5601/jelem.
1349
Karsan A, Gul M. 2017. Patates Üretim Maliyetleri ve Karliliğindaki Değişim: Niğde İli Örneği. Turkish Journal of Agriculture - Food Science And Technology, 5(5): 530-535, 2017.
Kip E. 1975. Fiyat Yonunden Tarimsal Uretiminin Ozellikleri Tarimsal Urunlerde Destekleme Fiyat Politikasi. Turkiye Zirai Ekonomi Dernegi Yay., No: 4 Ankara.
Kiziloglu S. 1997. Erzurum Ilinde Bugday, Arpa, Patates, Aycicegi, Sekerpancari ve Figin Uretim Maliyeti ve Arz Fonksiyonlarinin Ekonometrik Yonden Belirlenmesi, TUBITAK Turk Tarim ve Orman Dergisi , 21(3): 225-235.
Koutsoyiannis A. 1989. Ekonometri Kurami. (Cevirenler: Umit Senesen, Gulay Gunluk Senesen), VersoYayincilik, Ankara. Koyck LM. 1954. Distributed Lags and Investment Analysis. North
Holland Puplishing Company, Amsterdam, pp: 21-50.
Marongiu S. 2005. An econometric analysis to evaluate hazelnut price formation on the international hazelnut market. NEW MEDIT N. 4/2005.
Mulazzani L, Camanzi L. 2011. Price-quantity relations and choice of the geographical market size in Italian fresh seafood products. NEW MEDIT N. 1/2011.
Nervole M. 1956. Estimate of Elasticities of supply of Selected Agricultural Commodities, Journal of Farm Economics 38(2): 496-512.
Ozcelik A, Ozer OO. 2006. Koyck Modeli ile Turkiye’de Bugday Uretimi ve Fiyat Iliskisinin Analizi, Ankara Universitesi Ziraat Fakultesi Tarim Bilimleri Dergisi, 12(4): 333-339, Ankara. Özer OO, Ilkdoğan U. 2013. Box-Jenkins Modeli Yardimiyla
Dünya Pamuk Fiyatinin Tahmini. JOTAF/Tekirdağ Ziraat Fakültesi Dergisi 10.2 (2013): 13-20.
Palabiyik M. 2011. Patates. Hasad, Aylik Tarim Dergisi, Sayi: 309, Sayfa: 58-64.
Pavlista AD, Feuz DM. 2005. Potato Prices as Affected by Demand and Yearly Production. Short Communication, Amer J of Potato Res 82:339-343, University of Nebraska Cooperative Extension Division, Journal Series #1026.
Rehber E. 2012. Temel Ekonomi. Ekin Yayinevi, Bursa.
Sahinli MA, Özçelik A. 2016. Findik Arz Fonksiyonu Tahmin Modeli: Türkiye Üzerine Ekonometrik Bir Uygulama. Nevşehir Bilim ve Teknoloji Dergisi (2016): 79-88.
Sarkar A. 1992. On the Formation of Agricultural Prices. Journal of development economics 0304-3878/93/$06.00 0 1993-Elsevier Science Publishers B.V. All rights reserved, 41 (1993) 1-17. North-Holland.
Scott GJ, Rosegrant MW, Ringler C. 2000. Global projections for root and tuber crops to the year 2020. Food Policy 25: 561–597. Serra T, Gil JM. 2013. Price Volatility in Food Markets: Can Stock Building Mitigate Price Fluctuations? European Review of Agricultural Economics Vol 40 (3) pp. 507–528
Tari R. 2002. Ekonometri, Alfa Basim Yayin Dagitim Ltd. Sti, ISBN: 975-316-264-2 sf:381, Istanbul.
Tinbergen J. 1949. Long-Term Foreign Trade Elasticities, Macroeconomica, vol:1, pp:174-185.
TSI. 2013. Turkish Statistical Instute. Statistical data, http://tuikapp.tuik.gov.tr/Bolgesel/sorguSayfa.do Accessed: 16.09.2013
Tuncturk M, Sahin K, Eryigit T. 2007. Van Ili Ercis Ilcesinde Patates Yetistiriciliginin Durumu Uzerine Bir Arastirma. Selcuk Universitesi Ziraat Fakultesi Dergisi 21 (42): 49-54.
Ucak H. 2012. Producer Price Disparities in the EU Agriculture: Divergence or Convergence? Agric. Econ. Czech, 58, 2012 (8): 367–371
Wang Q, Zhang W. 2010. An Economic Analysis of Potato Demand in China. Am. J. Pot Res, 87:245–252.
Yamane T. 1967. Elementary Sampling Theory Prentice-Inc. Englewood Cliffs. N.S. USA.
Yurdakul F. 1998. Pamuk Uretimi ile Pamuk Fiyatlari Arasindaki Iliskinin Ekonometrik Analizi: Koyck – Almon Yaklasimi, Cukurova Universitesi Iktisadi ve Idari Bilimler Fakultesi Dergisi, 8(1), Adana.