Informal Employment Decreased in the Last Eight Years
Seyfettin Gürsel, Mine Durmaz**
Executive Summary
During the period of 2005-2013, informal employment declined significantly. Overall informality rate decreased from 48.2 percent to 36.8 percent and informality in non-agricultural sectors fell from 34.3 percent to 22.4 percent. The main force behind this improvement is the decline in informality among wage earners. However, the decrease of informality rate for self-employed workers is limited. Hence, the problem of informality in Turkish labor market requires studying these two categories of employment separately. The main reason for the decline in informality among wage earners is that newly created jobs in recent years are mostly formal jobs. Informal employment is substantially a consequence of social and structural features of labor force. In addition, the level of informal employment is affected by economic conjecture. According to seasonally adjusted monthly data over last eight years, overall informality rate followed a fluctuating trend. In next research brief, trend in the rate of informality over time will be discussed.
The main structural features studied in this research brief point out that the problem of wage earners' informality is associated with the problem of small size of the firms. According to 2013 data, third-fourth of informal wage earners is employed in micro firms (0-9 workers). When informal employment in SMS's (10-24 workers) is added to this share, it reaches 85 percent. Findings of this study reveal that policies aimed at reducing structural informality in the employment category of wage earners need to prioritize reducing out-of-labor costs, encouraging firms in size enlargement, and increasing frequency of inspection.
Scope of the study
In this research brief informal employment (workers unregistered with social security system) in Turkish labor market will be investigated. The research consists of three papers that will be published consecutively. In this (first) research brief, using TurkStat 2005 and 2013 Household Labor Survey (HLS) micro data we analyze overall trend for informality and its structural features disaggregated by employment status, gender, age, sectors and firm size. Furthermore, based on the findings of this study we try to state main factors behind this remarkable improvement recorded in last eight years (from 2005 to 2013).
Prof. Dr. Seyfettin Gürsel, Betam, Director, [email protected]
****Mine Durmaz, Betam, Research Assistant [email protected]
29 August 2014
Regional disparities in terms of informal employment are left to be discussed in the second paper. In addition, in the last (third) paper the trends for labor informality and its relationship between economic conjecture and structural features will be examined by using monthly HLS statistics.
Significant decrease in informality among wage earners
During the period of 2005-2013, the share of informal employees in total employment fell from 48.2 percent to 36.8 percent (Table 1). During the same period total employment increased by 27 percent and it reached approximately 25 million in 2013. Moreover, the number of informal workers is recorded as 9.4 million in 2013, decreasing by 290 thousand compared to that in 2005. This fact implies that the increase in the size of newly created formal jobs constitutes a major part of total employment expansion during the period of 2005-2013. Indeed, during the period under study formal employment is increased by 5.7 million (Table 1).
On the other hand, note that 93 percent of the increase in formal employment is observed in non-agricultural sectors (manufacturing, services, and construction). The rate of informality in agriculture, which has 23 percent share in total employment, is still quite high (84 percent). The share of informal workers in non-agricultural sectors declined from 34.3 percent in 2005 to 22.5 percent in 2013. In 2005, the number of informal employees in non-agricultural sectors was 5.1 million, decreasing to 4.4 million in 2013 (Table 1). This fact indicates that improvements in terms of informality in non-agricultural sectors are drivers of overall decrease in informality. Although this progress refers to an important success in fighting with informal employment, there remains a hard work since 23 out of every 100 workers employed in non-agricultural sectors are still working informally.
When informal employment is split by employment status between 2005 and 2013, we observe decreases in rates of informality in all employment categories. However, this improvement is not equally distributed across these categories. While in the category of regular or causal employees (wage earners hereafter), which constitute two-third of total employment, the rate of informality declined from 32 percent to 19.9 percent (outside agriculture from 29.8 percent to 17.7 percent), this ratio decreased only from 64.6 percent to 62.5 percent for self-employed workers. On the other hand, the number of informal wage earners declined by 400 thousand and the decrease in the number of informal self-employed workers is limited to 46 thousand. Also, in the category of unpaid family workers, the majority of which are women working in the sector of agriculture, the rate of informality slightly decreased (from 94.9 percent to 91.9 percent) and the number of informal employees expanded by 260 thousand.
90 percent of agriculture employees consist of self-employed farmers and their unpaid family members. It should not be assumed that this unequal improvement in informality is due to this structural feature of the agriculture. Indeed, similar unequal improvements in informality among wage earners and self-employed workers are observed when nonagricultural data is considered. In the last eight years non-agricultural employment increased by 4.6 million while number of informal workers decreased by 750 thousands. However, during the same period the numbers of self-employed workers in non-agricultural sectors declined by 187 thousand while the number of informal workers decreased by 98 thousand. Therefore, in this employment category the rate of informality remained constant around 51 percent (Table 1).
Table 1: Informal employment by employment status (total and non-agricultural employment) TOTAL EMPLOYMENT Employment status 2005 2013 Employment (in thousands) Informal employment (in thousands) Informality ratio (%) Employment (in thousands) Informal employment (in thousands) Informality ratio (%) Regular or causal employees 11435 3658 32.0 16353 3258 19.9 Employers 1101 282 25.6 1182 181 15.4 Self-employed workers 4689 3031 64.6 4773 2985 62.5
Unpaid family workers 2841 2695 94.9 3217 2955 91.9
Total 20066 9666 48.2 25524 9379 36.8 NON-AGRICULTURAL EMPLOYMENT Employment status 2005 2013 Employment (in thousands) Informal employment (in thousands) Informality ratio (%) Employment (in thousands) Informal employment (in thousands) Informality ratio (%) Regular or causal employees 11009 3285 29.8 15762 2788 17.7 Employers 1011 217 21.4 1108 140 12.7 Self-employedworkers 2408 1229 51.0 2221 1131 50.9
Unpaid family workers 484 388 80.1 418 310 74.3
Total 14912 5119 34.3 19508 4369 22.4
Source: TurkStat, 2005 and 2013 Household Labor Survey micro dataset; BETAM
This unequal improvement in informality evidently shows that different anti-informality strategies should be followed to reduce informality among earners and self-employed workers. For wage-earners, informal working is mostly the decision of employer. In other words, informal working is usually involuntarily situation faced by wage-earners. As we discuss in detail later, how informal employment decreases hereafter and which policies can accelerate this decrease critically depends on efficiency of government inspection as well as interferences between wage cost, social security premium contribution and firm productivity.
On the other hand, decision of informal working is a voluntarily decision for the self-employed workers. This decision can be considered as a rational optimization problem. The decision whether to register with social security institution (SGK) or not depend on the factors such as social security premium level, expected income and to what extend government will provide public health services for individuals unregistered with social security institution or expectations about family support once the individual gets incapable of working.
The main structural factors behind the decrease in informality recorded during the period of 2005-2013 might be social security premium incentives introduced in order to reduce labor costs, increased frequency of inspection, firm size enlargement and increase in the average education level of employees as well as increased shares of manufacturing and services in total employment in which informality is relatively low.
Informality is relatively high among female workers
When we dissect the informality to gender component, we observe that informal working is more widespread among women compared to men. In 2013, the rate of informality is 52 percent for women and 30.2 percent for men (A. Table 3). On the other hand, a different picture comes out when we examine this gender gap by sector, education level and employment status.
We know that one-third of female workers (2 million 826 thousand out of 7 million 641 thousand) are employed in the sector of agriculture where the rate of informality is soaring to 96 percent. On the other hand, the share of agriculture male workers in total employment is quite low with 18 percent. This asymmetry is one of the factors behind discrepancy in terms of informal employment between males and females. When we focus on the sectors outside the agriculture, gender difference in informality is smaller but still exists. Indeed, non-agricultural rate of informality is recorded as 26 percent for female and 21.4 percent for male wage-earners. In 2005, these ratios were 36 percent and 33.9 percent respectively. The numbers show that although male informality is more rapidly decreasing compared to that for females, the difference is quite limited (A. Table 1 and A. Table 2). The gender difference in the rate of informality is 4.6 percentage points in 2013. More prevalent informal working among self-employed females explains a part of this difference. Female rate of informality in this employment category is 81.6 percent while limited to 43.9 percent among males. At the same time, self-employed females in non-agricultural sectors are unskilled with less than high school education, for which the rate of informality is 88.7 percent. On the contrary, this ratio is 35.7 percent for females with more than high school education (Figure 1). However, the share of university graduates in total self-employed females is only 7.7 percent (A. Table 1). Hence, a part of 4.6 percentage point gender difference is explained by low education level of female self-employed workers. These findings point out that there is hand-in-hand relationship between self-employment and informal employment and a clear reverse relationship between education level and informality. Figure 1: Informality rates for male and female workers by employment status (2013, non-agricultural)
Source: TurkStat, 2013 Household Labor Survey micro dataset; BETAM
A large proportion of 4 million 815 thousand women working in nonagricultural sectors (85 percent) are wage earner. A large part of the informality gender gap arises from the wage earners. In 2013, informality rate recorded as 18.5 percent for female wage earners and 17.4 percent for male wage earners. The former was 29 percent and the latter was 30.1 percent in the year of 2005. The differences in rates of informality are limited but changes in informal employment are quite different. In 2005, the number of female wage earner employment was 670 thousand, increasing by 87 thousand; it reached 757 thousand in 2013. The factor behind this large decline in female rate of informality is that approximately 1.8 million female wage earners, newly entered into employment in last eight years, are employed in formal jobs. On the other hand, while the employment of nonagricultural male wage-earners increased by 3 million in last eight years, the number of informal wage earners decreased by 584 thousand (A. Table 2).
These advances imply that improvements in informality for males are more prominent than for females. Although a more detailed study is required to determine the reasons behind this gender difference, when we make a comparison with respect to education levels, we observe that education level (hence, wage level and workplace characteristics) is an important one among them. In 2013, the informality rate for less than high school educated female wage earners is remarkably above that for males (40.1 percent and 27.3 percent respectively). This difference substantially decreases for high school graduates (12.2 percent for females and 10.3 for males). However, in the category of university graduates (or more than high school) female informality rates are lower compared to that for males (2.3 percent for females and 2.9 percent for males) (Figure 1). We think that one of the reasons for this difference in favor of females is that majority of working retirees are male and most of them, who are usually highly educated, are working informally. (see Betam Research Brief 157)1
Lower informality in manufacturing and services sectors
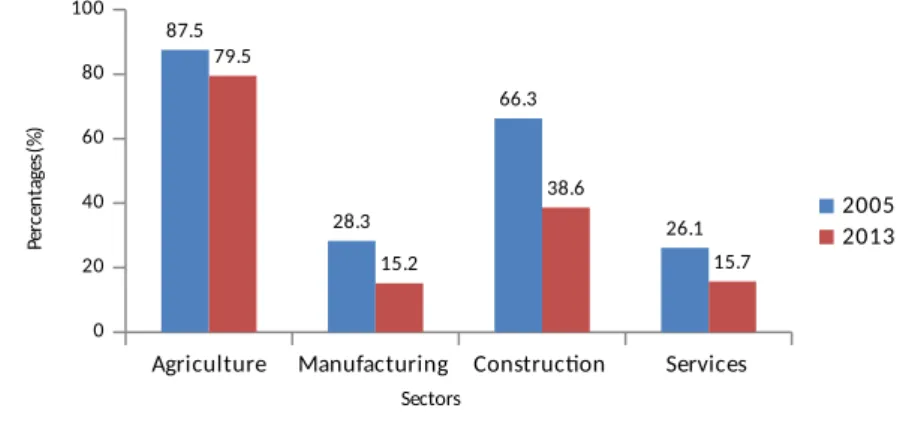
Informality decreased in all sectors but at different extents. Informality rate for wage earners in agriculture sector is quite high with 79.5 percent. This ratio decreased slightly in last eight years (87.5 percent in 2005) (Figure 2). Seasonal employment could be one of the reasons for widespread informality among wage earners in agriculture. Other potential reasons should be small size of agricultural enterprises that employ wage earners and their low productivity levels, unskilled labor force in agriculture and difficulties in inspections.
Figure 2: Wage-earner informality by sectors (total employment)
Agriculture Manufacturing Construction Services
0 20 40 60 80 100 87.5 28.3 66.3 26.1 79.5 15.2 38.6 15.7 2005 2013 Sectors Pe rc en ta ge s( % )
Source: TurkStat, 2005 and 2013 Household Labor Survey micro dataset; BETAM
A significant improvement in informality observed in manufacturing and services sectors where informality rates fell to 15.2 percent and 15.7 percent from 30 percent roughly. On the other hand, informality in construction sector is still quite high (38.6 percent), even if it decreased from 66.3 percent (in 2005) (Figure 2). This is also a remarkable improvement, but the amount of wage earners in construction remained unchanged. 560 thousand wage earners in 2005 and 570 thousand in 2013 are working informally in this sector. Moreover, during these eight years total informal employment decreased by 400 thousand while informal employment in manufacturing sector decreased by 336 thousand among wage earners (A. Table 4).
1 Gürsel S., Uysal G. and Acar A. (2013). “One of every three retirees is working”, Research Brief # 157, Bahçeşehir University Center for Economic and Social Research Center (BETAM)
Rather high informality among young and older workers
When we analyze informal wage-earner employment by age groups, informality is more widespread among young and old workers as we expect. Distribution of informality by age groups plots a clear U-shaped curve (Figure 3). Since education level of workers aged between 15 and 19 is low, high informality rate of 58.6 percent (in 2013) among them is not surprising. Furthermore, severance pay obligation to both male workers for compulsory military service and female workers who leave employment after marriage most probably affect the level of informality. These factors should be also influential for workers aged between 20 and 24. Although informality rate for this age group decreased to 23.4 percent in 2013, it is still above the average informality rate of 19.9 percent in Turkey (Table 1). Informality rate among wage earners reaches its minimum level of 13.2 percent (in 2013). Then, informality starts to increase (Figure 3). Probably a cohort analysis will show that average level of education decreases as the age increases.
Figure 3: Wage-earners informality by age (total employment)
1 5 -1 9 2 0 -2 4 2 5 -2 9 3 0 -3 4 3 5 -3 9 4 0 -4 4 4 5 -4 9 5 0 -5 4 5 5 -5 9 6 0 -6 4 6 5 + 0 20 40 60 80 100 74.8 40.5 25.5 23.7 24.1 23.4 28.1 38.3 53.1 61.6 76.7 58.6 23.4 13.2 13.2 14.3 16.3 19.3 28.0 36.7 43.2 63.5 2005 2013 Age groups Pe rc en ta ge s (% )
Source: TurkStat, 2005 and 2013 Household Labor Survey micro data; BETAM
Informality rates increase as the age increases and they reach its maximum level of 65.3 percent for workers aged 65 and more. Another reason for prevalent informality among older workers is a large group of working retirees employed informally. Indeed, 35 percent of retirees continue working and the majority of them (80 percent) are working informally (see Betam Research Brief 13/157). 2 During
the period of 2005-2013, informality decreased in all age groups, but largest decreases are recorded among middle-aged workers (Figure 3). This is an expected finding due to the factors stated above.
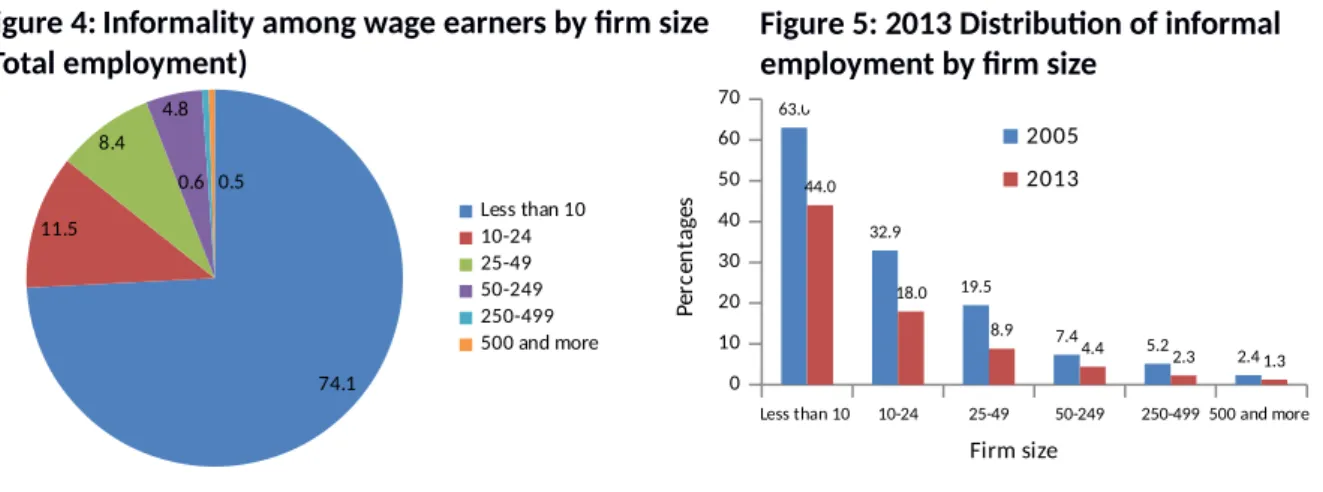
Informal working among wage earners is essentially a problem of firm scale
As clearly depicted in Figure 4, informal working among wage earners is the problem of micro firms (0-9 workers). 74 percent of informal wage earners are working in these micro firms. If we add informal wage earners working in SMS's (10-24 workers) and those in firms sized between 25 and 49 workers to informal micro firms’ workers, the share of informal workers reaches 85.6 percent and 94 2 Gürsel S., Uysal G. and Acar A. (2013). “One of every three retirees are working”, Research Brief # 13/157, Bahçeşehir University Center for Social and Economic Research (BETAM).
percent respectively (Figure 5). When rates of informality are concerned, the informality rate of 44 percent in micro firms, which employ one-third of wage earners (approximately 5.5 million), is well above average rate of informality (19.9 percent) in Turkey (Figure 4 and Table 1). As firm size increases, informality rate decreases rapidly. Indeed, informality rate in firms with 500 and more workers is very low with 1.3 percent (Figure 4).
Figure 4:Informality among wage earners by firm size (Total employment)
Less than 10 10-24 25-49 50-249 250-499 500 and more 0 10 20 30 40 50 60 70 63.0 32.9 19.5 7.4 5.2 2.4 44.0 18.0 8.9 4.4 2.3 1.3 2005 2013 Firm size Pe rc en ta ge s
On the other hand, note that the rates of informality in all firm size categories declined compared to those recorded in the year of 2005. Furthermore, during the period of 2005-2013 the number of informal wage earners reduced by 400 thousand, also 240 thousand out of this 400 thousand decrease recorded in micro firms and SMS's (A. Table 6). In order to estimate the effect of firm size variable on informality, we can use regional changes in these two variables between 2005 and 2013. Following this purpose, we calculate correlation between changes in informality rates for wage earners and changes in average firm size with a sample of 26 (NUTS 2) regions (Figure 6).3 The
computed correlation coefficient is quite high (-0.47). 4 This finding shows that firm size has a strong
impact on the level of informal employment and hence on fighting with informality. There is a requirement of formal employment to benefit from incentives for encouraging investments in less 3Since firm numbers according to size groups in regions are not available, in order to estimate average firm size we make the following estimation. In HLS TurkStat ask survey participants the number of employees at their current workplaces. In micro dataset, “number of employees” variable has 6 categories: Less than 10, 10-24, 25-49, 50-249,250-499, and 500 and more workers. In order to obtain an average firm size variable we rely on two assumptions: 1) Middle-values in the categories of firm size are converging to average number of employees per firm. 2) For each category of firm size, its share in total number firms is approximately equal to its employment share in total employment. Under these assumptions, we can proof that average firm size in a category equals to the multiplication of middle-values and its employment share (employment /number of firms). For first five groups middle-values are 5, 17, 37, 150, and 375. For the 6th category (500+) we assumed that its middle-value is ad hoc 600 (see footnote 4). Afterwards, if we divide employment in a category within a region by total employment in this region we obtain regional share of this category of the firm size and we multiply these shares by converging average number of employees. Then, we sum these factors in order to find the estimated average firm size within a region. For example, average firm size in 2005 and in 2013 for Istanbul province are calculated as follows: In 2005 in Istanbul employment share of categories of firm size are 0.29; 0.14; 0.21; 0.31; 0.03 and 0.03 respectively. When first these weights are multiplied by middle-values and then summed within Istanbul, we observe that a representative firm in Istanbul employs 85.3 workers on average. Average firm size in Istanbul increased to 100.5 workers in 2013. Thus, average firm size in Istanbul increased by 18 percent between the years of 2005 and 2013. Since we compute the correlation between changes in average firm sizes and informality rates at regional levels, we may expect that errors resulting from our assumptions are minimized.
4 Our results are robust to changes in middle-value of firm size category of “500 and more”. For this group when we used alternative middle-values (500,700,800), results did not change. The correlation coefficient is calculated as -0.46 when we assume that middle-value is 600. In addition, when we assume that it is 500,700 or 800, correlation coefficient is calculated as -0.46; -0.48 and -0,48 respectively.
Figure 5: 2013 Distribution of informal employment by firm size
Source: TurkStat, 2005 and 2013 Household Labor Survey micro dataset; Betam
Source: TurkStat, 2005 and 2013 Household Labor Survey micro dataset; Betam
74.1 11.5 8.4 4.8 0.6 0.5 Less than 10 10-24 25-49 50-249 250-499 500 and more
developed regions. We think that this requirement is effective in encouraging firms in size enlargement. That said it is worth to note that there are also other important factors affect the level of informality.
Conclusion and policy suggestions
There is a significant decrease in informal employment during the last eight years. Overall informality ratio has declined from 48.2 percent to 36.8 percent; also non-agricultural informality ratio has decreased from 34.3 percent to 22.4 percent. This remarkable improvement substantially results from the decrease of informality among wage earners. However, the decline in informality among self-employed workers was limited. Therefore, the problem of informality requires addressing these two different kinds of informality separately. The main factor behind the drop in informality among wage earners is that newly created jobs in recent years are mostly the formal ones. Informal employment in Turkey is mainly a result of social and structural features of labor force, but economic conjuncture also has an impact on it.
Structural factors studied in this research brief point out that informal employment among wage earners is essentially a problem of firm scale. According to 2013 data, third-fourth of informal wage earners are working in micro firms with less than 10 workers. If we add the employment in SMS's (10-24 workers) to this share, it reaches 85 percent. In the agriculture sector, a small part of which consists of wage earners, the rate of informality is more than 80 percent. The sector of construction has the second-highest informality rate with 40 percent. Furthermore, informality rate in sectors of manufacturing and services are about 15-16 percent. Informality rates are rather high for female workers compared to that for male workers. Gender gap in informal working is increasing as the level of education decreasing. Among young and old wage earners, informal working is more prevalent. Significant effect of firm size variable on informality emphasizes the relevance of labor costs-productivity relation. As firm size gets smaller, workers' level of education-qualification and their productivity decreases, thus sensitivity for labor costs is increasing. In this regard, starting from 2008 incentives such as general reduction of social security contribution (5 percentage points), large subsidies for the employer social security premium regarding women and youth employment have had an impact on decreasing informality. In parallel with these incentives, it predicted that higher inspection frequency in recent years had also effect on the reduction of informality. Note that informal employment is likely to decrease as average firm size and average level of education increases.
In the light of these findings, policies aimed at reducing structural informality among wage earners should base on the following aspects:
1) Reducing labor costs and increasing the frequency of inspections
2) Encouraging firms in size enlargement by removing existent disincentives
These two fundamental policies should be complemented by secondary policies. For example, the burden on firms of paying severance to female workers who leave employment after marriage and to male workers for compulsory military service might be reduced within the framework of severance payment reform based on individuals’ accounts and working retirees can be encouraged to register with social security institution.
Additional Tables
A. Table 1: Informality in female employment by employment status and education (non-agricultural)
2005
Education Less than high school High school More than high school Total Non-agricultural
Employment status Employment (in thousands) Informal employment (in thousands) Informality ratio (%) Employment (in thousands) Informal employment (in thousands) Informality ratio (%) Employment (in thousands) Informal employment (in thousands) Informality ratio (%) Employment (in thousands) Informal employment (in thousands) Informality ratio (%) Regular or causal employee 886 490 55.3 672 143 21.3 755 37 4.9 2313 670 29.0 Employer 12 4 29.6 14 3 25.6 16 3 16.2 42 10 23.1
Own account worker 170 148 87.1 28 18 65.0 24 10 40.6 222 176 79.2
Unpaid family worker 111 96 86.3 38 28 74.4 16 8 50.6 164 132 80.1
Total 1179 737 62.5 752 193 25.7 811 57 7.1 2741 988 36.0
2013
Education Less than high school High school More than high school Total Non-agricultural
Employment status Employment (in thousands) Informal employment (in thousands) Informality ratio (%) Employment (in thousands) Informal employment (in thousands) Informality ratio (%) Employment (in thousands) Informal employment (in thousands) Informality ratio (%) Employment (in thousands) Informal employment (in thousands) Informality ratio (%) Regular or causal employee 1510 606 40.1 939 114 12.2 1655 37 2.3 4104 757 18.5 Employer 22 4 16.9 22 2 9.6 45 3 5.7 89 8 9.5
Own account worker 315 280 88.7 69 48 70.3 32 11 35.7 416 339 81.6
Unpaid family worker 147 110 74.6 47 31 65.0 11 7 58.7 206 147 71.5
Total 1995 999 50.1 1077 196 18.2 1743 58 3.3 4815 1252 26.0
A. Table 2: Informality in male employment by employment status and education (non-agricultural)
2005
Education Less than high school High school More than high school Total Non-agricultural
Employment status Employment (in thousands) Informal employment (in thousands) Informality ratio (%) Employment (in thousands) Informal employment (in thousands) Informality ratio (%) Employment (in thousands) Informal employment (in thousands) Informality ratio (%) Employment (in thousands) Informal employment (in thousands) Informality ratio (%) Regular or causal employee 5028 2104 41.9 2354 433 18.4 1315 78 5.9 8696 2615 30.1 Employer 562 136 24.2 255 47 18.6 153 24 15.7 969 207 21.4 Own account worker 1642 858 52.3 407 152 37.3 137 43 31.4 2186 1053 48.2 Unpaid family worker 171 147 85.9 125 93 74.7 24 16 66.7 320 256 80.1 Total 7403 3245 43.8 3140 726 23.1 1628 160 9.9 12171 4131 33.9 2013
Education Less than high school High school More than high school Total Non-agricultural
Employment status Employment (in thousands) Informal employment (in thousands) Informality ratio (%) Employment (in thousands) Informal employment (in thousands) Informality ratio (%) Employment (in thousands) Informal employment (in thousands) Informality ratio (%) Employment (in thousands) Informal employment (in thousands) Informality ratio (%) Regular or causal employee 6060 1649 27.2 2979 306 10.3 2618 76 2.9 11657 2031 17.4 Employer 518 88 17.0 276 28 10.2 226 16 7.0 1019 132 13.0 Own account worker 1309 634 48.4 360 123 34.3 135 34 24.8 1805 791 43.9 Unpaid family worker 133 109 82.4 62 42 68.1 18 12 66.5 212 163 76.9 Total 8020 2481 30.9 3676 499 13.6 2998 137 4.6 14693 3117 21.2
A. Table 3: Informality by gender and employment status (total employment) FEMALE Employment status 2005 2013 Employment (in thousands) Informal employment (in thousands) Informality ratio (%) Employment (in thousands) Informal employment (in thousands) Informality ratio (%) Regular or causal employee 2468 821 33.3 4322 960 22.2 Employer 50 18 35.1 94 13 13.5
Own account worker 667 610 91.4 821 730 88.9
Unpaid family worker 1923 1869 97.2 2403 2271 94.5
Total 5108 3318 65.0 7641 3973 52.0 MALE Employment status 2005 2013 Employment (in thousands) Informal employment (in thousands) Informality ratio (%) Employment (in thousands) Informal employment (in thousands) Informality ratio (%) Regular or causal employee 8967 2837 31.6 12031 2298 19.1 Employer 1051 264 25.1 1088 169 15.5
Own account worker 4022 2421 60.2 3951 2254 57.1
Unpaid family worker 918 826 90.0 813 684 84.2
Total 14958 6348 42.4 17883 5405 30.2
Source: TurkStat 2005 and 2013 Household Labor Survey micro dataset; BETAM
A. Table 4: Informality among regular or causal employees by sectors (2005, 2013)
Sectors 2005 2013 Employment (in thousands) Informal employment (in thousands) Informality ratio (%) Employment (in thousands) Informal employment (in thousands) Informality ratio (%) Agriculture 426 373 87.5 591 470 79.5 Manufacturing 3483 984 28.3 4274 648 15.2 Construction 843 559 66.3 1469 567 38.6 Services 6683 1742 26.1 10018 1573 15.7 Total 11435 3658 32.0 16353 3258 19.9
Source: TurkStat 2005 and 2013 Household Labor Survey micro dataset; BETAM
A. Table 5: Informality among regular or causal employees by age groups (2005, 2013)
Employment (in thousands) Informal employment (in thousands) Informality ratio (%) Employment (in thousands) Informal employment (in thousands) Informality ratio (%) 15-19 864 646 74.8 944 554 58.6 20-24 1547 627 40.5 1856 434 23.4 25-29 2209 563 25.5 2863 377 13.2 30-34 1988 470 23.7 3032 400 13.2 35-39 1726 416 24.1 2519 359 14,3 40-44 1411 329 23.4 2122 345 16,3 45-49 946 266 28.1 1543 297 19,3 50-54 460 176 38.3 866 242 28,0 55-59 187 99 53.1 400 147 36,7 60-64 64 39 61.6 145 63 43,2 65+ 33 25 76.7 62 40 63,5 Total 11435 3658 32.0 16353 3258 19,9
Source: TurkStat 2005 and 2013 Household Labor Survey micro dataset; BETAM
A. Table 6: Informality among regular or causal employees by firm size (2005, 2013)
Firm size 2005 2013 Employment (in thousands) Informal employment (in thousands) Informality ratio (%) Employment (in thousands) Informal employment (in thousands) Informality ratio (%)
Less than 10 workers 4081 2572 63.0 5488 2415 44.0
10-24 workers 1390 457 32.9 2079 375 18.0
25-49 workers 1874 365 19.5 3087 275 8.9
50-249 workers 3109 229 7.4 3618 157 4.4
250-499 workers 403 21 5.2 822 19 2.3
More than 500 workers 578 14 2.4 1258 17 1.3
Total 11435 3658 32.0 16353 3258 19.9