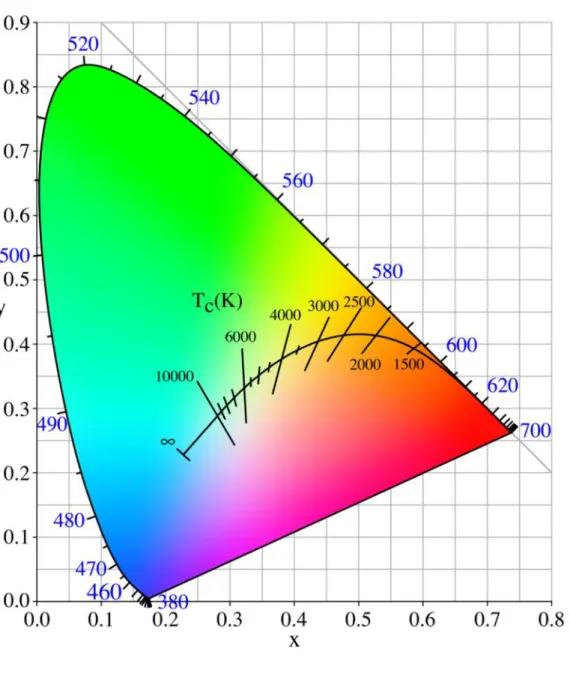
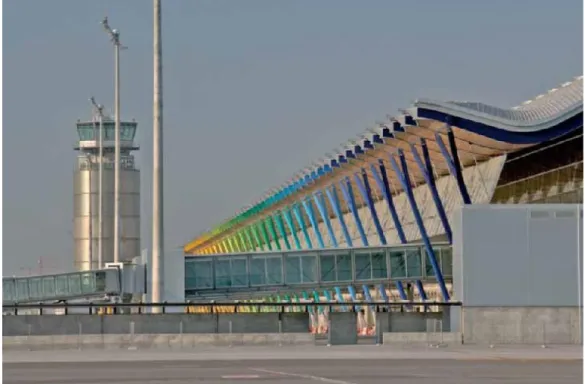
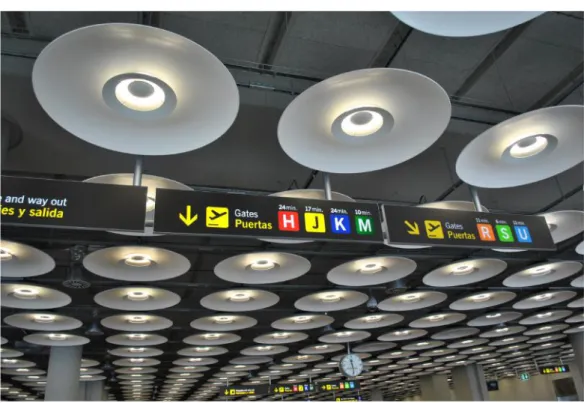
The effects of correlated color temperature on wayfinding : a study in a virtual airport environment
Tam metin
Şekil
Benzer Belgeler
PCI6WEIEOt6cHFQGFCFCB6EXP6IGEQ6HU6GECEgPDSED6cHFQGFCFHED6aF6\R\GOR6
antepartum complication but is occasionally observed during the puerperium and lactation We report a case of antepartum mastitis with severe abscess formation and successful
Meanwhile, Princess Zeyd had been experimenting with china ink and brought a quantity with her on a visit to Istanbul, during which she painted a remark able
The actual cardiovascular risk of PCOS women will be clarified in large population based studies but until then these young women would be better screened for metabolic problems to
We contribute to the existing lit erature in this area by (1) explicitly controlling for the effects of one type of diver sification (i.e., geographic or business segment)
The works reviewed as early examples of parametric procedures in building design are the Philips Pavilion by Le Corbusier and Xenakis, the Barcelona Fish by Frank Gehry and
Bu sonuçlara göre kontrol grubunda fiziksel ihmal bildirenlerde düşük BDÖ puanının olması, kardeş grubunda depresyon olmamasına rağmen fiziksel ihmal bildirenlerde
We aim to detect the sensitivity and specificity of the rapid antigen detection test in Group A streptococcal tonsillopharyngitis, ratio of positive throat culture and
