TEST OF CAPITAL ASSET PRICING MODEL IN TURKEY
* FİNANSAL VARLIKLARIN FİYATLANDIRILMASI MODELİNİNTÜRKİYE’DE SINANMASI
Cudi Tuncer GÜRSOY, Gulnara REJEPOVA
Doğuş University
ABSTRACT: This article attempts to test the validity of CAPM (Capital Asset
Pricing Model) in Turkey by regressing the weekly risk premiums (rj – rf ) against
the beta coefficients of 20 portfolios, each including 10 stocks, over the period of 1995-2004.
ISE 100 index and US T-Bill rate, adjusted for the difference between Turkish and US inflation rates were used as the proxies to the market portfolio, and the risk-free rate respectively. Following an in-depth literature survey, Fama and MacBeth (1973), and Pettengil et. al. (1995) approaches were selected as two alternative methods to be used in the research. Research findings based on Fama&MacBeth approach indicated no meaningful relationship between beta coefficients and ex-post risk premiums of the selected portfolios. With Pettengill et al. methodology, on the other hand, strong beta-risk premium relationships were discovered.
Key words: Beta, risk premium, Capital Asset Pricing Model (CAPM), Turkey.
ÖZET: Bu makale, her biri 10 hisse senedinden oluşan 20 portföyün 1995-2004
dönemindeki haftalık risk primleri (rj – rf ) ile beta katsayıları arasında oluşturulan regresyonlar yardımıyla, Finansal Varlık Fiyatlandırma Modelinin Türkiyedeki geçerliliğini test etmeyi amaçlamaktadır.
IMKB-100 endeksi ile Türkiye ve ABD enflasyon oranları farkına uyarlanmış ABD hazine bonosu faizi, sırasıyla, pazar portföyü ve risksiz faiz oranının temsilcisi olarak kullanılmıştır. Derinliğine bir literatür taramasından sonra, Fama ve MacBeth (1973) ve Pettengill ve diğ. (1995) yaklaşımları, araştırmada kullanılacak alternatif metodlar olarak seçilmiştir. Fama ve MacBeth yaklaşımıyla elde edilen araştırma sonuçları oluşturulan portföylerin beta katsayıları ile gerçekleşen risk primleri arasında hiç bir anlamlı ilişki göstermemiştir. Öte yandan Pettengill metodolojisi ile güçlü beta- risk primi ilişkileri bulunmuştur.
Anahtar kelimeler: Beta, risk primi, Finansal Varlıkların Fiyatlandırılması Modeli
(FVFM), Türkiye.
1. Introduction
CAPM, a true revolution in finance theory which took place in sixties, describes the relationship between market risks and expected returns of all types of assets, financal and real. Quite naturally, finance scholars have spent a lot of time and energy to test the theory starting from early seventies. Earlier studies, mainly by Black, Jensen and Scholes(1972) and Fama and McBeth (1973) found some support for the theory in its original form. Another support came from Black and Fischer’s
* This article is based on Gulnara Rejepova’s MS Thesis supervised by Prof.Dr.Cudi Tuncer
zero-beta model in 1972. Roll(1977), however, raised important objections to these studies arguing that the only testable thing in CAPM was mean-variance efficiency of the market proxy. According to Roll, if the proxy to market portfolio was mean-variance efficient, CAPM would always hold and vice versa. Moreover, Roll sees any effort to test CAPM useless since the true market portfolio is not identifiable, and can not be proxied by a single factor like stock market index. In fact, Roll extended his criticisims up to the point of rejecting CAPM totally, and became a strong supporter of Ross’s APT (Arbitrage Pricing Theory) as the alternative explanation to risk-return relationships. APT, however, could not replace CAPM in finance texts so far, probably because of the complexities encountered in its empirical testing.
Roll’s critics never discouraged finance scholars in their efforts to test CAPM. Conversely, most of them found his critics very useful because Roll reminded them the relationship between the mean-variance efficieny of market proxy and the resulting validity of the theory. If this is so, empirical verification of risk-return relationship would mean mean-variance efficiency of the market proxy used. This article is another attempt to test CAPM using Turkish capital market data. The main method is to regress market risk premiums of the portfolios formed in period t, against the beta coefficients of the same portfolios calculated for period t-1. Both Fama&McBeth (1973), and Pettengill (1995) approaches were used in regression analyses as many other researchers have done. Section II below is an in-depth and up-to-date literature survey. In section III we explain the design, data, and findings of our empirical research. The article ends with a brief paragraph of conclusion.
2. Literature Survey
There are numerous research works, most of which have been surveyed by the authors, attempting to test the validity of CAPM. This section summarizes 14 of them which were found relevant to and supporting this article.
As will be understood from the research works summarized below, beta-return relationships were invariably and inevitably tested on ex-post basis, giving time lags due consideration, i.e. the ex-post returns calculated for period ”t” were regressed against the beta coefficients estimated for period “t-1”. Also in almost all articles and papers, portfolios rather than individual stocks were used.
Black, F., M. Jensen, and M. Scholes(1972) study covered the period of 1931-65
and used all NYSE stocks.They estimated beta coefficients for the five-year periods based on monthly data, and ranked them from highest to lowest in order to form 10 portfolios. They used 1-month T-Bill rate as risk-free return. Although they found time-series analysis more powerful, they used cross-sectional analysis as well to regress average returns against betas of portfolios formed. The results they found were consistent with the predictions of CAPM.
Fama, E. F. and J.D.MacBeth (1973) included all common stocks traded in NYSE
from 1926 to 1968 in their analysis. They used a method called three-step approach. They divided total period(1926-1968) into 9 overlapping analysis periods. Each analysis period, in turn, was divided into three sub-periods: a four-year portfolio
portfolios were formed on the basis of ranked betas of individual securities during the first sub-period. Then the betas of the portfolios formed were re-estimated using the subsequent period’s data. Portfolio returns during the testing period were regressed against the betas calculated in estimation period. The test results showed a positive relationship between period t-1 betas and period t returns on average. Black, F., M. Jensen, and M. Scholes (1972) and Fama, E. F. and J.D.MacBeth (1973) studies were later called traditional studies
Pettengill, G.N., Sundaram, S.and I. Mathur (1995) study is the one which
attempted to overcome one important problem encountered in testing CAPM. This problem is the negative market and portfolio risk premiums observed in many observation periods such as weeks or months. Although this does not create any problem in estimating beta coefficients, it does so by weakening the ex-post relationship between betas and risk premiums. If negative data points are plotted on the same scatter diagram with positive data points, and if neither group is only a negligible fraction of total number of observations, the slope of the regression line will most likely be very close to zero implying that there is no meaningful relationship between betas and risk premiums as predicted by security market line. On the other hand, when positive and negative data points are plotted on two different scatter diagrams, the two regression lines, with positive and negative slopes will both be consistent with the prediction of security market line.
This is why Pettengil et. al. (1995), after observing 280 negative market risk premiums out of 660 data points, divided the data set into positive and negative risk premium subsets, called “up-market” and “ down market” respectively, They used a modified version of Fama and Macbeth’s three-step method, but analyzed positive and negative market risk premiums separately. The 15-year sample period was divided into three 5-year subperiods: portfolio formation period, portfolio beta
estimation period, and testing peroid. Securities were equally divided into 20
portfolios according to the ranked beta coefficients calculated for the first subperiod. Beta coefficients of these portfolios were recalculated using second period data. Actual returns of portfolios calculated in the third period were regressed against the portfolio betas calculated in the second period. But the third step was modified taking into consideration up-market and down-market phenomena.
The empirical results of cross sectional regression tests provided strong support for a systematic but conditional relationship between beta and realized risk premiums. The results of traditional test showed a significant relationship between beta and returns for the whole sample period, but not for the subperiods. The results of conditional test, on the other hand, showed significant positive relationship between beta and risk premiums for periods with positive market risk premiums, and an inverse relationship for periods with negative market risk premiums.
Jagannathan, R., and Z. Wang (1996) tested the static CAPM assuming that betas
do not remain constant over time. They used stocks listed in NYSE and AMEX. during the period of 1962-1990. All firms were sorted into size deciles according to their market values. Then beta for each firm in each size decile was estimated using CRSP(Center for Research in Security Prices) index as market proxy. The next step was sorting the firms within each size decile into beta deciles according to the
ranked beta estimates. Following Fama and French approach, they formed 100 portfolios.
They included human capital into their model in order to measure the return on aggregate wealth. The return on human capital was assumed to be an exact linear function of the growth rate in per capita labor income So, the model consisted the return on the market porfolio and the growth rate per capita labor income as independent variables.
Their research findings strongly supported conditional CAPM when betas and expected returns were allowed to vary over time by assuming that the CAPM holds in each and every period,
Fletcher, J. (1997) tested the conditional cross-sectional relationship between beta
and portfolio risk premiums in UK stock market using Pettengill et al. approach over the period of 1975-94. The 30-day UK T-Bill rate and the return on FTA(Financial Times All Share Index) were used as risk-free rate and market Proxy respectively. Their regression equation included a size variable as well. All securities have been ranked on the basis of market value and grouped into 10 portfolios in ascending order. The cross-sectional regression was run.
The test results showed a significant positive relationship between beta and portfolio risk premiums in periods of up-market, and a significant negative relationship in the periods of down-market. It has also been found that size does not affect returns in UK stock market
Hodoshima, J., X. Garza-Gomez and M. Kunimura (2000) examined beta-return
relationships in Japaneese market with Pettengill et al.’s approach, but including size, and book to market equity ratio as control variables into their model. The study covered the period of 1956-95, and included stocks listed in the first section of Tokyo Stock Exchange(TSE). The collateralized next day call money rate was used as risk-free rate. As the proxy to the market they used both JSRI(Japaneese Securities Research Institute), and EWI(Wqually Weighted Index) indices. 20 portfolios formed by the ranking of the betas were used in regression analyses. They found that data are better explained by making a distinction between positive and negative market risk premiums. It was also found that the company size is significant with a negative coefficient in the unconditional CAPM test, and with a positive coefficient in conditional test
Elsas, R., El-Shaer, M. and E. Theissen (2000) investigated beta-return
relationships in German stock market. Their study is also based on Pettengill et al. method. The authors conducted both a Monte Carlo simulation and an empirical research based on real values. For simulation test, they selected 100 stocks and developed a variance-covariance matrix using the actual excess returns (risk premiums) on these 100 stocks over the period of 1981-1995. Monthly average of these excess returns (0,6411 %) was used as market risk premium. The risk free return was set to equal 3% annually, i.e. 0,25% monthly.Thus an artificial and ex-ante efficient capital market was constructed in which CAPM holds with known parameters.
Based on these parameter values, a time series of 180 monthly returns for each asset was generated for each of 1000 simulation runs.180 monthly returns per asset were then used for the regression analysis in the following way: Returns calculated for the first 60 months were used to estimate beta of each each stock and to sort the stocks into 20 portfolios. Next, portfolio betas were estimated using the returns of the second 60-month period. Finally, excess returns calculated for the third 60 month-period were regressed against the portfolio betas calculated for the second 60-month period. This process was repeated 1000 times.
In the authors’ simulated market, the ex-ante risk premium was necessarily positive, but most of the realized risk premia were found to be negative. T-test applied to two-step traditional test results rejected the false null hypothesis of zero risk premium in only 227 ( 5% significance level) and 329 (10 % significance level) out of 1000 cases. Thus it was proven that the traditional test was unable to reject the null hypothesis that there was no relation between beta and return. In conditional test, however, t-test rejected the same null hypothesis in 985 out of 1000 cases.
The researchers, then, applied an empirical test covering the period from 1960 to 1995. They obtained monthly returns for domestic shares from Deutsche Kapitalmarktdatenbank in Karlsruhe, and used DAFOX (Deutscher Aktienforshungindex) index as market proxy. The average rate on 3-month deposits as published by Bundesbank was used as risk-free rate. They divided 36 years into three 12-year periods, and each 12-year period into three 4 year-periods(portfolio formation, beta estimation and testing periods). The number of portfolios they formed was 20. They applied both traditional and conditional tests in order. Traditional test did not give a meaningful result showing a relation between beta and returns. But contional test results were strikingly significant.
Shakrani, M.S., Ismail, A.G. (2001) conducted a test using Pettengill et al.
approach for Islamic unit trusts in Malaysia Their sample included 116 Islamic unit trusts. Analysis covered the period of 1999-2001. One-month interbank rate was used as proxy to risk-free rate. Market on the another hand was proxied by the Syariah Index.
Their cross-sectional regression model showed a flat unconditional relationship between beta and risk premiums. Significant positive relationship between beta and returns, on the other hand, was obtained with conditional test.
Pedro B. de Ocampo, Jr. (2003) employed a modified version of the three-step
approach of Fama and Macbeth. Cross-sectional regression was conducted to test unconditional and conditional CAPM.
The results strongly supported conditional relationship between betas and risk premiums. The unconditional test conducted by the author, on the other hand, showed a weak relation between beta and returns.
Zhang, J., Wihlborg, C. (2004) used Pettengill et al. (1995) method to test
risk-return relationship, and estimated cost of equity capital of firms in seven emerging markets: Cyprus, Czech Republic, Greece, Hungary, Poland, Russia and Turkey. The distinction was made between domestic and international CAPM in order to
examine whether the domestic CAPM will outperform the international one as a result of high degree of the market segmentation. Conditional and unconditional tests were both conducted. Fama and McBeth (1973) two-step regression approach was used for unconditional test and Pettengill et al. (1995) method was used for conditional test. The research provides a significant conditional relationship between beta and returns in domestic markets, and a positive unconditional relationship in two international markets only: Czech Republic and Russia, which are more integrated to the world markets.
Sandoval, E.A., Saens, R.N. (2004)’s study aimed to test the conditional and
unconditional CAPM in Latin America using the data from the Argentine, Brazilian, Chilean, and Mexican stock markets. Additional variables of size, book-to-market ratio and the degree of market integration were included in the analysis. Since Latin American stocks are traded infrequently, the authors regressed individual security returns against lagging, matching and leading market returns calculated from both the Latin American Stock Market Index and S&P 500. The study covered the period of 1995-2002 and used 3-month US T-Bill rate as risk-free return. Portfolios were formed as to the beta-based ranking of securities. Then, portfolio betas were estimated for each two-year period (totaling in eight beta estimation periods) and used as explanatory variables in the following year. The last stage included cross-sectional regressions based on Black et.al’s 1972 model, but with panel data. The results of conditional test showed a significant and positive beta-risk premium relationship during up- markets and a significant but negative beta-risk premium relationship during down- markets. Additional risk factors as size, book-to-market ratio and degree of market integration had all insignificant regression coefficients.
Tang, G., Shum, W. (2004) tested risk-return relationships in Singapore stock
market for the period from 1986 to 1998. The purposes of the study were reported as for the investigating (1), the conditional relationship between beta and returns, (2) long-run positive risk-return tradeoff, (3) other measures of risk in addition to beta that affect asset pricing when up and down markets are split. The traditional test was also conducted. Data were collected from Pasific-Basin Capital Markets(PACAP). Monthly returns of 144 listed stocks were calculated. The one-month Singapore interbank offer rate and Singapore Exchange Limited (SGX) index were used as risk-free rate and as market proxy respectively.The unconditional test showed weak positive relationship between beta and returns. Conditional test, on the other hand, found significant relationship between beta and realized returns.
Medvedev, A. (2004) tested the CAPM under ambiguity in order to see the
implications of the ambiguity on equilibrium asset prices. In order to do this, he included ambiguity as a second variable into SML formula, i.e. he used a two-factor CAPM model. He assumed that the volatility process is not known but the volatility always lies within known boundaries. He estimated the coefficient of ambiguity variable by taking the average of standard deviations of residual returns of the 48 industry portfolios included in the analysis.These portfolios were the same portfolios costructed by Fama and French earlier. Monthly returns on these portfolios over the years 1973 through 2003 were selected Market risk premium for the same period was also available. For testing CAPM, he ran cross-sectional Fama-McBeth regressions. The results showed that the cross sectional effect of the ambiguity factor was statistically much more significant than beta coefficient.
Ang A, Chen, J. (2005), in their study, aimed to see whether a conditional one-factor model could account for the spread in the average returns of portfolios sorted by book-to-market ratios in the long run.
Most of the earlier studies had documented strong evidence of a book-to-market effect using OLS regressions in the post-1963 period. Ang and Chen, however, argued that since the betas of portfolios sorted by book-to-market ratios varied over time OLS inference produced inconsistent estimates of conditional alphas and betas. Therefore the authors developed a conditional CAPM model with time-varying betas, time-varying market risk premia, and stochastic systematic volatility to test the book-to-market effect over the long run. They used the returns of all stocks listed in NYSE, AMEX, and NASDAQ over the period of 1926-2001. The conditional CAPM was used to portfolios sorted by book-to-market ratios.
They found that in their conditional CAPM model with time-varying betas, predictable market risk premia, and stochastic systematic volatility, there was little evidence that the conditional alpha for a book-to-market trading strategy is statistically different from zero. In addition their model sufficiently explained risk-return relationships of book-to-market portfolios over the lung run.
Nevertheless, the authors did not posit that the conditional CAPM is the complete model for the cross-sectional analysis of stock returns, and that the conditional CAPM can explain all anomalies.
3. Test of CAPM in Turkey
3.1. Research Data and The Method
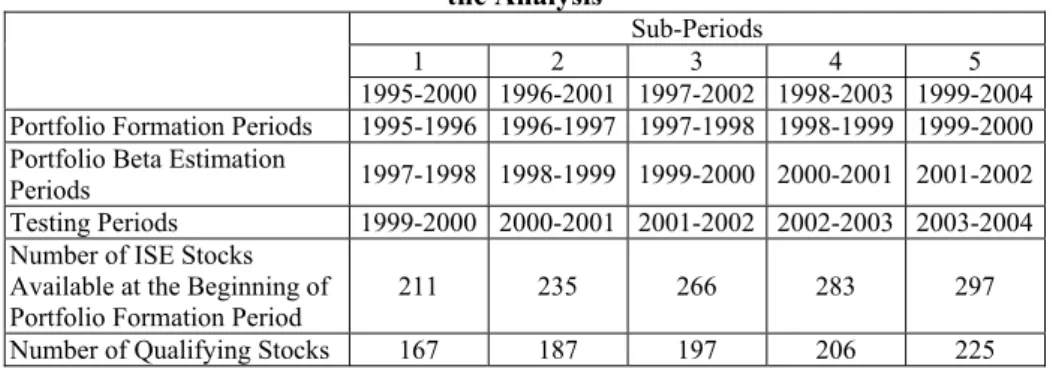
The analysis period of this research extends from January 1995 through December 2004. This period was divided into five 6-year sub-periods with one overlapping year in each. Overlapping year in each of two consecutive sub-periods is expected to smoothen possible volatility of beta coefficients estimated in each sub-period. Each sub-period, in turn, was further divided into three 2-year periods being portfolio formation, beta estimation and testing periods. All the ISE stocks available and meeting data requirements in each period were included in the analysis. Summary information about the periods and number of qualifying stocks is presented in Table-1.
Table 1. Fragmentation of Analysis Period, and Numbers of Stocks Included in the Analysis
Sub-Periods
1 2 3 4 5
1995-2000 1996-2001 1997-2002 1998-2003 1999-2004 Portfolio Formation Periods 1995-1996 1996-1997 1997-1998 1998-1999 1999-2000 Portfolio Beta Estimation
Periods 1997-1998 1998-1999 1999-2000 2000-2001 2001-2002 Testing Periods 1999-2000 2000-2001 2001-2002 2002-2003 2003-2004 Number of ISE Stocks
Available at the Beginning of
Portfolio Formation Period 211 235 266 283 297
The number of available qualifying stocks permitted to form 20 portfolios each including about 10 stocks. The number of portfolios were considered more important than the number of stocks in each portfolio in order to increase the quality of regression results.
First 2-year slice of each 6-year sub-period was used as the portfolio formation period. Beta coefficient of each individual stock was calculated by regressing weekly risk premiums of the stock (rj – rf ) against weekly risk premiums of ISE-100
index ( rm – rf ) over 104 weeks. Dividend distribution, whether in cash or stock, and
stock split weeks were exluded from calculations. In order to eliminate distorting effect of high real interest rates in Turkey over the analysis period, weekly equivalents of US 3-month T-Bill rates, adjusted for the difference between Turkish and US inflation rates using Fisher equation, were used as a proxy to Turkish risk-free rate. This adjustment was made as follows:
(rTL)* = rUS + (eTL – eUS ) + rUS (eTL – eUS )
Where:
(rTL)* = Proxy to weekly Turkish risk-free rate
rUS = Weekly equivalent of US 3-month T-Bill rate
eTL = Weekly inflation rate in Turkey
eUS = Weekly inflation rate in US
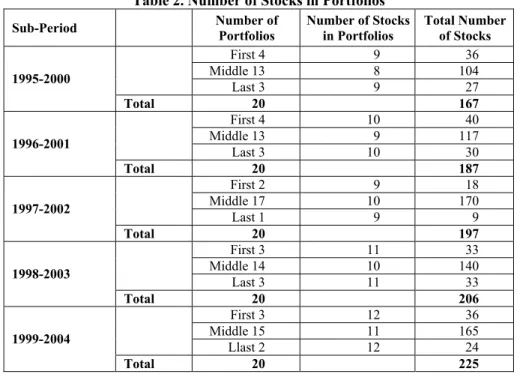
The stocks were next ranked in decreasing order of their beta coefficients, and were divided into 20 equally-weighted portfolios according to this ranking, as shown in Table 2.
Table 2. Number of Stocks in Portfolios
Sub-Period Number of Portfolios Number of Stocks in Portfolios Total Number of Stocks
First 4 9 36 Middle 13 8 104 Last 3 9 27 1995-2000 Total 20 167 First 4 10 40 Middle 13 9 117 Last 3 10 30 1996-2001 Total 20 187 First 2 9 18 Middle 17 10 170 Last 1 9 9 1997-2002 Total 20 197 First 3 11 33 Middle 14 10 140 Last 3 11 33 1998-2003 Total 20 206 First 3 12 36 Middle 15 11 165 Llast 2 12 24 1999-2004 Total 20 225
In the following step, the second 2-year slice of each sub-period was used to recalculate the betas of the securities already located in their respective portfolios. Beta of each portfolio, then, was calculated as the simple average of betas of the stocks included in this portfolio.
The third 2-year slice of each sub-period was used as testing period. For this purpose average weekly risk premiums of individual assets and portfolios were calculated. Weekly average of portfolio risk premiums were computed as the simple average of the average weekly risk premiums of the stocks in the portfolio. Thus, for each 6-year sub-period we had 20 portfolio betas calculated for the second 2-year period, and 20 portfolio risk premiums calculated for the testing period, i.e. the third 2-year slice. Finally cross-sectional regression equations between betas and risk premiums were estimated first by Fama and MacBeth’s traditional approach, and secondly by Pettengil et. al’s conditional approach.
For traditional approach the regression equation run was:
Rip,t – Rf,t = y0t + y1t β ip,t-1 + € t
where:
Rip,t – Rf,t is the risk premium on i’th portfolio in testing period t,
y0t and y1t are the regression coefficients,
β ip,t-1 is the beta of i’th portfolio calculated in the previous 2-year time slice, and
€t is the error term
For conditional approach, on the other hand, regression equation takes the form of
Rip,t – Rf,t = y0t + y1t * δ * β ip,t-1 + y2t* (1-δ) * β ip,t-1+€ t
where:
δ=1 when (Rmt –Rft )>0 (i.e. when market risk premium is positive in test period t), and
δ=0 when (Rmt –Rft )<0 ( i.e. when market risk premium is negative in test period t) 3.2. Research Findings
3.2.1. Fama&MacBeth’s Traditional Approach
Summary of regression results with the traditional approach is given in Table 3. Validity of CAPM would be verified when ŷ0=0, and ŷ1≠0. As seen in Table 3, ŷ0 is
indeed not different from zero throughout the analysis period except in 2001-02. ŷ1,
on the other hand, is significantly different from zero only in sub-periods of 2000-2001 and 2000-2001-2002 which coincide with the long enduring economic crisis. The negative sign of ŷ1 is most probably due to persistent negative weekly market risk
premiums over those years. R2 in these two periods, on the other hand, represents a
weak explanatory power of the regression equation obtained. Thus, it can be concluded that Fama&McBeth’s traditional approach indicates no ex-post relationship between beta and portfolio risk premiums. This result is in conmformity with the findings of earlier research summarized in Section 2 above.
Table 3. Summary Results for the Traditional Test Test Period 1999-2000 2000-2001 2001-2002 2002-2003 2003-2004 ŷ0 -0,0044 -0,0041 -0,0040 -0,0197 0,0023 ŷ1 0,0021 -0,0106 -0,0060 0,0147 0,0007 se (ŷ0) 0,0042 0,0026 0,0015 0,0362 0,0020 se (ŷ1) 0,0053 0,0035 0,0021 0,0365 0,0023 se (Rp-Rf) 0,0018 0,0019 0,0016 0,0017 0,0015 R2 0,0090 0,3425 0,3028 0,0089 0,0053 ssreg 0,0000 0,0000 0,0000 0,0000 0,0000 ssresid 0,0001 0,0001 0,0000 0,0001 0,0000 t (ŷ0) -1,0300 -1,5690 -2,7056 -0,1776 1,1069 t (ŷ1) 0,4046 -3,0621 -2,8185 0,0146 0,3087
ŷ0)=Regression intercep; ŷ1 =Regression slope; se(ŷ0) =Standard Error of y0; se(ŷ1)=Standard
Error of y1; se(Rp-Rf)=Standard Error of portfolio risk premium; R2= Coefficient of
determination ; ssreg= The regression sum of squares; ssresid = The residual sum of square ; t (ŷ0) = t-Statistic for ŷ0 ; t (ŷ1 ) = t-Statistic for ŷ1
3.2.2. Pettengil et al’s Conditional Approach
Since CAPM is based on a positive risk-return trade-off, market return must be naturally higher than risk-free rate. But, since CAPM tests are based on realized returns, it is quite possible to observe negative market risk premiums in some observation periods. Pettengil et al’s conditional approach is based on the very logical argument that if Rm < Rf on ex-post basis, high-beta stocks’ realized returns
should be lower than low-beta stocks’ realized returns as implied by security market line equation.
In our analysis, a week-by-week comparison of risk-free rate against ISE 100 index showed that risk-free rate was higher than market return in 155 out of 312 weeks. Therefore we had a unique opportunity to test CAPM in the second round by conditional approach. For this purpose positive market risk premium weeks were separated from negative market risk premium weeks, and two different data set were formed. Weeks with positive and negative market risk premiums were called “up-market”, and “down-market” respectively.
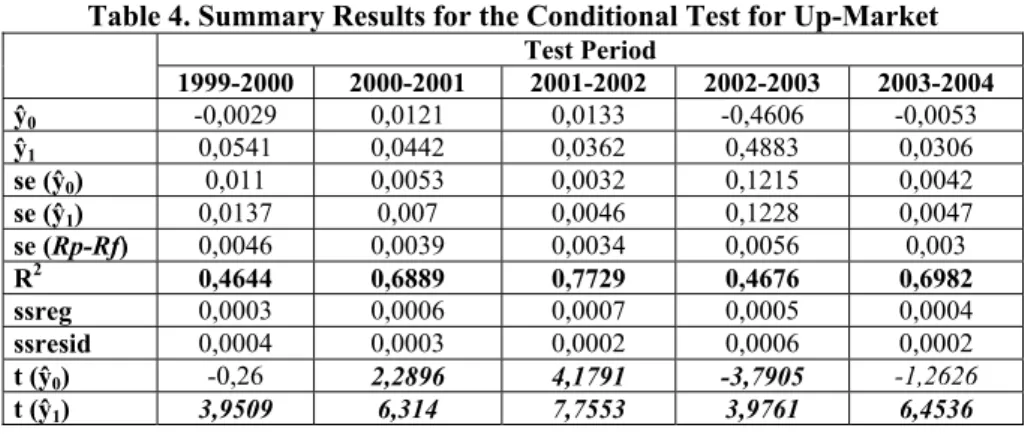
Regression results for the up-market are summarized in Table 4.
Table 4. Summary Results for the Conditional Test for Up-Market Test Period 1999-2000 2000-2001 2001-2002 2002-2003 2003-2004 ŷ0 -0,0029 0,0121 0,0133 -0,4606 -0,0053 ŷ1 0,0541 0,0442 0,0362 0,4883 0,0306 se (ŷ0) 0,011 0,0053 0,0032 0,1215 0,0042 se (ŷ1) 0,0137 0,007 0,0046 0,1228 0,0047 se (Rp-Rf) 0,0046 0,0039 0,0034 0,0056 0,003 R2 0,4644 0,6889 0,7729 0,4676 0,6982 ssreg 0,0003 0,0006 0,0007 0,0005 0,0004 ssresid 0,0004 0,0003 0,0002 0,0006 0,0002 t (ŷ0) -0,26 2,2896 4,1791 -3,7905 -1,2626 t (ŷ1) 3,9509 6,314 7,7553 3,9761 6,4536
Table 4 clearly indicates a very strong relationship between beta coefficients and the realized risk premiums in all sub-periods. For each sub-period, the null hypothesis ŷ1
= 0 is rejected at 0,01 alpha level. R2 s are also considerably higher than those of traditional test.
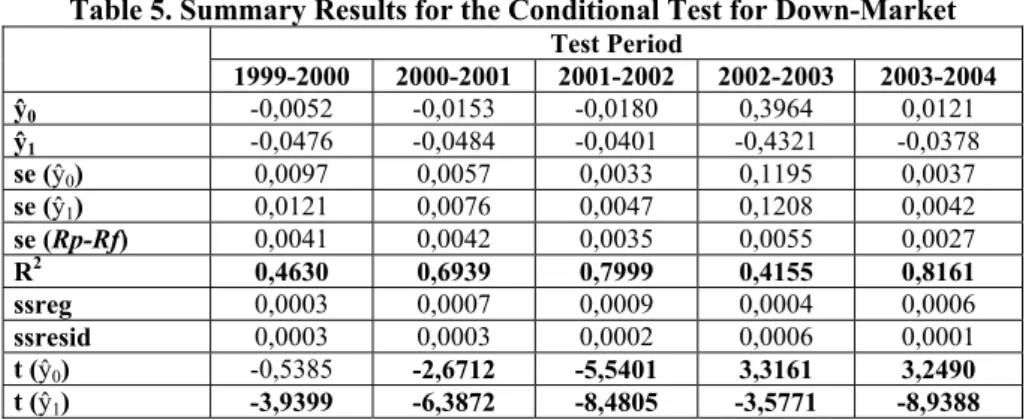
Down-market analysis gave very similar results to up-market findings, but with a negative sign for ŷ1 as expected. As seen in Table 5, the null hypothesis that ŷ1 = 0 is
rejected at 0,01 alpha level for each and every sub-period. R2 s, as well, are
satisfactorily high.
The null hypothesis that ŷ0 =0, however, can be accepted neither in up-market nor
down market conditions, except in the subperiods of 1999-2000 and 2003-2004, indicating that beta is not the only explanatory variable for realized returns.
Table 5. Summary Results for the Conditional Test for Down-Market Test Period 1999-2000 2000-2001 2001-2002 2002-2003 2003-2004 ŷ0 -0,0052 -0,0153 -0,0180 0,3964 0,0121 ŷ1 -0,0476 -0,0484 -0,0401 -0,4321 -0,0378 se (ŷ0) 0,0097 0,0057 0,0033 0,1195 0,0037 se (ŷ1) 0,0121 0,0076 0,0047 0,1208 0,0042 se (Rp-Rf) 0,0041 0,0042 0,0035 0,0055 0,0027 R2 0,4630 0,6939 0,7999 0,4155 0,8161 ssreg 0,0003 0,0007 0,0009 0,0004 0,0006 ssresid 0,0003 0,0003 0,0002 0,0006 0,0001 t (ŷ0) -0,5385 -2,6712 -5,5401 3,3161 3,2490 t (ŷ1) -3,9399 -6,3872 -8,4805 -3,5771 -8,9388
The statistical findings of this research are in tandem with those found by most of the earlier research. Beta-return relationship exists provided that positive and negative market risk premium periods are analyzed separately, i.e. high beta stocks have higher positive risk premiums than market risk premium when market is up, and higher negative risk premiums when market is down.
However, ŷ0 =0 hypthesis could be accepted only in two subperiods of up-market
condition, and only in one subperiod of down-market condition. This result, of course, weakens the validity of single index CAPM model in Turkey over the analysis period and implies that some additional explanatory variables might have improved regression results.
4. Conclusion
Our test results support the hypothesis that the systematic risk of a portfolio measured by beta coefficient is indeed an important determinant of portfolio returns in Turkey. Therefore the use of beta estimated from past prices by portfolio managers seems to be justified.
The results of this study also suggest that a portfolio of high-beta stocks perform better in up-market conditions, whereas a low-beta portfolio is a better investment in down-market.
Needles to say, the findings of this research can/should not be taken as the ultimate proof for the validity of CAPM in Turkey, especially given the fact that ŷ0 was found
significantly different from 0. We will certainly have better insights on Turkish capital market as more research comes out in future.
References
ANG, A., CHEN, J., (2005), CAP Mover the long run: 1926-2001. Working Paper, NBER.
BANZ, R. (1981). The Relationship between return and market value of common Stocks. Journal of Financial Economics 9: 3-18.
BLACK, F., JENSEN, M. & SCHOLES, M. (1972). The Capital asset pricing model: some empirical tests. In M. JENSEN, Ed., Studies in the theory of capital markets, New York, Praeger.
ELSAS, R., EL-SHAER, M. & THEISSEN, E. (2000). Beta and returns revisited:
evidence from the german stock market, Working Paper Series, SSRN.
FAMA, E.F. & MacBETH, J.D. (1973). Risk, return and equilibrium: empirical tests.
Journal of Political Economy, 81, pp.607-636.
FLETCHER. J., (1977). An examination of the cross-sectional relationship of beta and return: UK evidence. Journal of Economics and Business, 49, pp.211-221. ., (2000). On the conditional relationship between beta and return in
international stock returns. International Review of Financial Analysis, 9, pp.235-245.
HODOSHIMA, J., GARZA-GOMEZ, X & KUNIMURA, M. (2000). Cross-sectional regression analysis of return and beta in Japan. Journal of Economics and
Business, 52, 515–533.
JAGANNATHAN, R., & WANG, Z. (1996). The Conditional CAPM and the cross-section of expected returns. Journal of Finance, 51, 3-53.
MEDVEDEV, A., (2004). CAPM Under Umbiguity. National Center of Competence
in Research Financial Valuation and Risk management. Working Paper 186.
PEDRO B. de OCAMPO, Jr., (2003). Working paper, college of business administration University of the Philippines, Diliman, Quezon City.
PETTENGILL, G.N., SUNDARAM, S. & MATHUR, I. (1995). The Conditional relation between beta and returns. Journal of Financial and Quantitative Analysis, 30, pp. 101-116.
SANDOVAL, E.A., SAENS, R.N. (2004). The Conditional relationship between portfolio beta and return: evidence from Latin America. Cuadernos de Economia, vol. 41 (Abril), pp. 65-89.
SHAKRANI, M.S., ISMAIL, A.G., (2001). The conditional CAPM and cross-sectional evidence of return and beta for Islamic unit trusts in Malaysia. Bangkel
Economi, Universiti Kebangsaan Malaysia, Bangi.
ZHANG, J., WIHLBORG, C., (2004). Unconditional and conditional CAPM:
evidence from eEuropean emerging markets. Working Paper, Department of