THE RELATIONSHIPS BETWEEN TERM
STRUCTURE OF INTEREST RATE AND ECONOMIC
ACTIVITY
An Application to Turkish Economy
Hüseyin KAYA 104622016
ĐSTANBUL BĐLGĐ ÜNĐVERSĐTESĐ
SOSYAL BĐLĐMLER ENSTĐTÜSÜ
EKONOMĐ YÜKSEK LĐSANS PROGRAMI
TEZ DANIŞMANI Doç. Dr. Ege YAZGAN
ii
THE RELATIONSHIPS BETWEEN TERM STRUCTURE OF
INTEREST RATE AND ECONOMIC ACTIVITY
An Application to Turkish Economy
VADE FARKLARI ĐLE EKONOMĐK AKTĐVĐTELER ARASINDAKĐ
ĐLĐŞKĐ
Türkiye Ekonomisi Đçin Bir Uygulama
Hüseyin KAYA
104622016
Doç Dr. Ege YAZGAN :………..
Prof.Dr. Burak Saltoğlu :………..
Yrd.Doç.Dr. Koray Akay :………..
Onay Tarihi : 13/07/2007
Toplam Sayfa Sayısı : 69
Anahtar Kelimeler
Keywords
1) Vade Farkları 1) Term structure of interest rate
2) Reel Ekonomi 2) Real Economy
3) Enlasyon 3) Inflation
4) Kısa dönemli faiz oranı 4) Short term interest rate
iii ABSTRACT
The main purpose of this thesis is to investigate the relationship between term structure of interest rate and real economic activity, which measured by growth of industrial production index, during the period of April 1991-November 2006 in Turkey by considering in detail the observed relationship of term structure of interest rate and economic activity. To examine the associated relationship the Autoregressive Distributed Lag (ARDL) approach is used. We found that while ARDL bond test results indicate high degree of cointegating relationship between term structure of interest rate and growth of industrial production index, the long-run coefficient of all yield spreads are insignificant. On the other hand, when the inverse relationship is examined we found that, there is significant long-run relationship between growth of industrial production index and yield spreads. In addition to this, it is also analyzed the relationship between short term interest rate and growth of industrial production index. Using ARDL approach it is found a significant and negative long-run relationship between short term interest rate and growth of industrial production index as expected. Short run effects of short term interest rate on change in growth of production index are also investigated with error correction mechanism. The results indicate that any short-run deviations from equilibrium die out in the long-run and the system come to equilibrium by fluctuating. It is expected that, deepening of the financial market and achieving success in structural transformations in economy will lead to get better results from future term structure research.
iv ÖZET
Bu tez, Türkiye’de Nisan 1991-Kasım 2006 döneminde vade yapıları ile sanayi üretim endeksinin büyümesi arasındaki ilişkiyi araştırmaktadır. Bu ilişkinin mahiyetini araştırmak amacıyla gecikmesi dağıtılmış otoregresif model (autoregressive distributed lag ARDL) kullanılmıştır. ARDL sınır testi sonuçları vade farkları ile sanayi üretim endeksinin büyümesi arasında uzun dönemli eşbütünleşme (cointegration) ilişkisi olduğu gösterirken,statik uzun dönem çözümleri vade farklarının uzun dönemli ilişki katsayılarının anlamlı olmadığını göstermektedir. Diğer yandan, yine ARDL yaklaşımı kullanılarak ilişkinin diğer yönü de araştırılmış, üretim endeksi büyümesi ile vade farkları arasında uzun dönemli negatif ve istatistiki olarak anlamlı bir ilişkinin olduğu bulunmuştur. Vade farklarının reel ekonomi hakkındaki bilgi dağarcığı araştırıldıktan sonra, Türkiye’de kısa dönemli faiz oranları ile sanayi üretim endeksi büyümesi arasındaki ilişki analiz edilmiştir. Uzun dönemde kısa dönem faiz oranları ile üretim endeksi büyümesi arasında istatisiki olarak anlamlı ve negatif bir ilişki olduğu bulunmuştur. Kısa dönemli faiz oranları ile üretim endeksi büyümesi arasındaki kısa dönemli ilişki bir hata düzeltme modeli ile incelenmiş ve kısa dönemli denge sapmalarının uzun dönemde dalgalanarak dengeye geldiği tespit edilmiştir. Ulaşılan bu sonuçlar, daha önce Türkiye’de vade farkları ile ilgili yapılan çalışma sonuçlarını desteklemektedir. Finansal piyasaların derinleşmesi ve ekonomide yaşanan yapısal dönüşümlerin başarıya ulaşması gelecek dönemlerde yapılacak analizlerden daha sağlıklı sonuçların elde edilmesine katkı sağlayacaktır.
v
Table of Content
ABSTRACT ... iii
ÖZET ...iv
Table of Content ...v
List of Tables ...vi
List of Figures...vi
1. INTRODUCTION ...1
2. THE TERM STRUCTURE OF INTEREST RATE...6
2.1. Expectation Hypothesis ...7
2.2. Segmented Market Theory ...8
2.3. Liquidity Premium Theory ...9
2.4. Preferred Habitat Theory ...9
3. THE OBSERVED RELATIONS BETWEEN TERM STRUCTURE OF INTEREST RATE AND INFLATION...11
4. THE OBSERVED RELATIONS BETWEEN TERM STRUCTURE OF INTEREST RATE AND REAL ECONOMIC ACTIVITY ...22
5. THE POLICY EFFECTS ON PREDICTIVE POWER OF TERM STRUCTURE OF INTEREST RATE...37
6. DOES TERM STRUCTURE OF INTEREST RATE INCLUDE INFORMATION ABOUT REAL ECONOMIC ACTIVITY IN TURKEY ...41
6.1 Autoregressive Distributed Lag Model (ARDL)...42
6.2 Testing the Relationship Between Term Structure of Interest Rate and Real Economic Activity in Turkey: ARDL Model Approach ...43
6.3 Testing the Relationship Between Short Term Interest Rate and Real Economic Activity in Turkey...52
7. CONCLUSION ...57
vi List of Tables
Table 1: Litereture on analysing relations between term structure and inflation...12
Table 2: Litereture on analysing relations between term structure and real economic activity23 Table 3: Unit Root Test Results ...44
Table 4: AR statistics and Lagged Differences Selected by Criterion ...46
Table 5: Bound Test, F and t statistics ...47
Table 6: Estimated Long-run coefficients for ARDL (1,1) ...48
Table 7: AR statistics and Lagged Differences Selected by Criterion for Reverse Relation ...50
Table 8: Bound Test, F and t statistics ...51
Table 9: Static Long-run Solutions...51
Table 10: Unit Root Test on _ 30i ...52
Table 11: AR statistics for _ 30i and Lagged Differences Selected by Criterion ...53
Table 12: ARDL Bound Test for _ 30i ...53
Table 13: Long-run Solution for _ 30i ...53
Table 14: ARDL (1,1) Model ECM Results...55
Table 15: ARDL (2,2) Model ECM Results...55
Table 16: ARDL (3,3) Model ECM Results...55
Table 17: ARDL (4,4) Model ECM Results...55
List of Figures Figure 1: Positively sloped yield curve ...6
Figure 2: Negatively sloped yield curve...6
Figure 3: Annual growth rate of GNP in Turkey during 1983-2006...41
1
1. INTRODUCTION
The term structure of interest rate, i.e. yield spread, has long been interest of macroeconomics and financial economics. As financial economists look at the theory of term structure of interest rate, macroeconomist look at the relationship between term structures of interest rate and economic activity in particular inflation and output growth.
Multiple theories have been proposed to explain the shape of the term structure, but research to date has not definitively explained which of the theories provides the best explanation for the term structure shape (Philips, 2003). There are four major theories of term structure of interest rate in the literature which are expectation hypothesis, segmented market theory, preferred habitat theory and liquidity premium theory.
The expectations hypothesis of the term structure of interest rates is one of the oldest and simplest analytical frameworks that simplify the rational behavior in the financial markets. According to the expectations hypothesis, the long-term interest rates should reflect future short-term changes. Specifically, long-term interest rates would be the average of future expected short rates (Esteve, 2006). On the other hand liquidity premium theory, advanced by Hicks (1946), is a modified type of expectation hypothesis asserts that long term interest rate is equal to average of expected short term interest rate plus a positive risk premium because of that investors are usually risk averse so any investor demand long instead of short must be paid by a positive premium.
Segmented markets theory, introduced by Cullberston (1957), explain term structure of interest rate by stressing existence of different demand and supply conditions for different maturities, and non-existence of substitution among securities with different maturities. Under the segmented markets theory, participants in one segment would be indifferent to supply-demand forces in adjacent maturity segments. A variant of the segmented markets theory, the preferred habitat theory, allows for segment participants to be induced to leave their preferred habitat when there are sufficient incentives; i.e., higher yields. Actually preferred habitat, introduced by Modigliani and Sutch (1966), and is a theory of combination of all three theories. Preferred habitat theory states that long term interest rate is equal to average of expected short term interest rate that occur during life time of the security plus a premium which reflects supply and demand conditions for that security. Therefore, spread depends
2
primarily on expectation of long run changes but it also depends on supply and demand conditions.
On the other hand macroeconomists, policymakers and market analyst whish to investigate whether term structure of interest rate contain significant information about future economic activity. As expectation hypothesis suggest it is possible to extract expectation of economic actor about future economic activity by taking account to term structure of interest rate. On this basis, firstly Harvey (1988) showed that the term structure of ex ante real rates of interest contains information about future real consumption and economic growth. On the other hand Fama (1990) showed that term structure of interest rate has significant information about future path of inflation rate.
Especially the Mishkin (1990) by using Fisher equation and taking differences of two different periods of inflation, introduced term structure of interest rate as an information container about inflation. After Mishkin (1990) model, papers which are devoted to the investigation of the relationship between yield curve and inflation started to published. Folowing Mishkin (1990), Jurion and Mishkin (1991) find the similar results for European economies. Tzavalis and Wickens (1996), Gamber (1996), Ivanova at al (2000), Sahinbeyoğlu and Yalçın (2000), Nagayasu (2002), Telatar at al (2003),Estrella at al (2003) and Trackz (2004) are all investigate the information content of term structure about future economic activity. Except Sahinbeyoğlu and Yalçın (2000), and Telatar at al (2003) all conclude that slope of yield curve is a good informative about the future inflation changes.
Sahinbeyoğlu and Yalçın (2000) applied the Mishkin’s (1990) model to Turkish economy and they, interestingly, found that term structure of nominal interest rates have a significant but, as a contrary to theoretical framework and previous studies, negative effects on future inflation path. They argued that the result may due to the immature financial market and lack of long maturities. Telatar at al (2003) visited the relationship between yield curve and inflation in Turkish economy by considering period which investigated is, 1990–2000, a period of high inflation, high budget deficits, and political instability. By using a time-varying-parameter model with Markov-switching heteroskedastic disturbance, they found, contrary to Sahinbeyoğlu and Yalçın (2000), positive relationship between slope of yield curve and inflation but information content of yield curve about future inflation is limited.
3
Harvey (1988), tried to find the relationship between expected real term structure and expected consumption growth by following the claim of consumption based asset pricing model and he found that real term structure has more information and more predictive power than lagged consumption growth and lagged stock return. Therefore these findings declared the existence of a new and strong variable that can be used for predicting future real economic activity. After Harvey, Estrella and Hordauvelis (1991) found that term structure has more information and predictive power than lagged output growth, lagged inflation, leading indicator index and level of real short term interest rate. Also Friedman and Kutner (1991), look at the relationship between spread between 6 month commercial paper rate and 3 month T-bill rate. They found that spread not only has explanatory power but also spread widens in business cycles period and narrow in recovery period. Following years, Plosser (1994), Bonser at al (1997), Estrella and Mishkin (1998), Peel and Taylor (1998), Estrella at al (2003), Bordo and Haunrich (2004), Giacomini and Rossi (2005) look at linear relationship between term structure of interest rate and output growth and they all found strong predictive relationship between term structure of interest rate and future real economic activity.
Estrella and Mishkin (1998), Esrella at al (2003) use also probit model to predict recession by using term structure of interest rate. They found term structure of interest rate has prediction power for recession. Chauvet and Potter (2000) use more general form of probit model and they reach the same conclusion.
On the other hand Galbraith and Tkacsz (2000), found the existence of asymmetries in the link between yield spread and output. Paya at al (2004) analyzed standard linear and nonlinear behavior of the information content and asymmetry in the spread for future real economic activity. It is found that both linear and nonlinear (threshold autoregression) models has significant predictive power over nine and four different industrial production sectors in the US and UK. Nakaota (2005) took into account of relationship between yield curve and real economic activity in Japan. He argued that the nature of relation may change over time after it cannot be found such relationship with standard linear model. By adding dummy variable to standard linear model he found that yield spread forecast real GDP growth. Ang at al (2006) construct a dynamic model of yield curve and found yield spread has predictive power but short interest rate dominates yield spread in forecasting GDP growth.
While the relationship between term structure of interest rate and real economic activity is powered by model, it is also investigated policy effects on this relationship. Gamber (1996)
4
investigates that whether forecasting ability of term structure is solely due to its relationship to monetary policy or whether it contains independent information about change in future inflation and output. Results showed that terms structure of interest rate has independent predictive power only when FED does not react to change in that variable. Kim and Limpaphayom (1997) use bivariate term structure model to emphasize policy effects on predictive power of term structure of interest rate and found that policies toward economy highly affect the predictive power of term structure of interest rate.
Peer and Ioannidis (2003) test the structural stability of the forecasting output growth and reached the result that the anti-inflation policy reduces the predicative ability of term structure of the interest rate. Bordo and Haubrich (2004) found that when credibility is low, inflation persistence is high, predictive power of term structure is also high. Giacomin and Rossi (2005), found that structural breakdown linked to monetary policy changes in FED’s preference parameters. Estrella (2005) concluded that the extent to which the yield curve is a good predictor depends on the form of the monetary policy reaction function, which in turn may depend on explicit policy objectives. Thus, the predictive relationships, though robust, are not structural.
While information content of term structure is deeply examined especially the cases of developed economies, there are not satisfactory studies of yield spread in Turkey. The unstable characteristic of Turkish economy, and immature structure of financial market lead to terms structure of interest rate being uninformative about inflation and real economic activity (Sahinbeyoğlu and Yalçın , 2000; Telatar at al 2003, Eraslan, 2005).
To determine the nature of relations between term structure of interest rate and growth of industrial production index the ARDL bound test approach applied. ARDL bound test approach allow us to investigate the long-run relationship of yield spread and growth of industrial production index irrespective of whether all variables are integrated same order or not.
The data are monthly and range from April 1991 to November 2006. Monthly industrial production index is obtained from IMF’s International Financial Statistics 2006 CD Room. Treasury bond interest rates ( thanks to Prof. Dr. Burak Saltoğlu for giving his data) of term 30, 60, 90, 120, 180, 270 and 360 days taken from Istanbul Stock Exchange database as a daily interest rate and obtained with interpolation method. All possible term structures are
5
used. Mainly because of the lack of deep financial market and high risk in Turkey, term length not being much long.
Although the bound test results indicate that there are strong long-run relationship between yield spreads and growth of industrial production index, static long-run solutions show that long-run coefficients of term structure of interest rates are not significant. On the other hand, when the inverse relationship is analyzed and we found that, there is significant long-run relationship between growth of industrial production index and yield spreads. The long-run coefficient of growth of industrial production index is negative and significant and very high especially for the models that dependent variable is s_360_30 and s_270_30 and s_180_30. Thus associated results indicated that in the long-run any increase in y cause a decrease in s. As discussed in the literature; nonexistence information content of yield spreads about economic activity may because of the lack of deep financial market, lack of long term yield spread data that reflects long run expectations, unstable macroeconomic conditions such as high inflation, volatile growth and high risk factors in Turkey. Also level effects and time variation may play important role. Also getting long-run cointegrationg relationship and significant long-run reverse relationship may indicate that variables are affected by common factors, such as capital movements, political risk etc.
When we cannot reach usual conclusion, it is examined the relationship between short term interest rate and growth of industrial production index by following the findings of Ang et al (2006) stating that short interest rate predict future real economic activity better than yield spread. Using ARDL approach it is found that there is significant and negative long-run relationship between short term interest rate and growth of industrial production index. Also by using error correction mechanism the short run effects of short term interest rate on change in growth of production index is analyzed. It is found that any short-run deviations from equilibrium are cleaned up in the long-run.
The following study consists of six parts. In the first part the theories of yield curve are discussed. Second and third part consists of detailed literature survey about the relationship between term structure of interest rate and inflation, and real economic activity. In the fourth part the effects of policies on predicting power of term structure is discussed. In the fifth part it is conducted an empirical investigation of term structure and real economic activity for Turkey. The last part includes the concluding remarks and directions to the future research.
6
2. THE TERM STRUCTURE OF INTEREST RATE
As risk structure of interest rate (default risk, liquidity, income tax etc.) play important role for level of interest rate, length of time to maturity also do. At a given time, all other things being equal, the existing relationship between interest rate on and terms to maturity of different securities is known as term structure of interest rate or yield curve.
Figure 1: Positively sloped yield curve Figure 2: Negatively sloped yield curve
Yield curve can be classified into three different shapes: upward sloping, flat and downward sloping which is usually referred as inverted yield curve. It is upward sloping when short term interest rate of security is lower than long-term of the same security and it is inverted when the reverse is true. Yield curve takes flat shape when level of interest rate of security does not vary with time to maturity. Also a yield curve can have more complicated shapes such as firstly upward then inverted or vice versa.
Four theories in term structure history have tried to explain the shapes of yield curve have taken. Market Expectation (pure expectation) Hypothesis which usually referred as expectation hypothesis, Segmented Market Theory (Culbertson, 1957), Preferred Habitat Theory (Modigliani and Sutch, 1966) and Liquidity Premium Theory which advanced by Hicks (1946) are all theories of term structure of interest rate. However, explaining term structure of interest rate, Expectation Hypothesis and Liquidity Premium are primarily investigated, it appears, theories in many financial texts.
7 2.1. Expectation Hypothesis
Expectation hypothesis does not belong to any one individual. As its routes goes to Irving Fisher (1986), most of underlying part of theory was not developed before late 1930’s, mainly developed by Hicks (1939) and Lutz( 1940) (Cox, at al, 1981:774).
Expectation hypothesis simply posits that, long term return of a security is purely determined by expected return of short term return of that security (Cuthberston, 1996: 578). In its most purified version, expectation hypothesis states that long term interest rate is average of expected short term interest rate that expected to be realized in securities life time.
It means that expectations about future interest rate truly carried on yield curve so if expectation about future interest rates changes the slope of yield curve also changes. For example, if it is expected that interest rate will increase in the future, then there will be an increase in slope of yield curve. This is partly because, such expectations cause an increase in demand of short term securities and decrease in supply of short term securities due to avoid getting low yield from long term securities and paying high interest rate in the future after an increase in interest rate (Harrison and Pierce, 1996: 45).
Expectation theory also explains a historical fact that is interest rates on securities with different time to maturity move together over time. A rise in short-term interest rate raises expectations of future short-term rates, because of the rising expected short term interest rates long-term interest rates rise also. Thus short term and long term interest rates move together (Mishkin, 1998:156).
One of the most important assumption lies under expectation hypothesis is that financial securities with different maturity date are perfect substitutes. So the only criterion of preference over a security is its expected return.
As it can be seen expectation hypothesis brings a simple explanation for behaviors of term structure. Because of this attractiveness characteristic, it has been subject to many texts in literature. For example, Cox, Ingersoll and Ross (1981), Attfied and Duck (1982), Jones and Roley (1983), Fama (1984), Mankiw and Miron (1986), Kugler and Brutta (1993), Cuthberston (1996), Longstaff (2000), Kozicki and Tinsley (2005) are some of them.
8
2.2. Segmented Market Theory
Segmented matket theory developed by Culberston (1957). He argued that the expectation hypothesis developed by Hicks (1939) and Lutz (1941), is theoretically unsatisfactory and inconsistent with postwar area and, tried to find a theory which satisfactorily explains the behaviors of term structure in both during 1920s and 1930s experiences by emphasizing the interconnection between debt markets, liquidity differences among securities with different maturities and changes in maturity structures (Culberston, 1957: 488).
According to this theory, securities with different maturities are not substitutes. There are four factors that lead to markets of securities with different maturity being segmented. Firstly, short term debts are more liquid than long term ones, and lenders who prefer more liquid asset choose short term depts. As there are limitations for borrowers to finance their dept in short term, this will cause lower yield and in the market preferences matched. The behavior of most lenders and borrowers are not governed by future expectation because of different planning period, characteristic of timing activity, unstable prices, existence of speculators, lack of perfect foresight and etc in market. Hence there exists particular market for particular time period. Thirdly, maturity structure of demand for funds changes over the time. Changing behaviors of maturity structure of demand for funds, makes maturity structure of lenders more important thus mobility of funds among securities disappear and this is a factor that effects the maturity structure of interest rate. Also such changes affect the liquidity premium and marginal cost of lending and they changed the effects of market on speculative actions. Finally but weakly, cost of acquiring, evaluating, liquidating and administrating of debt with different maturities may affects the rate of return (Culberston, 1957).
Segmented market theory explain term structure of interest rate by stressing existence of different demand and supply conditions for different maturities, and non-existence of substantiality among securities with different maturities. Empirical evidence generally supports the market segmentation theory at the short end of the yield curve (Park and Switzer, 1997, Simon, 1991, and Taylor, 1992), and researches remained scarce for longer dated debt. Also according to this theory, a yield curve generally should be upward sloping, because in general short term securities preferred to long term by lenders. This will lead to, a decrease in short term interest rate and increase in long term interest rate. However, this theory has
9
important deficiencies. It cannot explain the historical fact that short term and long term interest rate move together and also there is, as it examined in paper, many evidence that short term and long term interest rate have relations and different maturities shows substitutable character (Mishkin, 1998).
2.3. Liquidity Premium Theory
Liquidity premium theory (LPT) advanced by Hicks (1946), is a modified type of expectation hypothesis. LPT states that investors are usually risk averse so any investor demand long instead of short must be paid by a positive premium. Because of this risk aversion investors usually prefer to hold short term securities and thus to supply funds for long term they must be paid by a positive amount of time varying or risk premium. More generally theory declares that, long term interest rate is equal to average of expected short term interest rate plus a positive risk premium which carried on long term securities that long term yield more sensitive to interest rate than short term i.e. long term are more riskier. Because of this premium, forward rate is higher than one period short rate (Paleaz, 1997). Hicks made all these into three arguments. Firstly he argued that borrowers strongly prefer to borrow long to hedge themselves. Secondly in lender point of view, it is convenient to lend short for avoiding uncertainty and finally speculators fix this “constitutional weakness” by borrowing short and lending long but they must get positive premium for taken such risk during this process (Cox, at al, 1981:784).
LPT assumes that securities with different time to maturity substitute’s bun not perfect substitutes. According to this theory forward rate is a poor predictor of future spot rate because of the expected spot rate and risk premium. It explains the movement of short term and long term interest rate and also it brings very simple explanation for why yield curve usually upward sloping (Miskin, 1998).
2.4. Preferred Habitat Theory
In their paper Modigliani and Sutch (1966) states that all above three models have some deficiencies. They introduced a new theory which is preferred habitat theory by combining all three. The new theory states that long term interest rate is equal to average of expected short term interest rate that occur during life time of the security plus a premium which reflects
10
supply and demand conditions for that security. Hence spread depends primarily on expectation of long run changes but it also depends on supply and demand conditions.
It shares the notion of liquidity premium but has one fundamental difference. As liquidity premium states that because of the uncertainty carry long term securities, risk premium must be positive to make expected return equal; PHT posits that premium can be positive or negative. Modigliani and Sutch states that result of LPT correct only when the assumption of every lender prefer to turn their assets cash in the short run, which means they have short habitats. In reality as market segmentation theory states, different players can have different habitats. As someone needs his funds n period later i.e. he has n habitats, by staying short will cause uncertainty and until n period every period he faces with extra transaction cost. On the other hand by taking n period bond, and considering risk aversion possibilities, he can destroy uncertainty and extra transaction costs. Therefore a transactor stay his habitat and hedge himself, unless other maturities offers an expected premium compensate risk and cost of staying different habitats (Modigliani and Sutch, 1966 :182-185).
Preferred habitat theory stands on the assumption that different maturities are substitutable like liquidity premium and expectation theory. Investors have preferences over maturity, they have habitats, but also expected return is considered by these investors. PHT can explain easily the accompany movement of short term and long term interest rate, by the help of risk aversion argument it also explain why usually yield curve upward sloping (Miskin, 1998: 158-159, Harrison and Pierce, 1996: 46)
11
3. THE OBSERVED RELATIONS BETWEEN TERM STRUCTURE OF
INTEREST RATE AND INFLATION
Predicting inflation play an important role in wide range of economic decision including investment decision, monetary policy decision, wage negotiation etc. ( Kozicki, 1998). Especially, with the popularity of inflation targeting as a monetary policy, forecasting inflation gain extra importance.
One of the financial market indicators used by monetary policy makers to extract information on future interest rate and inflation developments are yield curves or term structures of interest rates. Since 90’s predicting inflation by using term structure of interest rate started to gain more attention. Especially the model of Mishkin (1990) becomes a guide for analyst and academicians. While the extent and sophistication of the uses of yield curves to extract information vary across central banks and over time, the forward looking nature of underlying bond prices has meant that monetary policy makers monitor the slope of yield curves as a general rule. Often, the information content of the term structure about inflation is defined as the ability of the slope of the term structure to predict changes in inflation rates. Specifically, if real interest rates and term premium are constant over time, the difference between short-term and long-term interest rates should be a linear function of expected inflation changes (Schich, 1999).
In Table 1, there are models that in literature trying to construct and discover the relations between terms structure of interest rate and inflation. It is depicted to models with used estimation techniques and the results.
12 Fama, F.E., (1990) 1 1 2[ (5 : ) ( )] 1 t T t T r t r t t T
π
+ + −π
+ =α α
+ − +ε
+ + 1 tπ
+ one year inflation rate (5 : )r t five-year bond rate
( )
r t one year bond rate
OLS Term structure show persistence forecast power
for changes in inflation rate. R is reached the 2 most highest value when two and three years changes in inflation rates.
Mishkin, F.S.
(1990)
,
, , ( )
where inflation rate nominal interest rate m,n show periods m n m n m n t t m n m n it it t i
π
π
α
β
ε
π
− = + − + OLS Term structure of very short interest rates (six or
less months) includes almost no information about inflation. However term structure of long maturities (9 and 12 month) have significant predictive power for inflation rate.
Jorion, P., and
Mishkin, F.S.,
(1991)
,
, , ( )
where inflation rate nominal interest rate m,n show periods m n m n m n t t m n m n it it t i
π
π
α
β
ε
π
− = + − + OLS In addition to U.S, previous model is applied,
Germany, Britain and Switzerland’s data. It is found that especially for longer maturities, term structure of interest rate has significant ability to forecast changes in inflation rates.
Author Name Model Estimation
technique
Results Table 3: Litereture on analysing relations between term structure and inflation
13 Tzavalis, E. and Wickens, M.R (1996) 0 1 0 1 1 2 3 1, 2 1 , ( ) (1) ( ) ( ) ( ) ( ) ( ) (2) inflation rate interest rate
real interest rate m,n show periods monetary regime du m n m n m t t t t t t m t t t t m n t t mn t t t t m m n t d B i i d L L s L i i i r i r d
π
π
α
α
ε
π
α
α
γ
π
γ
γ
δ
δ
π
ω
π
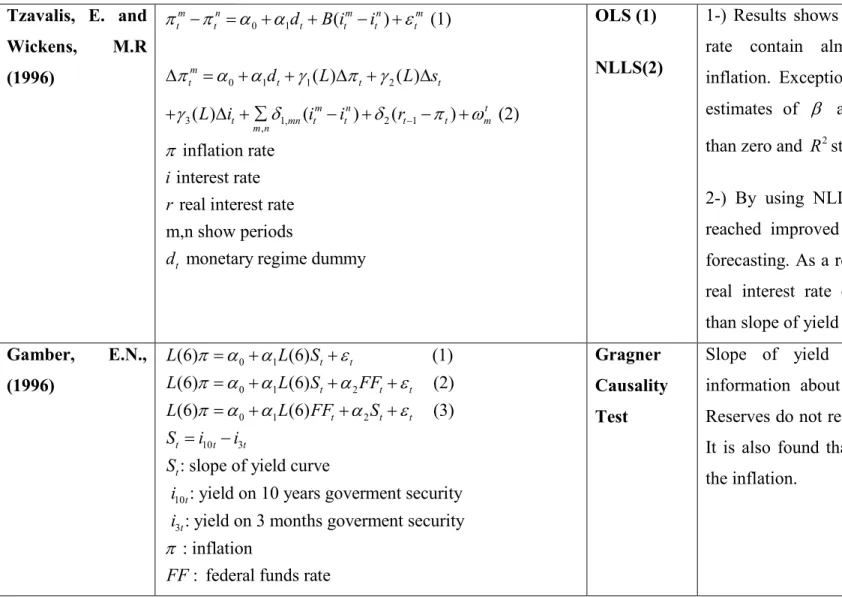
− − = + + − + ∆ = + + ∆ + ∆ + ∆ + ∑ − + − + mmy OLS (1) NLLS(2)1-) Results shows that term structure of interest rate contain almost no information about inflation. Exception of (m,n)=(12,3) and (12,6), estimates of β are not significantly different than zero and R still is very small. 2
2-) By using NLLS estimation technique, it is reached improved fit and better out of sample forecasting. As a result, however, it is found that real interest rate contain far more information than slope of yield curve about future inflation
Gamber, E.N., (1996) 0 1 0 1 2 0 1 2 10 3 10 3 (6) (6) (1) (6) (6) (2) (6) (6) (3)
: slope of yield curve
: yield on 10 years goverment security : yield on t t t t t t t t t t t t t t L L S L L S FF L L FF S S i i S i i
π α
α
ε
π α
α
α
ε
π α
α
α
ε
= + + = + + + = + + + = −3 months goverment security : inflation
: federal funds rate FF
π
Gragner Causality Test
Slope of yield curve includes independent information about inflation only when Federal Reserves do not react to changes in that variable. It is also found that FF is consistently estimates the inflation.
14 Estrella, A. and Mishkin, F. S. (1997) , 0 1 2 , 6 6 6 0 1 2 3 0 0 0 (2) : inflation rate (1)
:10 years goverment security rate :3 months t t k t t t k t t t i t i t i t i i i t S S CB Bill Bond S Bond Bill Bond Bill
π
β
β
β π
ω
π
α
α
α
α
ε
+ − − − − = = = = + + + = + + + + = −∑
∑
∑
goverment security rate :central bank rate
CB
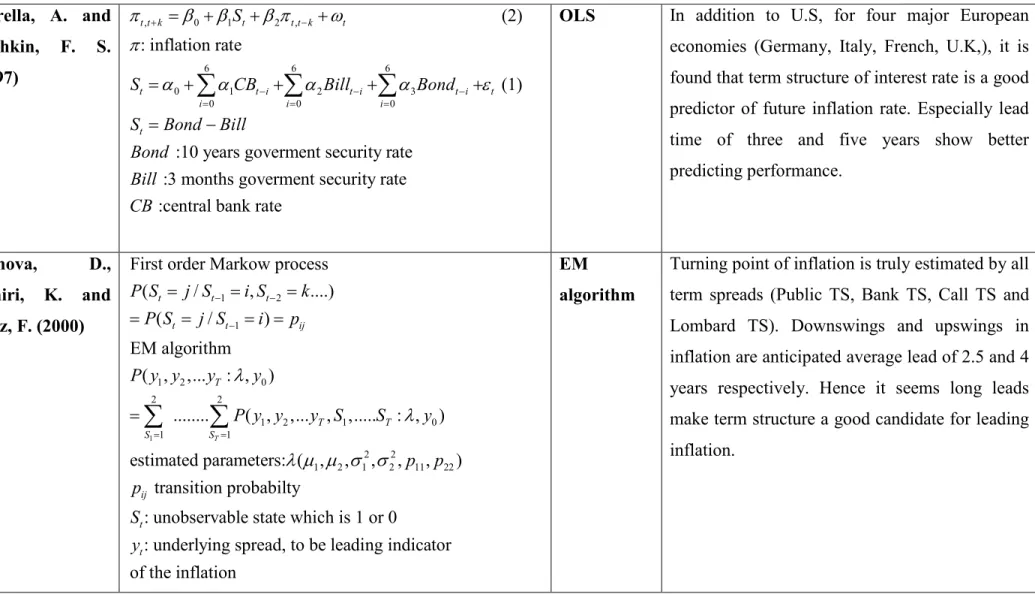
OLS In addition to U.S, for four major European
economies (Germany, Italy, French, U.K,), it is found that term structure of interest rate is a good predictor of future inflation rate. Especially lead time of three and five years show better predicting performance. Ivanova, D., Lahiri, K. and Seitz, F. (2000) 1 1 2 1 1 2 0 2 2 1 2 1 0 1 1 2 2 1 2 1 2 11
First order Markow process
( / , ....) ( / ) EM algorithm ( , ,... : , ) ... ( , ,... , ,... : , ) estimated parameters: ( , , , , , T t t t t t ij T T T S S P S j S i S k P S j S i p P y y y y P y y y S S y p p
λ
λ
λ µ µ σ σ
− − − = = = = = = = = = =∑
∑
22) transition probabilty: unobservable state which is 1 or 0
: underlying spread, to be leading indicator of the inflation ij t t p S y EM algorithm
Turning point of inflation is truly estimated by all term spreads (Public TS, Bank TS, Call TS and Lombard TS). Downswings and upswings in inflation are anticipated average lead of 2.5 and 4 years respectively. Hence it seems long leads make term structure a good candidate for leading inflation.
15 Şahinbeyoğlu, G. and Yalçın, C. (2000) , , , ( )
where inflation rate nominal interest rate m,n show periods m n m n m n t t m n m n it it t i
π
π
α
β
ε
π
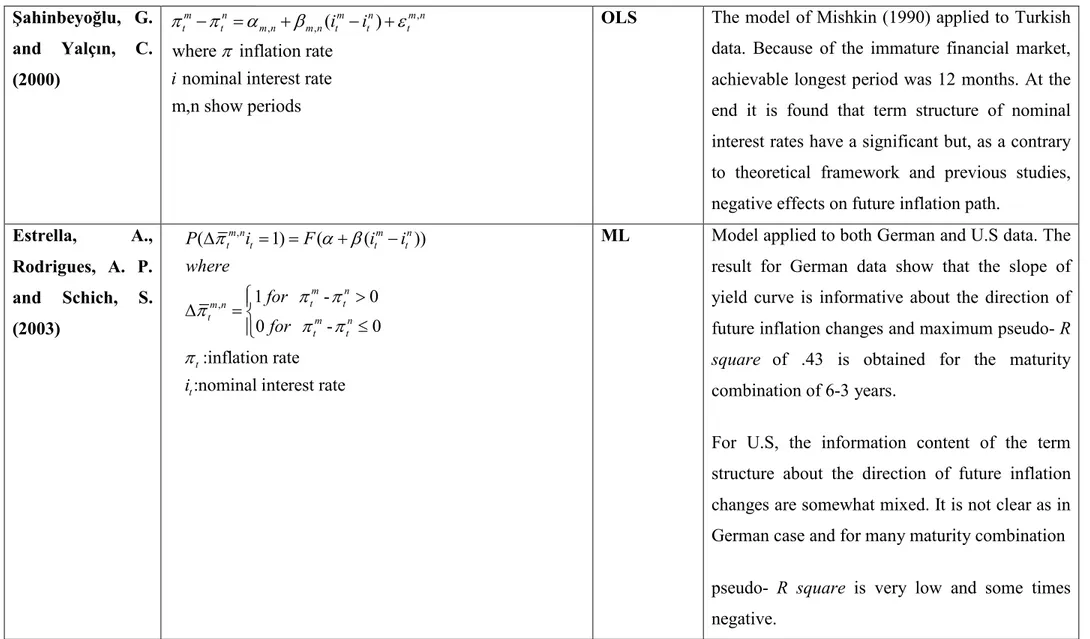
− = + − + OLS The model of Mishkin (1990) applied to Turkish
data. Because of the immature financial market, achievable longest period was 12 months. At the end it is found that term structure of nominal interest rates have a significant but, as a contrary to theoretical framework and previous studies, negative effects on future inflation path.
Estrella, A., Rodrigues, A. P. and Schich, S. (2003) , , ( 1) ( ( )) 1 - 0 0 - 0 :inflation rate :nominal interest rate
m n m n t t t t m n t t m n t m n t t t t P i F i i where for for i
π
α β
π
π
π
π
π
π
∆ = = + − > ∆ = ≤ ML Model applied to both German and U.S data. The
result for German data show that the slope of yield curve is informative about the direction of future inflation changes and maximum pseudo- R square of .43 is obtained for the maturity combination of 6-3 years.
For U.S, the information content of the term structure about the direction of future inflation changes are somewhat mixed. It is not clear as in German case and for many maturity combination
pseudo- R square is very low and some times negative.
16
Nagayasu, J.
(2002)
,
, , ( ) ,
where inflation rate that both WPI and CPI data differently is used
nominal interest rate real money growth
industrial production growth m,n show pe m n m n m n t t m n m n t t m n t t t t i i M y i M y
π
π
α
β
θ
ξ
ε
π
− = + − + ∆ + + ∆riods where m=2,3 and n=1
GMM Model support that there is relationship between term structure and change in inflation. Longer end of term structure predicts inflation path better than short end. Also it is found that CPI is more useful than WPI. Model estimated firstly without money growth and production growth. Then it is added to the model first money growth and then production growth. Adding money growth cause improvement in prediction but same is not true for production growth.
Telatar,
E.,
Telatar, F. and
Ratti,
R.
A.
(2003)
' t 1 2 2 2 0 1 2 ' + (1) where ~ (0, ) (2) ~ (0, ) ( ) with [1( )], [ , ] inflation ratenominal interest rate m,n show perio m n t t t t t t t t t t t m n t t t t t t X t N Q N ht h S X i i i
π
π
ξ ε
ξ
ξ
ω
ω
ε
σ
σ
σ
ξ
α β
π
− − = = + = + − = − = dsML Model applied to Turkish data which is generated
from second hand market. The results show that there is limited information in term structure of interest rate, especially at longer horizons, about Turkish inflation path. Except one-three months range, it is also found that the intercept coefficient in the relationship between change in inflation and term structure of interest rates is time-varying.
17
Tkacz, G. (2004)
2 2 , , , , , 2 1 , , , 2 1 , , , ( ) ( ) where 1 for ( ) 0 for ( ) and inflation rate interest rate m,n show periods m n m n m n m n t t m n m n t t m n t m n t t t m n t t m n t t m n m n m n m n m n m n i i d d i i i i d i i iπ
π
α
β
δ
γ
ε
τ
τ
α
δ
α
β
γ
β
π
− = + − + + − + − ≤ = − > = + = +ML Spreads which jointly incorporate information
from both short and long ends of the interest rate yield curve contain the most explanatory power for future inflation. Also it is found that significant thresholds emerge when the yield curve is relatively flat or inverted. For policy relevant horizon, relationship between long–short yield spreads and inflation changes is more pronounced when the spread is below some threshold, usually below 0.00.
18
Fama (1990) found that term structure of interest rate show persistence predicting power to change in inflation rate. Main aim of Fama is to reach the motive behind the behavior of term-structure forecasts of the one-year spot rate observed in Fama and Bliss (1987). He argued that this can be explained in terms of forecasts of the one-year inflation rate, the real return on one-year bonds, or both because of the spot rate is the sum of an expected inflation rate and an expected real return. He used log of Consumer Price Index as one year inflation rate and take the difference between 5 and 1 year government bond rate. Fama surprisingly reached that the yield spread shows more consistent power to forecast changes in the one-year inflation rate than changes in the spot rate.
The most influential model that aims to establish relations between term structure of interest rate and inflation rate was introduced by Mishkin. Mishkin (1990) established his famous model by using Fisher equation and show the causality of the relations between term structure of interest rate and inflation rate. The methodology of Mishkin is following;
( ) m m m t t t t Eπ =i −rr Fisher equation (1) expectation at time t
inflation rate from t to t+m
nominal interest rate at time t real interest rate at time t t m t m t m t where E i m period rr m period
π
= = = − = −By some manipulation we get known equation of Fisher which is
where is forecast error.
m m m m m m m
t it rrt t t t Et t
π = − +ε ε =π − π (2)
If n-period inflation is subtracted from equation 2 it can be examined the information in term structure about future inflation.
+ - where
m n m n m n m n
t t it it rrt rrt t t m n
π −π = − − + ε ε > (3)
19 , , , ( ) m n m n m n t t m n m n it it t
π
−π
=α
+β
− +η
(4) , , , 1 - -( - ) n m m n t t m n m n m n m n t t t t t where rr rrα
β
η
ε
ε
υ υ
= − = =Because as expectations is rationale (
ε
tm-ε
tn)is orthogonal to right hand side of regression and as terms structure of real rates are constant over time, (υ υ
tm- tn)disappear. If it is expected that expectations are rational and real interest rates remain constant over time the slope of equation can be consistently estimated by OLS.As a result rejection of
β
m n, = implies that term structure include information about future 0 inflation rate and term structure of real rates and nominal rates do not move one for one to each other. On the other hand refection ofβ
m n, = implies that slope of real term structure is 1 not constant over time, and nominal term structure provide information about real term structure (Mishkin, 1990).As an application Mishkin used U.S T-bill and government bond rate and he found that although term structure of short interest rates (six or less months) includes almost no information about future path of inflation, term structure of long maturities (9 and 12 month) have significant predictive power for inflation rate. He also argued that there is no evidence for changing in amount of information carried on term structure about future inflation as monetary regime change. Jorion and Mishkin (1991) the application of same methodology to some European economies and they reached familiar results. Estrella and Mishkin (1997) examine the relationship of term structure of interest rate to inflation, monetary policy and real economic activity. In examination to inflation Mishkin’s methodology is used. They conclude that term structure of interest rate has significant predictive power on both inflation and real activity and they also conclude that monetary policy is a determinant of term structure spread buy only determinant. Hence terms structure of interest rate is appropriate guide for conducting monetary policy.
20
Tzavalis and Wickens (1996) tried to forecast inflation using difference between m and n period long run Fisher equation as Mishkin (1990, 1991) did before. Model shows that term structure of interest rate has no predictive power on inflation. They argued that the usefulness of the term structure in forecasting inflation depends to a large extent on the information it contains about the error term in first model which is affected by the real interest rate, inflation innovations and a time varying term premium. To extract information in the term structure Tzavalis and Wickens construct an error correction model based on Johansen-type estimation of the variables that appear in the long-run Fisher equation. Findings show that the real interest rate seems to contain more information about future inflation than the slope of the yield curve may due to the sticky prices cause monetary shocks to have real effects in the short term, and nominal effects in the long term. The results also show that there is no support for that the longer the time horizon the more information the term spread contains about future inflation.
Gamber (1996), use combination of federal funds rate, terms structure of interest rate and output growth to exploit information about inflation. For four different time horizons which are determined based on monetary policy regimes, Gamber conduct six regression that each regression includes a constant, 6 lagged dependent variables and 6 lags of each of the other variables. He found that term structure of interest rate contains independent information about the inflation rate after Fed’s announced policy change in 1979 and then the lagged yield curve slope failed to predict inflation. It is also found that the fed funds rate is a consistent and better significant predictor of inflation.
Ivanova at al (2000) studied the comparative performance of a number of interest rate spreads as predictors of the German inflation and business cycle in the post-Bretton Woods era. They used the two-regime Markov-switch model that regarded as a nonlinear filter which allows the dynamic behavior of the economy to vary between expansions and recessions in terms of duration and volatility. The results show that turning point of inflation can truly estimated by all term spreads. Especially long leads make term structure a good candidate for leading inflation.
Sahinbeyoğlu and Yalçın (2000) and Telatar at al (2003) try to extract information about inflation in Turkish economy by using term structure. Şahinbeyoğlu and Yalçın (2000) used exactly the same methodology of Mishkin. They found that found that term structure of nominal interest rates have a significant but, as a contrary to theoretical framework and
21
previous studies, negative effects on future inflation path. They argued that the result may due to the immature financial market and lack of long maturities. On the other hand Taletar at al (2003) argued that because of the considered period is,1990–2000, a period of high inflation, high budget deficits, and political instability in Turkey, herewith the relationship between term structure of interest rate and inflation can be explained by using a time-varying-parameter model with Markov-switching heteroskedastic disturbances. The result of time varying model shows that there is limited information in term structure of interest rate, especially at longer horizons, about Turkish inflation path. It is also found that the intercept coefficient in the relationship between change in inflation and term structure of interest rates is time-varying.
Nagayasu (2003) add money growth and industrial production to Mishkin model to get improvement in prediction of Japanese inflation. He found that adding monetary growth cause improving in prediction but industrial production does not. On the other hand Trackz (2004) try to investigate threshold effect in relationship between inflation changes and terms structure of interest rate by relying on the foundation of Fisher equation. He used two-regime threshold model and found that significant thresholds emerge when the yield curve is relatively flat or inverted, and the relation between term structure and inflation is more obvious when spread below some threshold level.
Estrella at al (2003) use a binary response model to estimate relationship between term structure and inflation rate. They apply model to both German and USA economy. The result for German data show that the slope of yield curve is informative about the direction of future inflation changes for U.S, the information content of the term structure about the direction of future inflation changes are somewhat mixed.
22
4. THE OBSERVED RELATIONS BETWEEN TERM STRUCTURE OF
INTEREST RATE AND REAL ECONOMIC ACTIVITY
It is very important to have information about future economic activity for all economic actors to make optimal investment plan and accurate policy. Many interested parties have searched for the variables that can help to get information about the future economic conditions. Recent research, some of them detailed in the following part, under the light of expectation hypothesis have shown that the term structure of interest rate helps to predict future real economic activity (Nakaota, 2005).
There are two main explanations for this empirical relationship. First explanation indicate that, term structure of interest rate reflect the aspect of monetary policy. When monetary policy tight, this leads to increase in short term interest rate. As expectation hypothesis state increase in short term interest rate causes the increase in long-term interest rate. However, because of the thinking tight monetary policy is relaxed in future, the long-run interest rates increase less than short-run. Thereof yield spreads narrows even become negative. High interest rate reduces the investment in economy especially in interest rate sensitive sectors and then it is experienced economic slowdown. In consequence, negative or small yield spread associated with economic slowdown in the future. The other explanation takes into account the expectations. It is stated that, yield spread reflects the market expectation about future economic growth. When it is expected to future economic growth this means that the real income increase. To take advantage of future economic growth businesses make investment by borrowing and issuing more bonds. Since investments are longer term issued bonds will also be longer term. Therefore, supply of long term bond increase and this leads to decrease in price of this bonds. As price of bonds and yields negatively related, long term yields increase. Because of this, yield spread increase and yield curve become steeper. Consequently, steeper yield curve or broader yield spread associated with future economic growth (Bonser and Morley, 1997).
On this basis, many papers are devastated to examine the predictive power of term structure on future real economic activity. In Table 2, there are some models, with used estimation techniques and the results, that in literature trying to construct and discover the relations between terms structure of interest rate and future economic growth.
23
Author Name Model Estimation
technique
Results
Harvey, C.R. (1988) 1: 0 1 2 ,
: per capita growth in real consumption : spread between j maturity and one maturity expected real yields
: expected real interest rate
t t j j t t t j j t c S r c S r
α
α
α
ε
+ + + ∆ = + + + ∆OLS The results showed that term structure of real
interest rate contain information about
consumption growth. Also term structure is a better predictor of consumption growth than lagged consumption growth and lagged stock return both in out sample and in sample tests. Estrella, A. and
Hardauvelis, A. G. (1991)
, 0 1
, : Percentage change of GNP from to
: Spread between 10 year gov. bond and 3 month T-bill
: Other information variables
N t t k t i t t i t t k t t y S X y t t k S X
α
α
β
ε
+ + = + + + +∑
OLS It is found that term structure can predictcumulative change of GNP up to 4 and marginal changes of GNP up to 1.5 years. It also has extra predictive power over to lagged output growth, lagged inflation, leading indicators index and level of real short term interest rate which all included in model by variable X personally. Term structure shows success both in sample and out sample forecast. Results also direct that predictive power of it improves with parallel to forecasting horizon. Table 2: Litereture on analysing relations between term structure and real economic activity
24 Friedman, B. M. &
Kuttner, K. N. (1991)
4 4 4
1 1 1
: Natural logarithm of real GDP : Natural logarithm of price deflator
: First difference between 6 month commercial paper rate and 180 day T-bill ra
t i t i i t i i t i t i i i t t t Y Y P Z Y P Z
α
β
−δ
−λ
−ε
= = = ∆ = +∑
∆ +∑
∆ +∑
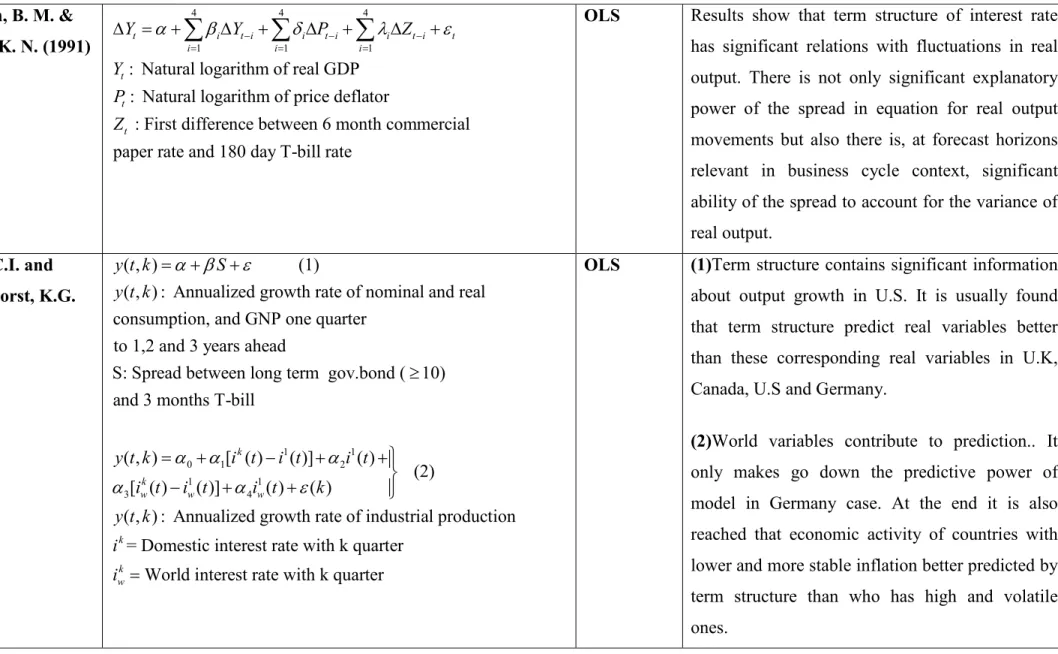
∆ + teOLS Results show that term structure of interest rate has significant relations with fluctuations in real output. There is not only significant explanatory power of the spread in equation for real output movements but also there is, at forecast horizons relevant in business cycle context, significant ability of the spread to account for the variance of real output.
Plosser, C.I. and Rouwenhorst, K.G. (1994)
( , ) (1)
( , ) : Annualized growth rate of nominal and real consumption, and GNP one quarter
to 1,2 and 3 years ahead
S: Spread between long term gov.bond ( 10) and 3 months T-bill
( y t k S y t k y t
α β
ε
= + + ≥ 1 1 0 1 2 1 1 3 4 , ) [ ( ) ( )] ( ) (2) [ ( ) ( )] ( ) ( )( , ) : Annualized growth rate of industrial production = Domestic interest rate with k quarter
World interest rate with k
k k w w w k k w k i t i t i t i t i t i t k y t k i i
α
α
α
α
α
ε
= + − + + − + + = quarterOLS (1)Term structure contains significant information
about output growth in U.S. It is usually found that term structure predict real variables better than these corresponding real variables in U.K, Canada, U.S and Germany.
(2)World variables contribute to prediction.. It only makes go down the predictive power of model in Germany case. At the end it is also reached that economic activity of countries with lower and more stable inflation better predicted by term structure than who has high and volatile ones.
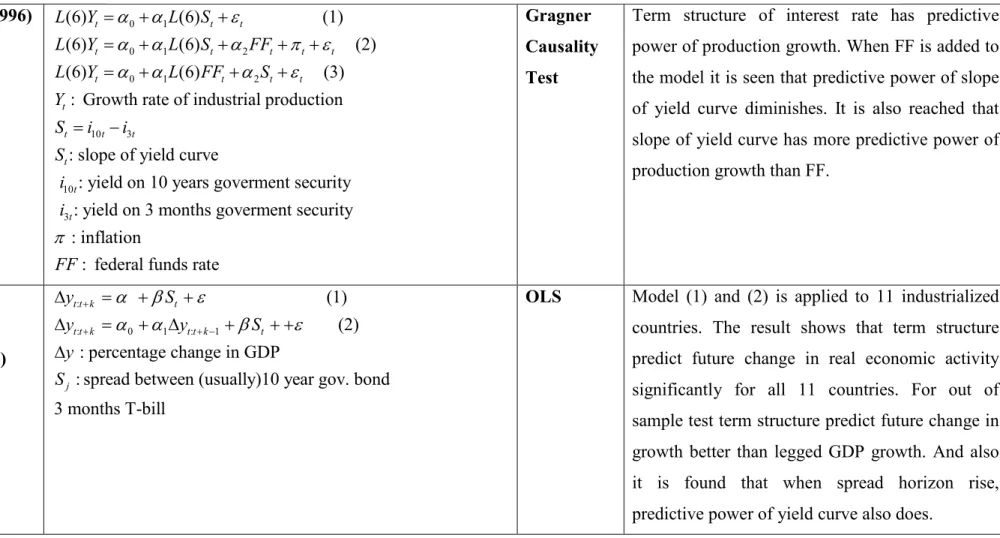
25 Gamber, E.N., (1996) 0 1 0 1 2 0 1 2 10 3 10 (6) (6) (1) (6) (6) (2) (6) (6) (3)
: Growth rate of industrial production
: slope of yield curve : yiel t t t t t t t t t t t t t t t t t t L Y L S L Y L S FF L Y L FF S Y S i i S i
α
α
ε
α
α
α
π
ε
α
α
α
ε
= + + = + + + + = + + + = − 3d on 10 years goverment security : yield on 3 months goverment security
: inflation
: federal funds rate
t i FF
π
Gragner Causality TestTerm structure of interest rate has predictive power of production growth. When FF is added to the model it is seen that predictive power of slope of yield curve diminishes. It is also reached that slope of yield curve has more predictive power of production growth than FF.
Bonser,C., Morley.R.N. and Morley.R.T(1997) : : 0 1 : 1 (1) (2) : percentage change in GDP
: spread between (usually)10 year gov. bond 3 months T-bill t t k t t t k t t k t j y S y y S y S
α
β
ε
α
α
β
ε
+ + + − ∆ = + + ∆ = + ∆ + + + ∆OLS Model (1) and (2) is applied to 11 industrialized countries. The result shows that term structure predict future change in real economic activity significantly for all 11 countries. For out of sample test term structure predict future change in growth better than legged GDP growth. And also it is found that when spread horizon rise, predictive power of yield curve also does.
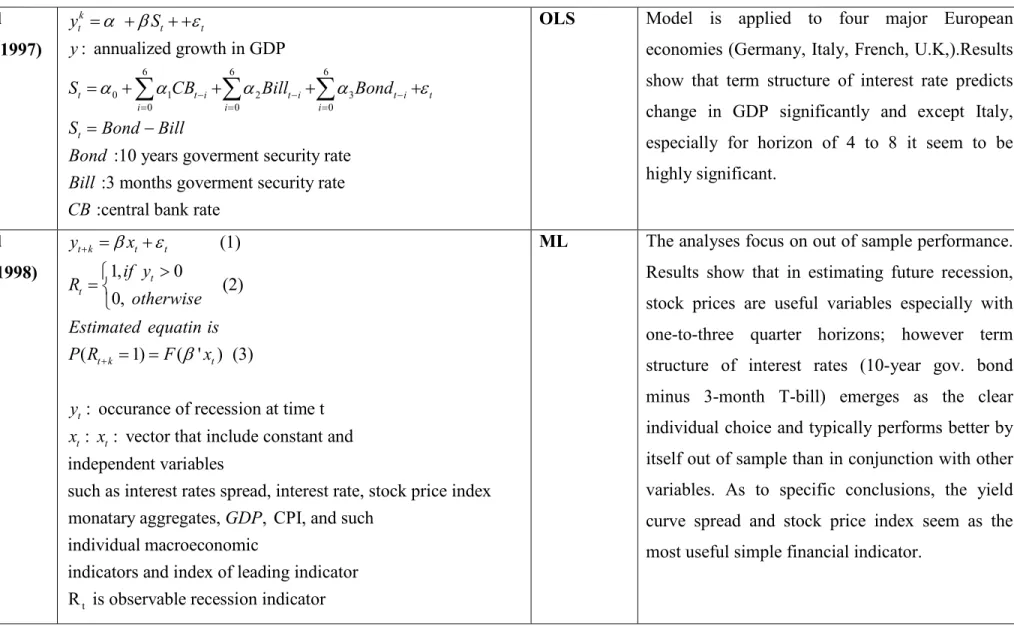
26 Estrella, A. and Mishkin, F. S. (1997) 6 6 6 0 1 2 3 0 0 0 : annualized growth in GDP
:10 years goverment security rate :3 months goverment security rate :central bank rat
k t t t t t i t i t i t i i i t y S y S CB Bill Bond S Bond Bill Bond Bill CB
α
β
ε
α
α
−α
−α
−ε
= = = = + + + = + + + + = −∑
∑
∑
eOLS Model is applied to four major European
economies (Germany, Italy, French, U.K,).Results show that term structure of interest rate predicts change in GDP significantly and except Italy, especially for horizon of 4 to 8 it seem to be highly significant. Estrella, A. and Mishkin, F. S.(1998) (1) 1, 0 (2) 0, ( 1) ( ' ) (3)
: occurance of recession at time t : : vector that include constant and independent variables s t k t t t t t k t t t t y x if y R otherwise Estimated equatin is P R F x y x x
β
ε
β
+ + = + > = = = tuch as interest rates spread, interest rate, stock price index monatary aggregates, , CPI, and such
individual macroeconomic
indicators and index of leading indicator R is observable recession indic
GDP
ator
ML The analyses focus on out of sample performance.
Results show that in estimating future recession, stock prices are useful variables especially with one-to-three quarter horizons; however term structure of interest rates (10-year gov. bond minus 3-month T-bill) emerges as the clear individual choice and typically performs better by itself out of sample than in conjunction with other variables. As to specific conclusions, the yield curve spread and stock price index seem as the most useful simple financial indicator.
27 Peel,D. A. and
Taylor, M P. (1998) : logarithm of real GDP at time t : difference between 10 year gov. bond and 3 months T-bill
: forecast error that has a moving avarage representation of order k-1 t k t t k t t t k y S y S
α
β
η
η
+ + +∆ = + + OLS It is found that term structure of interest rates has
significantly predicted the future change in cumulative GDP growth. Especially for five and six quarter horizon predictive power of term structure is greatest where %28 percent of variation in cumulative GDP is explained by term structure. Ivanova, D., Lahiri, K. and Seitz, F. (2000) 1 1 2 1 1 2 0 2 2 1 2 1 0 1 1 2 2 1 2 1 2 11
First order Markow process
( / , ....) ( / ) EM algorithm ( , ,... : , ) ... ( , ,... , ,... : , ) estimated parameters: ( , , , , , T t t t t t ij T T T S S P S j S i S k P S j S i p P y y y y P y y y S S y p p
λ
λ
λ µ µ σ σ
− − − = = = = = = = = = =∑
∑
22) transition probabilty: unobservable state which is 1 or 0
: underlying spread, to be leading indicator of the business cycle
ij t t p S y EM Algorithm
Results show that except bank-public spread all others based on the call rate predict all recessions with a comfortable lead, although they lagged some of the recoveries by a few months. On the other hand although bank-public spread detect the last two recoveries with an average lead of nearly 12 months, it generates a series of false signals. Table 2: Litereture on analysing relations between term structure and real economic activity (Contiune)
28 Galbraith, J.W., and Tkacz, G. (2000) 0 1 1 1 0 1 1 1
: the logarithm of real GDP
: logarithm of real government expenditure : function of the spread where
0, for I[ ]= 1, for where p k t i t i j t j t t t i j t t t t t t y y g y g
α
α
λ
λω
νϖ
ε
ω
ω
τ
ω
τ
ω
τ
τ
− − − − = = − − − ∆ = + ∆ + ∆ + + + > ≤ ≤ ∑
∑
1 1 1is the threshold parameter
: treshold variable that is I[ ]
t t t t
ϖ
ϖ
− =ω
−ω
− ≤τ
ML Model is applied to the G-7 countries data. It is concluded that term structure of interest rate predict change in output in all G-7 countries except Japan. Gertler, M. and Lown, C. S. (2000) 1 4 1 4 t : output gap
S : spread between high yield gov. bond and corresponding rate of highest quality firms
t t t t
t
Y Y S
Y
α β
−β
−ε
= + + + VAR Predictive power of spread between high yield
gov. bond and corresponding rate of highest quality firms, compared with spread between commercial paper rate and T-bill, term spread, oil prices, M2 growth and Federal funds rate by adding all variables four lagged to the VAR model. It is reached that, high yield spread has had significant explanatory power for the business cycle and also since mid 1980 the high yield spread outperforms the term spread, the paper-bill spread and the Federal Funds rate.
29 Chauvet,M. and Potter, S. (2002)
{
}
-1 1 1 ( ) (1) ( ) if Hitting probabilities ( , ) [ ] 1 [ ] (2) [ ] [( ) / ]: represents the state of the econ
t k t K t n n n k n t K k n t K k s n t n t n t Y S t where t t t t t k S S where S S Y
α β
σ ε
σ
σ
π
α β
α β
α β
α β
σ
+ − − − + − + = = + + = < < = Φ + − Φ + Φ + = Φ +∏
t omyS : spread between the 10-year and 3-month T-Bill rates is the cumulative distribution function of the
standard normal distribution Φ
ML It is established more general specification of
standard probit model. It is found that this more general form has a much better in sample fit than the original probit model of EM.
As in all specifications, yield curve is signaling weak future economic activity in 2000-2001, it changes from model to model the strength of the recession signals. Estrella, A., Rodrigues, A. P. and Schich, S. (2003) ( , ) t t Model Linear ( ) (1)
y : cumulative growth, marginal growth i : nominal yield Probit Model ( 1) ( ( )) (2) R is recession indicator j k q n t t t j q n t k t t y i i P R F i i
α β
ε
α β
+ = + − + = = + − OLS MLLinear model significantly predict the both marginal and cumulative growth for both Germany and U.S. It is also concluded that marginal results diminishes as forecast horizon increase but cumulative result become better as horizon lengthen.
Probit model, although the results change for Germany and U.S, and marginal result cumulative result, predict recession significantly. One of the main conclusions is that there is no evidence of instability at any horizon, for any maturity combination, for either country.
30 Paya, I., Venetis, I. A.
and Peel, D. A. (2004) 1 t 0 0 1 1 1 1 t-d t y ( )(1 exp[ ( ) / ])
: log of seasonally adjusted real GDP
: spread between 10-year gov. bond and 3-month T-bill : slope parameter : location parameter : standart t t t d s t t t s s s s c y s c
α
β
α
β
γ
σ
ε
γ
σ
− − − − ∆ = + + + + − − + deviationNLS Threshold effects exist for a number of forecasting
horizons affecting the power of the spread as a leading indicator while linear or nonlinear specifications are not free of parameter time-variation. It is observed that when the spread was above the threshold, its effects on output growth are significantly lower and for medium run forecasting horizons it is insignificant.
Jardet, C. (2004)
1 1t
t
( )
: logarithm of the level of real monthly GDP at time t r : long term bond yield
i : short term interest rate k is forecast horizon k t t k t k t t y r i y
α β
− − − −η
∆ = + − + OLS The slope coefficient is strongly significant for all
horizons. In addition, according to the R square criteria, the largest predictive power is at the 1 year forecast horizon, where, 33% of the variation in the annual growth rate of GDP is explained by the slope of the yield curve. But after determining a break (securitization process) and dividing sample into two after break and before break, model reached different conclusion. Before break slope coefficient significant for all horizon, but after break slope coefficient not significant for all horizon anymore that highest R square observed is %16.
31 Bordo, M. D. and
Haubrich, J. G.
(2004)
4 ( )
: annual growth rate of real GNP at a quarterly frequency : spread between corporate bonds and commercial paper ( ) is a lag polynomial t t t t t Y S L Y Y S L
α β
γ
γ
+∆ = + + ∆ ML As a first, equation is estimated on the entire
sample (1875-1997), and then it is divided into sub sample and estimated. It is found that spread is well predictor of output growth and improves predictive ability of regression in sample results. However it does not show the same impressive performance for out of sample results.
Giacomini, R. and
Rossi, B. (2005)
: Changes in industrial production
: spread between long-term and short-term bonds
t k t t k t t Y S Y S
α β
ε
+ = + + + + ML It is considered various maturities, namely 5 and 3
years for the long rate and 1, 3 and 6 months for the short term rate. They found that terms structure of interest rate predict output changes but predictability vary over time.
Nakaota, H. (2005) 0 1 2 3
: the annualized industrial
production growth over the next k months : dummy variables on constants
: difference between 5-year government bond rate and the 1-month bond and
k t t t t t t t t y d S Sd y d S
α
α
α
α
ε
= + + + + debenture rate : dummy variables on spreadt
Sd
OLS Without structural break there seems no relation between term structure and future economic activity. With dummies, it is observed that the term structure of interest rate is helpful for forecasting real GDP growth up to 2 years ahead. Table 2: Litereture on analysing relations between term structure and real economic activity (Contiune)