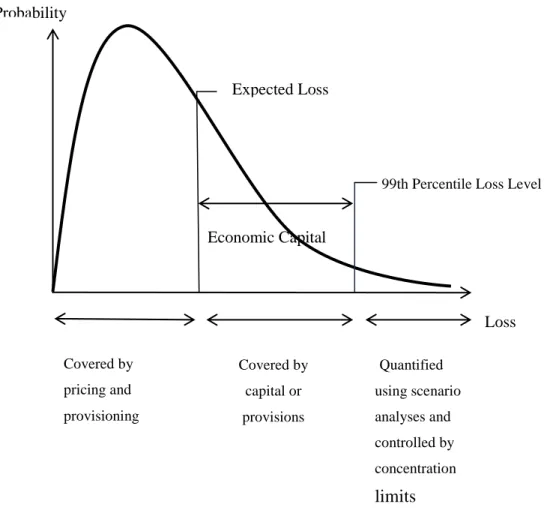
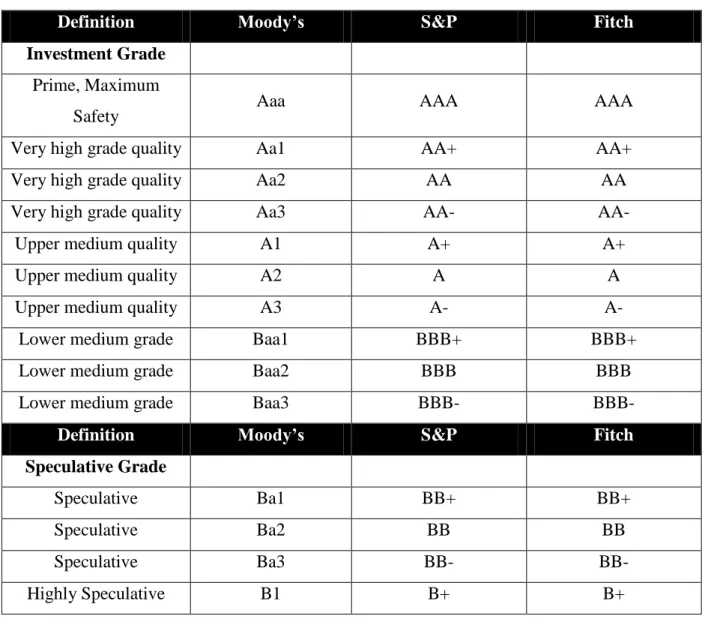
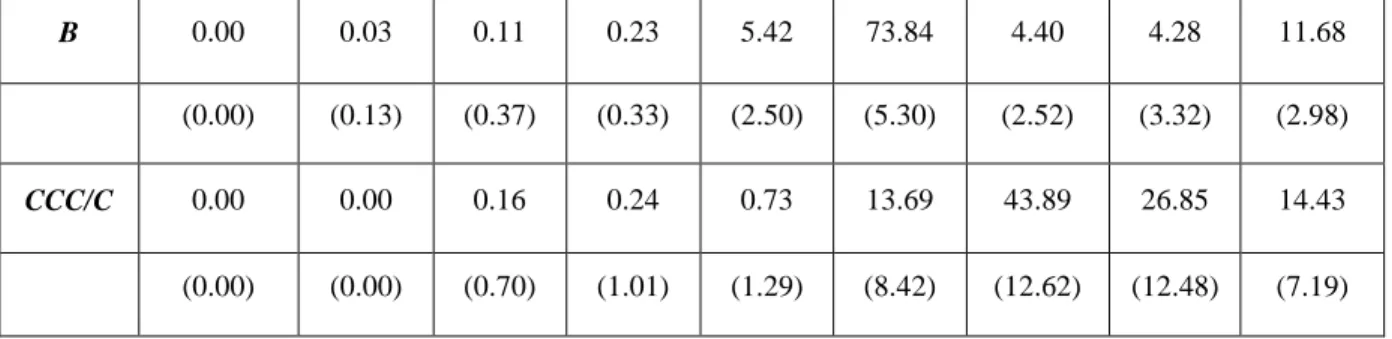
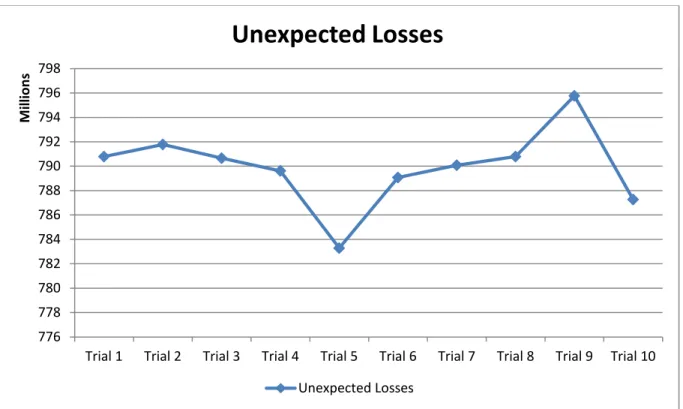
Credit Risk Modeling, Simulation and CreditMetrics Implementation
Tam metin
Şekil


Benzer Belgeler
The Teaching Recognition Platform (TRP) can instantly recognize the identity of the students. In practice, a teacher is to wear a pair of glasses with a miniature camera and
As a result, the postoperative mortality and morbidity rates vary for each patient, but operative risk scoring systems may help to get a more objective profile
For this reason, there is a need for science and social science that will reveal the laws of how societies are organized and how minds are shaped.. Societies have gone through
As a result of long studies dealing with gases, a number of laws have been developed to explain their behavior.. Unaware of these laws or the equations
Chemical kinetics, reaction rates, concentration from the factors affecting speed, rate equations, other factors affecting reaction rates, calculation of reaction
I Solve for the unknown rate, and substitute the given information into the
SONUÇ: FVL mutasyon s›kl›¤› ülkemizde,gen polimorfizminden söz ettirecek kadar yayg›n ol- makla birlikte tek bafl›na heterozigot mutant var- l›¤›
Tunç Okan’›n Otobüs bafll›kl› filmi masallar›n kaç›n›lmaz motiflerinden biri olan yolcu- luk motifi üzerine kurulmufl bir senaryoya sahiptir.. Bu çal›flma
