SOFTWARE TOOLS FOR VISUAL
ANALYSIS OF CANCER GENOMICS DATA
IN THE CONTEXT OF PATHWAYS
a thesis submitted to
the graduate school of engineering and science
of bilkent university
in partial fulfillment of the requirements for
the degree of
master of science
in
computer engineering
By
˙Istemi Rahman Bah¸ceci
August 2016
SOFTWARE TOOLS FOR VISUAL ANALYSIS OF CANCER GENOMICS DATA IN THE CONTEXT OF PATHWAYS
By ˙Istemi Rahman Bah¸ceci August 2016
We certify that we have read this thesis and that in our opinion it is fully adequate, in scope and in quality, as a thesis for the degree of Master of Science.
U˘gur Do˘grus¨oz(Advisor)
Erc¨ument C¸ i¸cek
Tolga Can
Approved for the Graduate School of Engineering and Science:
Levent Onural
ABSTRACT
SOFTWARE TOOLS FOR VISUAL ANALYSIS OF
CANCER GENOMICS DATA IN THE CONTEXT OF
PATHWAYS
˙Istemi Rahman Bah¸ceci M.S. in Computer Engineering
Advisor: U˘gur Do˘grus¨oz August 2016
Information visualization is concerned with effective visual presentation of ab-stract information, which reinforces human cognition. Graphs are structures that are well suited to represent relational information. Graph visualization is vital since the underlying relational information of the graph provides fine analysis and comprehension opportunities. Biological pathway visualization is one of the most popular areas, where graph visualization is highly favored.
Interactive analysis and visualization of cancer related pathways in the context of genomic data, such as those available through the TCGA project, might reveal valuable information for scientists about disease conditions and potential causes. As the size and complexity of such cancer pathways and associated genomic data increase, exchangeable in-silico representations and their effective, enhanced visualizations, and complexity management become crucial for effective analysis of such data to potentially discover cause-effect relations.
In this thesis, we designed and implemented software solutions to visualize cancer genomics data in the context of networks from simple gene interaction networks to process description diagrams within the cBioPortal for Cancer Ge-nomics (cBioPortal). cBioPortal is a popular web portal, getting about 60.000 visits globally per month, providing visualization, analysis and download of large-scale cancer genomics data sets. The network view in cBioPortal presents neigh-borhood of genes of interest. The alteration data is overlaid on the network with numerous ways to filter and manage complexity of the network (e.g. by alter-ation percentage or by type or source of the interactions). Upon demand, the user can obtain a more detailed, mechanistic view of the interactions among gene
iv
pairs, from Pathway Commons database with a live query using the SBGN pro-cess description notation. Finally, we also developed a new pathway visualization component, specifically for cancer pathways, using a uniform notation found in TCGA cancer publications. This tool also facilitates curation of pathways from scratch with support for collaborative editing.
Keywords: Bioinformatics, Biology, Pathway Visualization, Cancer Genomics Re-search, Complexity Management, Visualization Software, Web-based Software.
¨
OZET
KANSER GENOM˙IK B˙ILG˙IS˙IN˙IN YOLAKLAR
DAH˙IL˙INDE G ¨
ORSEL ANAL˙IZ˙IN˙I SA ˘
GLAYAN
YAZILIM ARAC
¸ LARI
˙Istemi Rahman Bah¸ceci
Bilgisayar M¨uhendisli˘gi, Y¨uksek Lisans Tez Danı¸smanı: U˘gur Do˘grus¨oz
A˘gustos 2016
Veri G¨orselleme soyut olarak temsil edilmi¸s bilginin, insan algısını destekleye-cek, etkili bir bi¸cimde g¨orsel olarak temsil edilmesini hedefler. C¸ izgeler ili¸skisel bil-ginin temsil edilmesi i¸cin tercih edilen uygun yapılardır. Bir ¸cizgenin g¨orsellenmesi ¸cizgenin yapısındaki ili¸skisel bilginin daha iyi anla¸sılması ve ¸c¨oz¨umlenmesi bakımından fayda sa˘gladı˘gı i¸cin ¨onemlidir. Biyolojik yolak g¨orselleme ¸cizge g¨orsellemenin yaygın olarak kullanıldı˘gı bir alandır.
Kanser ile ili¸skili yolakların ilgili kanser genomik bilgisi dahilinde interaktif bir bi¸cimde ¸c¨oz¨umleme ve g¨orsellenmesi, ¨orn: TCGA projesi dahilinde eri¸silebilen yolaklar, ara¸stırmacılar i¸cin hastalıkların olası nedenlerini anlamak, neden sonu¸c ili¸skilerini g¨ozlemlemek adına de˘gerli bilgiler sunar. Bu yolakların boyutu ve karma¸sıklı˘gı ve de ilgili genomik datanın boyutu arttık¸ca, daha etkili karma¸sıklık y¨onetim teknikleri, etkili ve geli¸smi¸s ¸cizge g¨orsellemeleri, bilgisayar ortamında kolay olarak payla¸sıma olanak sa˘glayan bilgi temsilleri ara¸stırmacıların neden sonu¸c ili¸skilerini daha iyi ¸c¨oz¨umlemesine imkan sa˘glar.
Bu tez ¸calı¸sması kapsamında genomik datanın yolaklar dahilinde g¨orsellenmesini sa˘glayan yazılım bile¸senleri tasarlanmı¸s ve ger¸cekle¸stirilmi¸stir. Bu yazılım bile¸senleri ¨ozel olarak ’cBioPortal for Cancer Genomics’ (cBioPortal) isimli, kanser ara¸stırmalarında yaygın olarak kullanılan web tabanlı bir yazılım dahilinde genlerin birbirleriyle ili¸skilerini g¨osteren d¨uzenleyici yolakları ve molek¨uler se-viyede prosesleri g¨orselleyebilmek i¸cin hayata ge¸cirilmi¸stir. cBioPortal d¨unya ¸capında aylık olarak yakla¸sık 60.000 ki¸si tarafından ziyaret edilen, b¨uy¨uk ¸capta kanser genomik bilgisinin g¨orsellenmesi, ¸c¨oz¨umlenmesi ve indirilmesi hizmetleri veren web tabanlı bir yazılımdır. cBioPortal dahilinde geli¸stirilen ¸cizge g¨orselleme
vi
bile¸seni, verilen bir gen listesinin , bir kanser tipi dahilinde etkile¸sti˘gi di˘ger genleri i¸ceren kom¸suluk yolaklarını kanser genomik bilgisiyle beraber etkili bir bi¸cimde g¨orselleyebilmektedir. Buna ek olarak ¸ce¸sitli filtreleme ve karma¸sıklık y¨onetimi olanakları da ( ¨orn: genomik alterasyona g¨ore ¸cizge k¨o¸selerini filtreleme, gen etk-ile¸simlerini alındı˘gı veri tabanına g¨ore filtreleme.) bu yazılım bile¸seni dahilinde hayata ge¸cirilmi¸stir.
Istenildi˘gi takdirde gen etkile¸simleri daha detayli bir ¸sekilde, molek¨uler se-viyede prosesler dahilinde Systems Biology Graphical Notation (SBGN) diye ad-landırılan bir notasyonla g¨orsellenebilmektedir. Bu detaylı proses seviyesinde olan yolak bilgisi Pathway Commons isimli yolak veritabanından bir sorguyla, SBGN proses dili diye adlandırılan bir dilde alınmaktadır.
Son olarak, ¨ozellikle TCGA yayınlarında sık¸ca rastlanan ve yaygın olarak kul-lanılan bir notasyonda yolakların g¨orsellenmesi ve olu¸sturulması amacıyla yeni bir yolak g¨orselleme aracı tasarlanmı¸s ve geli¸stirilmi¸stir. Bu yazılım aracı standard bir ¸cizge g¨orselleme ve olu¸sturma aracından farklı olarak, ortak olarak bir TCGA yola˘gının ara¸stırmacılarca olu¸sturulmasına olanak sa˘glamaktadır.
Anahtar s¨ozc¨ukler : Biyoenformatik, Biyoloji, Yolak G¨orselleme, Kanser Genomik Ara¸stırmaları, Karma¸sıklık Y¨onetimi, C¸ izge G¨orselleme Yazılımı , Web Tabanlı Yazılım.
Acknowledgement
I would like to express my deepest gratitude to my supervisor Prof. U˘gur Do˘grus¨oz for his guidance, support and all the things he has done for me. I can honestly say that it was a valuable experience for me since I learned too many things from Prof. Do˘grus¨oz about computer science and more importantly life.
I would like to thank to Assist. Prof. Dr. Erc¨ument C¸ i¸cek and Assoc. Prof. Dr. Tolga Can for reviewing and commenting on the manuscript of this thesis.
I would like to start my long list of thanks to the people that I seize the chance of knowing them during my graduate study in Bilkent University.
I would like to thank to Nail Akıncı, Necmi Acarsoy, Seher Acer, Umut A˘gıl, Shatlyk Ashyralyyev, Ebru Ate¸s, Aytek Aman, Sermetcan Baysal, C¸ a˘gda¸s Cen-giz, Merve C¸ akır, G¨ulfem Demir, Elif Eser, Can Fırtına, Beg¨um Gen¸c, Eren G¨olge, Emir G¨ul¨umser, G¨ulce Kale, Can Fahrettin Koyuncu, Caner Mercan, Muhsin Can Orhan, Mecit Sari, Metincan Siper, Ali Burak ¨Unal, Ba¸sak ¨Unsal and Bora Yal¸cıner for their precious support and friendship. Words are not strong enough to express the value that they have brought to my life. It was a great pleasure and joy knowing all of them.
I would like to indicate my special thanks to Simge Y¨ucel who is one of the most valuable people that I met in my entire life. It was a unique privilege to know her. I am grateful for her valuable support and everything she has done for me during the hardest times of my study.
My parents, Nefise and H¨useyin, and my brother ˙Ilteri¸s, I know this thesis and master’s study will not be complete without your support and your faith in me. Last but not least, I would like to indicate my greatest gratitude, respect and admiration to the founder of the Republic of Turkey, Mustafa Kemal Atat¨urk. He shed a light to path of mind, science and art by his great vision. I will always
viii
Contents
1 Introduction 1
1.1 Motivation . . . 3
1.2 Contribution . . . 4
2 Background Information and Related Work 6 2.1 Graph Visualization . . . 6
2.2 Biological Standards . . . 11
2.2.1 BioPAX (Biological Pathways Exchange) . . . 11
2.2.2 SBGN (Systems Biology Graphical Notation) . . . 12
2.3 Related Tools, Libraries, and Resources . . . 18
2.3.1 Cytoscape . . . 18
2.3.2 Paxtools . . . 22
2.3.3 Pathway Commons . . . 22
CONTENTS x
2.3.5 TCGA . . . 25
2.3.6 cBioPortal . . . 25
2.3.7 BioGene . . . 27
2.3.8 GraphML . . . 27
2.3.9 Google Real Time API . . . 27
2.3.10 SBGNViz.js . . . 28
3 Network Visualization Component in cBioPortal 30 3.1 Visualization of Gene Interaction Pathways with Genomic Data in cBioPortal . . . 31
3.2 Visualization of Process Level Details of Interactions in cBioPortal 39 3.3 Complexity Management Operations . . . 44
3.3.1 Complexity Management Operations for Gene Interaction Pathways . . . 44
3.3.2 Operations for Process Level Pathways . . . 52
3.4 Architecture . . . 58
4 TCGA Pathway Curation Tool 62 4.1 Visualization of TCGA Pathways . . . 64
4.2 Architecture . . . 69
CONTENTS xi
5 Conclusion 76
5.1 Future Work . . . 77 5.2 Availability . . . 78
List of Figures
1.1 Textual representation of a biological pathway (recruitment of re-pair and signaling proteins to double-strand breaks) in Pathway-Commons [1] . . . 2 1.2 Visual representation of a biological pathway (recruitment of
re-pair and signaling proteins to double-strand breaks) in Pathway-Commons [1] . . . 3
2.1 A sample directed (left) and undirected (right) graph with four vertices: A, B, C, D and four edges that connects vertices to each other. . . 7 2.2 A sample compound-graph with hierarchically nested vertices. . . 8 2.3 Force-directed graph layout model [2]. . . 10 2.4 A graph on the left before applying layout. Same graph after
applying force-directed graph layout. . . 11 2.5 BioPAX provides a standard language for the efficient exchange of
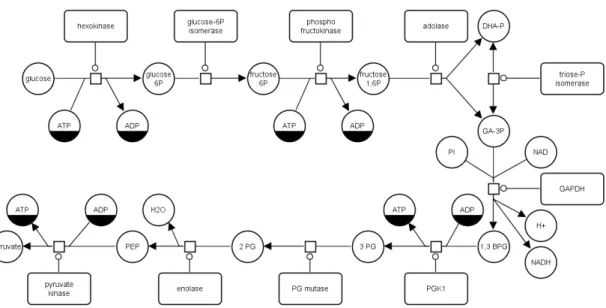
the pathway data [3]. . . 12 2.6 Metabolical pathway of Glycolysis visualized in PD. . . 15
LIST OF FIGURES xiii
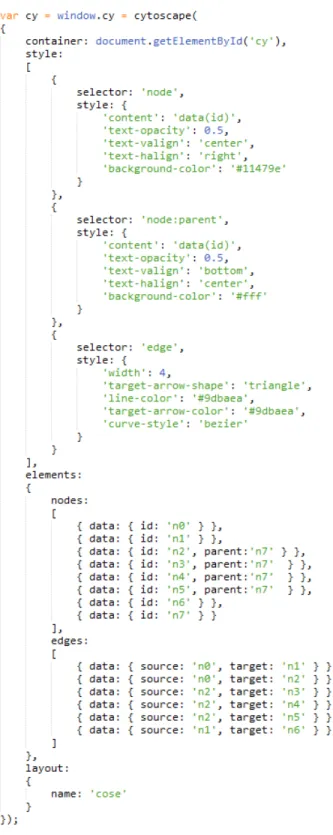
2.7 A sample metabolic process drawn in SBGN (left) and its associ-ated representation in SBGN-ML (right) . . . 16 2.8 Representation of SBGN PD language elements [4] . . . 17 2.9 An example of Cytoscape.js usage. . . 20 2.10 A sample node removal of a compound node by querying node
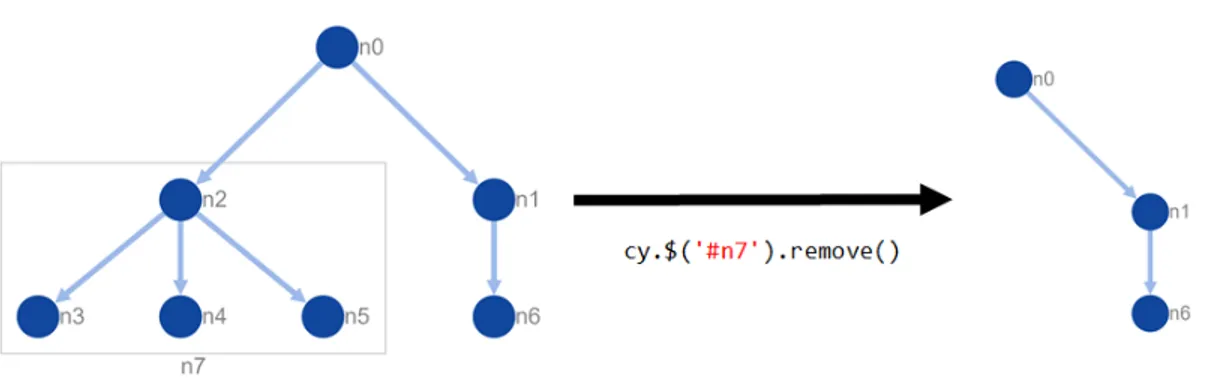
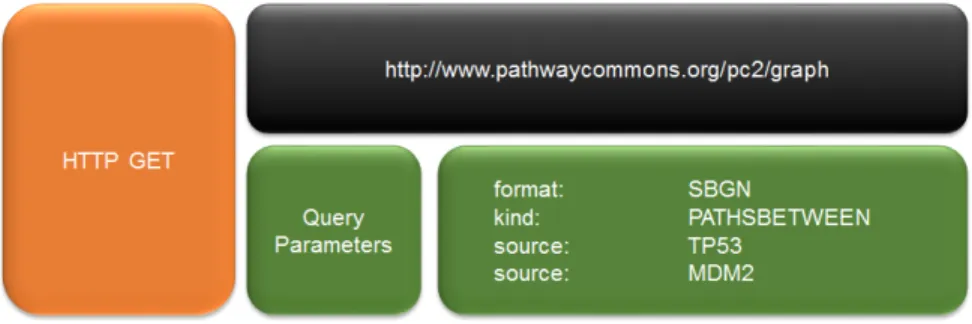
with id ‘n7’ and removing it from the graph that exemplifies ma-nipulation and query features of Cytoscape.js. This graph is also visualized using Cytoscape.js. . . 21 2.11 A sample graph query to the web service of Pathway Commons. . 24 2.12 cBioPortal web application home page. . . 26
3.1 Overview of visualization of gene interaction pathways with ge-nomic data in cBioPortal . . . 32 3.2 Overlay of genomic data on a node. Disks around the node
repre-sent genomic profiles in the context of copy number, mRNA expres-sion and Mutation. The node is colored according to the alteration frequency using a white to red color gradient . . . 33 3.3 Visualization of drugs targeting a gene in cBioPortal . . . 34 3.4 Color coding of interactions in cBioPortal network visualization
component . . . 36 3.5 Genes tab . . . 37 3.6 Detailed drug information of RB1 gene . . . 38 3.7 Process level interaction details of the interaction between MDM2
LIST OF FIGURES xiv
3.8 Flow of events regarding visualization of process level interaction
details . . . 42
3.9 Detailed gene information of MDM2 gene in SBGN view . . . 43
3.10 Topology related filtering operations . . . 45
3.11 Filtering operations in ‘Genes’ tab of network visualization tool in cBioPortal . . . 46
3.12 Filtering out neighbours of seed genes by alteration percent . . . . 47
3.12 Filtering out neighbours of seed genes by alteration percent (cont’d) . . . 48
3.13 Highlight operation that focuses on neighborhood of CDK4 gene. 49 3.14 Filtering views by interaction type and source. . . 50
3.15 Interaction filtering by type. . . 51
3.16 Expand collapse operations . . . 53
3.16 Expand collapse operations (cont’d) . . . 54
3.17 Hide Operation. . . 56
3.18 Highlight Operation. . . 57
3.19 High level architectural design of network visualization component in cBioPortal. . . 59
4.1 Visualization of PI3KRAS signalling pathway in the context of high-grade serous ovarian cancer (HGS-OvCa) which is provided as part of a TCGA research article [5]. . . 62
LIST OF FIGURES xv
4.2 Pathway in Figure 4.1 curated and visualized by our tool along with the genomic data representation. . . 63 4.3 Visual representation of node types in TCGA curation tool . . . . 64 4.4 Visual representation of interaction types in TCGA curation tool 65 4.5 Genomic data overlay features of TCGA pathway curation tool . . 66 4.6 Representations of graph topology and genomic data that the tool
accepts in simple tab delimited format. . . 67 4.7 Different context menus of the TCGA pathway curation tool. From
left to right: edge context menu, node context menu and root context menu is visualized. Note that root context menu appears when a right click is performed on the canvas where no node or edge exists under mouse pointer. . . 68 4.8 High Level Architecture of TCGA Pathway Curation Tool . . . . 70 4.9 Flow of events regarding addition of new elements in collaborative
usage mode . . . 73 4.10 Collaborative initialization of TCGA pathway curation tool . . . 75
Chapter 1
Introduction
Information visualization is concerned with effective visual presentation of ab-stract information, which reinforces human cognition by exploiting the advanced processing power of human visual perception system. It aims to provide intu-itive representations of abstract information allowing people to see, explore and comprehend large amount of information at one sight [6].
Graphs can be regarded as one of the most popular techniques in the field of information visualization. Graphs are abstract structures that are well suited to represent relational information. A graph represents some set of objects as nodes and relations among those objects as edges connecting nodes of the graph to each other.
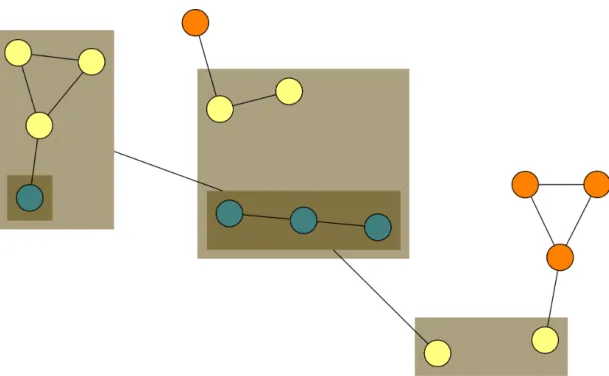
Graph visualization is vital since the underlying relational information of the graph provides fine analysis and comprehension opportunities compared to the textual representation of such data (Figure 1.1 and Figure 1.2). Biological path-way visualization is one of the most popular areas, where graph visualization is highly favored for efficient utilization and intuitive representation of valuable information that is embodied in pathways (Figure 1.2).
Figure 1.1: Textual representation of a biological pathway (recruitment of repair and signaling proteins to double-strand breaks) in PathwayCommons [1]
Figure 1.2: Visual representation of a biological pathway (recruitment of repair and signaling proteins to double-strand breaks) in PathwayCommons [1]
1.1
Motivation
A pathway represents series of molecular interactions in a cell that may lead to a certain product or a significant change in a cell. A pathway can trigger construction of new molecules such as protein, fat in a cell. Moreover, a pathway might play an important role in the context of the activation or deactivation of genes, signalling a cell to translocate.
It can be stated that pathway information captures valuable knowledge about molecular level biological processes. In this respect, pathways are vital in the context of genomic studies since they play important role about interpretation of increasing amount of biological data.
Interactive analysis and visualization of cancer related pathways in the context of genomic data, such as those available through the TCGA project [7], might reveal valuable information for the scientists about disease conditions and poten-tial causes. As the size and complexity of such cancer pathways and associated
genomic data increase, exchangeable in-silico representations and their effective, enhanced visualizations, and complexity management become crucial for effective analysis of such data to potentially discover cause-effect relations.
1.2
Contribution
To aid the research efforts in cancer research, we designed and developed software components to visualize biological pathways from simple gene to gene interaction networks to detailed molecular process level networks along with the cancer ge-nomics information.
Firstly, we provided a network visualization and analysis component for the popular cBioPortal web portal [8, 9]. cBioPortal facilitates analysis, visualization and download of large scale cancer genomics data sets. To enhance such features, a new visualization component is provided, which aims to visualize gene to gene interaction networks. Such networks represent neighborhood pathway of given set of genes of interest in the context of a specific cancer study. This component also features representation of genomic alteration data along with the useful features of filtering and managing the complexity in such gene to gene interaction networks. Secondly in order to support information provided by visualized neighbor-hood pathways, we provided a complementary view that is capable of visualizing molecular process level details of an interaction between two genes from such visualized gene interaction pathways. Detailed process level views of interactions are visualized in Systems Biology Graphical Notation Process Description lan-guage (SBGN-PD) [10]. To visualize such SBGN-PD pathways, we integrated our previously implemented SBGN-PD visualization component SBGNViz.js [11] to cBioPortal. We extended SBGNViz.js’ existing complexity management oper-ations with operoper-ations of expand and collapse. Expand and collapse operoper-ations aims to reduce the complexity that is brought by the molecular complex struc-tures and cellular compartments that frequently occur in SBGN-PD pathways.
Complex structures and cellular compartments are hierarchical compound struc-tures that can include other entities in them; therefore, they may increase the size of the visualized graph enormously which makes it hard to focus on content of interest and decreases utilization of the information embodied in such path-ways. Associated pathway information of an interaction of interest is obtained from Pathway Commons by a live query which returns the pathway in SBGN-ML format [12].
Pathway Commons [1] converts queried pathway information from BioPAX [3] format to SBGN-ML. To achieve such conversion popular Paxtools library is used in Pathway Commons. In the context of our work, we provided automated graph layout facility to the resulting SBGN pathways that Pathway Commons provides. Virtual representations of SBGN elements after the conversion from BioPAX models do not include any geometric information regarding geometric boundaries and location of SBGN elements, in the obtained pathways. This is an important aspect considering the efficient visualization of SBGN pathways. In this repsect, we contributed to the Paxtools [13] library in a way that geo-metric boundaries of SBGN elements are estimated according to content of such elements. Regarding location information, we integrated CoSE [14] algorithm to Paxtools for automated graph layout of such SBGN pathways.
Finally, we also designed and developed a new pathway visualization compo-nent, specifically for cancer pathways, using a uniform notation found in TCGA cancer publications. This tool provides visualization and interactive editing of TCGA pathways according to a notation that respects the conventional represen-tation of such TCGA pathways. The tool also lets users to import experimental cancer genomics data that can be overlaid on the visualized pathways. Besides visualization and interactive creation capabilities, this tool facilitates curation of such pathways in a collaborative manner using the Google Real Time technol-ogy [15]. This technoltechnol-ogy is behind popular collaborative document editing tool Google Docs.
Chapter 2
Background Information and
Related Work
In this section related work and background information are discussed.
2.1
Graph Visualization
A graph G = (V, E) is an abstract structure which represents a non-empty set of vertices (nodes) V and a set of edges E where each edge e ∈ E connects a vertex pair (u, v) where u, v ∈ V .
A directed graph is a graph G = (V, E) where each edge e ∈ E is associated with a direction from a vertex u to vertex v where u, v ∈ V (Figure 2.1). Sim-ilarly, an undirected graph is a graph graph G = (V, E) in which edges are not associated with any direction information (Figure 2.1).
Figure 2.1: A sample directed (left) and undirected (right) graph with four ver-tices: A, B, C, D and four edges that connects vertices to each other.
A graph G = (V, E) is said to be a compound graph if it contains any vertex v such that it includes other vertices and edges inside itself (Figure 2.2).In com-pound graphs there exist parent-child relationships, where a comcom-pound vertex v is the parent of the vertices inside itself. Descendant vertices of compound vertex v is said to be children vertices of v. Children vertices of vertex v might in turn be a compound vertex which represents additional level of nesting (Figure 2.2). Compound graphs are well suited for the biological network visualization, where nested entities are present in the topology of networks.
Figure 2.2: A sample compound-graph with hierarchically nested vertices.
Graphs are commonly used to represent relational information among a set of objects. Topological structure of a graph defines this relational information by presenting the set of objects as nodes and the relations between those objects as edges that links nodes in the graph to each other.
Since the graphs are abstract structures, they are not associated with any kind of geometric information which is required for visualization. However visu-alization of graphs are vital in the sense that underlying relational information of the graphs provide fine analysis and comprehension opportunities. Biological pathways and social networks are some of the most popular areas where graph visualization is heavily used. In this respect, as the complexity and size of rep-resented relational information in graphs increase, the demand for effective and powerful graph visualization techniques also increases for fine analysis and com-prehension of underlying relational information.
Graph visualization is concerned with the geometric representation of graphs. Such geometric representation of a graph is attributed by location, width, height,
and border along its topological structure. Many aesthetic properties like color of nodes, transparency, node shapes, edge arrow shapes etc. can be regarded as aspects of graph visualization. In other words, any visual attribute that has an influence on viewers’ comprehension might be considered as an aspect of graph visualization.
Besides the aspects discussed above, there is another vital concept in graph visualization that is known as graph layout. Graph Layout is concerned with ef-fective utilization of the relational information that is embodied with the visual representation of a graph via creating aesthetically pleasing views of such graphs according to the viewers’ perspective. Even though the concept of aesthetically pleasing views might change from a person to person, there is some commonly accepted criteria for an aesthetically pleasing visualization of a graph in the lit-erature [16]. According to the criteria a good layout favors following aesthetics:
• Vertices should be distributed evenly in the canvas where the graph is vi-sualized.
• Edge crossings should be minimal. • Edge lengths should be uniform.
• If there exists symmetries in the graph topology, such symmetries should be inherited by graph layout.
• Area that graph uses should be minimal.
Aesthetics above are competitive with each other and often leads to trade-offs where optimality of one aesthetic prevents other. Therefore, it is stated that optimization problems regarding the aesthetics above are NP-Hard [17] and therefore, general approaches introduced in the context of graph-layout algorithms are heuristic algorithms.
It can be stated that graph visualizations that do not adhere to the aesthetics discussed above can be associated with a bad graph layout and could potentially
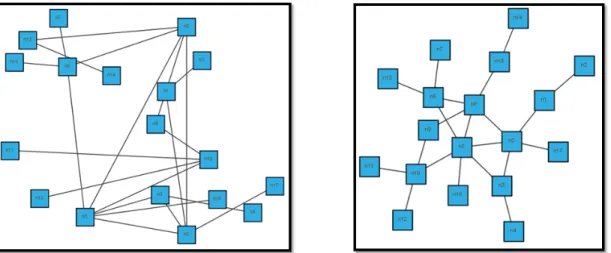
confuse users, whereas a good layout would be more effective in terms of clearly presenting underlying relational information of a graph (Figure 2.3).
Force-directed graph layout algorithms are a class of graph layout algorithms that are regarded as one of the most flexible and successful algorithms in literature [18]. Also known as Spring Embedders, such algorithms are heuristic algorithms and model graph topology as a physical system, where every vertex is represented as a charged particle thus causing a repulsive force to each other and every edge is represented as a spring that is exerting an attractive force to the node pair that share this edge (Figure 2.4).
The graph is laid out as the consequence of repetitive iterations where repul-sive and attractive forces are calculated for each vertex and vertices are moved accordingly until simulated system reaches a stable state where the total energy in the system is minimized (Figure 2.4).
Figure 2.4: A graph on the left before applying layout. Same graph after applying force-directed graph layout.
2.2
Biological Standards
2.2.1
BioPAX (Biological Pathways Exchange)
BioPAX is an effort to standardize the biological pathway representation at molecular and cellular level [3]. As the consequence of the research and de-velopment in the field of bioinformatics, amount of pathway data has increased enormously with the diverse communities which in turn, led the emergence of vast number of related tools, huge pathway databases for the utilization of pathway data. However, this situation caused inconsistent representation of pathways in different databases which prevented effective analysis and biological discov-ery opportunities. BioPAX overcomes the problem of fragmented, inconsistent
pathway data by providing a standard language which provides efficient stor-ing, exchanging and reuse of information of pathways such as signalling path-ways, gene-regulation pathpath-ways, protein protein interaction pathways in an uni-fied manner. With the help of BioPAX, integrity of representation of pathways in the community is increased that brings more opportunities to the field of pathway research 2.5.
Figure 2.5: BioPAX provides a standard language for the efficient exchange of the pathway data [3].
2.2.2
SBGN (Systems Biology Graphical Notation)
As stated in the previous section, BioPAX was an effort to standardize the format in which the pathways are stored, exchanged without ambiguity. It is obvious that without a proper unified format, ambiguity and complexity decreases the efficiency.
Circuit diagrams and Unified Modeling Language (UML) [19] diagrams are two examples of standard visual languages. They provide regularity by reducing ambiguity and complexity. Moreover they improve communication of complex information by means of software tool support.
Systems Biology Graphical Notation is introduced to resolve the ambiguity and the complexity that merits from non-existence of a unified graphical notation in the context of visual representation of biochemical interactions [20, 21]. It is de-veloped by a community of biochemists, modelers and computer scientists. The hope for SBGN is to represent networks of biochemical interactions in a stan-dard, unambiguous way to provide precise representation, storage, sharing and visualization opportunities according to the needs of diverse biology community.
SBGN consists of three languages that complement each other:
• Process Description Language (PD): The SBGN Process Description lan-guage aims to represent all biochemical entities and their interactions in the context of molecular processes. The diagrams visualized in SBGN PD language gives insight about how entities transform from one form to an-other as a result of different interactions. It plays important role regarding visualization of temporary states of molecules in the process of biochemical reactions.
• Entity Relationship Language (ER): The SBGN Entity Relationship lan-guage aims to reveal information about an entity and the relationships in which such an entity participates. Different than SBGN PD, it aims to provide information about the influences of entities to each other in the network, regardless of the temporary transformation states of entities as consequences of biochemical processes.
• Activity Flow Language (AF): The SBGN Activity Flow language is inter-ested in the flow of information between biochemical entities in a network. It is not interested in representing information about the state transitions or entities. Instead it focuses to the activities among entities by ignoring biochemical process details like entity states and processes or relationships.
As discussed, PD diagrams are dedicated to visualize the transformation of molecular entities from one form to another by series of biochemical processes. Change is the essence of such diagrams.
PD language defines its graphical elements as illustrated in Figure 2.8. To represent any physical or conceptual entity in a PD diagram, Entity Pool Nodes (EPN) introduced in PD language. Entity Pool Nodes consists of six node types that describes physical entities: macromolecule, simple chemical, nucleic acid fea-ture, multimer, unspecified entity and complex. Source and sink, and perturbing agents are conceptual entities in PD [10].
As stated change is the essence in the PD diagrams. In this regard EPNs are transformed to each other as the consequence of processes. Since processes are vital in PD, there exists different graphical definition for processes: omitted process, uncertain process, association, dissociation, and phenotype as seen in Figure 2.8.
Complex and Compartment nodes are compound nodes in PD diagrams. Com-plex node represents an entity that may contain other entities: macromolecules, simple chemicals, multimers, even other complexes as a compound structure. Compartment node represents a logical or physical structure such as a cellular compartment which can be composed of EPNs.
PD also offers auxiliary units that can decorate other EPNs, that provide additional information which may be useful to the viewer:
• Unit of Information: Represents abstract information about the function-ality of the entity in the diagram that this unit of information belongs. • State Variable: Represents different physical or informational
configura-tions.
• Clone Marker: Used to indicate that decorated entity is cloned in the dia-gram.
There is also definition for the edges that connect PD nodes together. There exists nine edge definitions in PD. Symbols at the extreme ends of the edges define the meaning of edges in PD (Figure 2.8).
Figure 2.6 illustrates a Glucose, entity which initially participates in the metabolic reaction of Glycolysis with an ATP entity, where Hexokinase act as an inhibitor and as result of first process one ADP and Glucose 6P entities are produced. Here, Glucose and ATP molecules are linked with straight lines to the process to represent consumption, where Hexokinase is connected with a straight line and a ring at the end of this line to emphasize catalysis, where lines with arrows at their ends represent production of Glucose 6P and ADP
Figure 2.6: Metabolical pathway of Glycolysis visualized in PD.
Although SBGN is a promising effort in terms of representing biological path-way information in a unified and unambiguous path-way, it does not offer any standard about how the diagrams should be stored, exchanged between the tools that aims to support SBGN. Thus, to overcome this problem, SBGN-ML was developed which is a dedicated, lightweight XML-based file format [12]. SBGN-ML format includes all necessary geometric information for drawing, positioning of SBGN entities in the corresponding diagrams (Figure 2.7). SBGN-ML is provided as part of LibSBGN project. Hope for the LibSBGN is to provide a standard li-brary that simplifies the storage, exchange and validation of SBGN diagrams in the context of software tools [22]. LibSBGN offers following useful features:
• Representation of SBGN maps programatically. • Reading / writing in the SBGN-ML format.
• Validation of semantical and syntactical correctness of SBGN-ML format . • Conversion to other formats such as SBML and BioPAX.
• Support for Java and C++.
Figure 2.7: A sample metabolic process drawn in SBGN (left) and its associated representation in SBGN-ML (right)
Figure 2.8: Represen tation of SBGN PD language elem en ts [4]
2.3
Related Tools, Libraries, and Resources
2.3.1
Cytoscape
Cytoscape is an open-source software platform which mainly focuses on developing network visualization tools. Cytoscape platform offers three popular network visualization software:
• Cytoscape: Desktop application for network analysis and visualization. • CytoscapeWeb: Web based network visualization and analysis library. Built
on older web technologies (Flex and ActionScript) [23, 24].
• Cytoscape.js: Successor of CytoscapeWeb, built using modern web tech-nologies along with new features for network visualization and analysis.
Cytoscape [25] is an open source desktop application which is developed to visualize molecular interactions and biological networks. In addition to visual-ization features, Cytoscape provides easy integration of additional information such as annotations and gene expressions along with the visualized networks. Cytoscape was initially developed for biological research but with its rich analy-sis, visualization and integration features it is adopted as a generic platform for complex network analysis and visualization.
CytoscapeWeb [26] is web based graph visualization and analysis component. CytoscapeWeb was an effort to create a simplified version of Cytoscape for the web platform, not as a complete end user application, but as an independent compo-nent that could be used by developers. Core technology behind CytoscapeWeb is based on Flex framework and ActionScript programming language, both emerged as a result of Adobe Flash[27] technology. ActionScript and Flex were popular before HTML5 and they were powerful components for creating interactive appli-cations such as drawing appliappli-cations and games. As a result of its core technolo-gies CytoscapeWeb is easy to integrate to any web application. Besides its core
technology, CytoscapeWeb provides a JavaScript API (Application Programming Interface) for client side integration, which makes it possible to manipulate and customize the visualized networks as desired.
Cytoscape.js [28] is the successor of CytoscapeWeb. Developement of HTML5 brought many improvements in terms of infrastructures for creating interactive web applications without requiring any third-party dependencies such as Adobe Flash. As a conseuqence of these improvements, Cytoscape.js has been developed as an open source graph theory library for network analysis and visualization which is purely built using native web technology JavaScript. Cytoscape.js in-herits all the functionality featured in CytoscapeWeb and offers more advanced, improved functionality that makes it easy to access and manipulate network topol-ogy, network style with the help of modern web technologies. It is funded by NRNB (Natural Resource for Network Biology) [29] and NIH (National Insti-tutes of Health) [30].
Cytoscape.js’s architecture is built upon event-driven architecture model with a central core API. Cytoscape.js core provides all fundamental functionality as a JavaScript API regarding accessing and manipulating the graph topology, chang-ing the style of visualized graph, applychang-ing layout, viewport related functions like zooming, panning etc. According to the central core design, there are several ex-tensions which communicates with core by means of notifications to the core about required actions on the visualized graph. The core manages all the handling of notifications generated by extensions by performing actual desired actions. Client side usage follows the same behaviour as extensions through the JavaScript API of the core of Cytoscape.js but with a difference that client side can not directly communicate with extensions. Cytoscape.js also provides a flexible interface for custom plugin implementation and registration that enables the custom solutions regarding needs of the clients.
Cytoscape.js can be integrated to any web application with ease by its simple interface. Basically, Cytoscape.js can be initialized on a DOM (Document Ob-ject Model) element in a HTML page using initialization function cytoscape(). Cytoscape.js works with JSON format [31], which makes it easy to define graph
elements and corresponding style of the network, layout options and meta options along with some callback functions at initialization (Figure 2.9).
Moreover, the manipulation and accessing features of Cytoscape.js is highly promising. Cytoscape.js follows selector and chaining conventions for querying and manipulating visualized networks. These conventions are well known in the web literature because of the JQuery framework [32] and CSS language which are well known for a typical web developer. A sample query and manipulation is illustrated in Figure 2.10.
Figure 2.10: A sample node removal of a compound node by querying node with id ‘n7’ and removing it from the graph that exemplifies manipulation and query features of Cytoscape.js. This graph is also visualized using Cytoscape.js.
Besides rich accessing and manipulation features, there exists functionality for changing the visual style of the graph, animation and applying graph layout. More importantly, Cytoscape.js includes functionality regarding graph theoretic algorithms such as breadth-first search, Kruskal’s algorithm, accessing siblings of a node, populating neighbourhood of a node. Having such features greatly simplifies access and manipulation of graph topology and reduces complexity for developers.
Hierarchical structures in network visualization is frequently favored in the fields such as biological pathway visualization for visualizing molecular com-plex structures, cellular compartments. In this regard, Cytoscape.js supports compound nodes and offers corresponding functionality to access, traverse, and perform operations on compound nodes which makes Cytoscape.js a convenient
choice for visualizing networks that include hierarchically structured information (Figure 2.10).
2.3.2
Paxtools
Although BioPAX provided a unified standard for representation, exchange and reuse of pathway information, complex structure of BioPAX with its huge number of properties and classes makes it difficult to develop software tools that manip-ulates BioPAX. In this regard, Paxtools is introduced as an open-source Java library which includes effective algorithms and methods for common and easy but time consuming tasks of reading, writing, searching, merging, comparing and transforming pathway information between formats [13].
Paxtools provides conversion of pathway information from BioPAX format to SBGN-ML, Simple Interaction Format (SIF) and Gene Set Enrichment Analysis (GSEA) format [33].
Since BioPAX is an adopted format by community, Paxtools becomes a handy choice for providing useful functionality in terms of manipulating data in BioPAX format which promotes the improvement of software tools and systems that are dedicated to the exploration, analysis and visualization of pathways.
2.3.3
Pathway Commons
Pathway Commons [1] provides access to the collection of publicly available path-way information that is gathered from multiple pathpath-way databases. Pathpath-way Commons currently includes 42.000 pathways, 1.350.000 interactions from 22 pathway sources [34].
Pathway Commons offers a web service for scientists, that provide query-ing facilities of rich pathway information that is collected from different path-way databases in BioPAX and Proteomics Standards Initiative - Molecular
Interaction(PSI-MI) formats [35]. The web service offers a web API by which developers can query the rich collection of pathway information and download resultant pathway information in various formats that are adopted by the com-munity.
Web service API of Pathway Commons offers an important feature of graph queries. Graph queries are vital for finding connections and neighborhoods of elements, such as the paths between two genes of interest or the neighborhood of provided genes of interest. The queried entities and type of the resulting pathways can be specified while making query requests to the web API. Supported graph types are as follows:
• COMMON STREAM: Common downstream or common upstream of a specified set of entities.
• NEIGHBORHOOD: Neighborhood of provided set of entities. • PATHS BETWEEN: Paths between provided set of entities.
• PATHS FROM TO: Paths from specified set of entities to target set of entities.
The output format of resulting pathways is BioPAX format by default but it can be specified optionally :
• BINARY SIF: Simple Binary Interaction Format • BIOPAX: BioPAX RDF/XML Format
• EXTENDED BINARY SIF: Extended Simple Binary Interaction Format • GSEA: Gene Set Expression Analysis Format
• JSONLD: JSONLD format
Figure 2.11: A sample graph query to the web service of Pathway Commons.
2.3.4
ChiLay
Chisio Layout (ChiLay) is an open source Java library. It includes useful graph layout algorithms that provide automatic layout for flat, simple, compound and clustered graphs. ChiLay currently includes Compound Spring Embedder (CoSE) algorithm for compound graphs [14], Circular Spring Embedder (CiSE) for clus-tered graphs [36], SBGN-PD Layout algorithm for providing a specialized layout algorithm for the domain specific requirements of the SBGN PD graphs [37]. These algorithms are developed and maintained by our research group. ChiLay also offers several other popular layout algorithms for both directed and undi-rected graphs, such as Sugiyama Layout [38].
ChiLay was designed to be used both as a local Java component that can be integrated to any Java application or remotely by a web application by sending graph structure in a XML format to a dedicated server where ChiLay is de-ployed. This dedicated server in return sends the laid out graph structure to the client in the XML format.Details about remote usage, ChiLay architecture and customization features can be found in ChiLay programmer’s guide [39].
As part of our work, we integrated ChiLay to the Paxtools as a local depen-dency which is responsible for providing graph layout support for the SBGN-PD pathways that are converted from BioPAX format to SBGN-ML format. This graph layout support is crucial for the community. Paxtools is used by Pathway
Commons to provide pathways in SBGN therefore automated graph layout for such pathways utilizes the associated information embodied in SBGN diagrams.
2.3.5
TCGA
The Cancer Genome Atlas (TCGA) is a collaborative effort that is supported by the National Cancer Institute (NCI) [40], the National Human Genome Research Institute (NHGRI) [41] and National Institutes of Health (NIH) [30]. TCGA provides genomic alteration information about 33 types of cancer. It is stated that TCGA data set contains more than two petabytes of genomic data which is publicly available and helps cancer research community to understand, prevent, diagnose and treat the cancer.
Hundreds of samples for each specific type of cancer is being analyzed by TCGA. Analyzing many different samples from many different patients gives better insight about what makes one cancer distinct from another cancer. This reveals vital information since diverse set of samples will be powerful in terms of observing the cancer behaviour and the different response of treatments for a specific cancer. Trailing down the outcomes of genomic data of TCGA, especially in the context of pathways, researchers are able to understand cancer better which leads development of more effective, specialized opportunities for cancer patients.
2.3.6
cBioPortal
cBioPortal is a popular web portal, getting about sixty thousand visits globally per month, featuring visualization, analysis and download of large-scale cancer genomics data sets [8, 9]. Given a set of genes of interest and associated cancer study, the portal provides graphical summaries of gene specific information from multiple platforms, network visualization and analysis, survival analysis, patient specific queries, and software programmatic access. Web interface of cBioPortal makes it easy to access complex genomic profiles without requiring expertise on
bioinformatics which facilitates biological advancements.
Figure 2.12: cBioPortal web application home page.
The cBioPortal for Cancer Genomics was originally developed at Memorial Sloan Kettering Cancer Center (MSK) [42]. The software is now developed and maintained by a multi-institutional team, consisting of MSK, the Dana Farber Cancer Institute [43], Princess Margaret Cancer Centre in Toronto [44], Children’s Hospital of Philadelphia [45], The Hyve in the Netherlands [46], and our research group i-Vis at Bilkent University in Ankara, Turkey [47].
2.3.7
BioGene
BioGene [48] is a simple web service which lets scientist to make queries about a specific gene and provides description about its gene function, its aliases, its chromosome location. BioGene primarily uses Entrez Gene, a gene database provided by NCBI [49].
2.3.8
GraphML
GraphML is an XML based file format that is an effort to represent graph structure information in a common format for the efficient exchange of graphs. GraphML provides a core language that can represent structural properties of a graph and it lets addition of application-specific data which makes it a flexible and efficient choice for the exchange of graph information. Directed, undirected and compound graphs can be represented using GraphML [50].
2.3.9
Google Real Time API
Google Real Time API [15] is a technology that is behind the popular collabo-rative document editing tool Google Docs [51]. Google offers this technology as a public JavaScript API which basically lets developers to design a shared data model, just like a local in-memory data model. API offers data structures and objects such as lists, maps, objects and even custom JavaScript objects that can be used as part of a shared data model. Shared data model of each application is stored in a document called collaborative document which is stored in the Google Drive [52] folder of each user. Changes to the shared data model of an application on behalf of a user is propagated to the all users of the application remotely.
The behaviour of the shared data model objects are just like local in-memory JavaScript objects with a slight difference that a collaborative Google Real Time API data model may change as a result of modifications of other users rather than
current local user. To achieve this purpose applications using Google Real Time API attaches listeners to a collaborative document which stores collaborative data model, so that changes on shared data model is synchronized among all users.
Whenever associated shared data model of collaborative document is modified, the API sends a representation of the change to the server so that the change can be recorded in the collaborative document and synchronized to other collab-orators. These changes are named as ‘mutations’ in the context of Google Real Time API. Design of the API provides automatic conflict resolution which means that users will not face problems about edit conflicts.
Google Real Time API makes sure that data models are ”eventually consistent” which means that when all the collaborators stop editing, eventually every user will have the same shared data model in their application. However, Google Real Time API does not guarantee in what order the changes will be delivered to the users or when all the users see the changes.
In our work, we are using Google Real Time API for allowing construction of TCGA pathways in a collaborative manner.
2.3.10
SBGNViz.js
SBGNViz.js [11] is a web based interactive visualization and analysis compo-nent for process description maps in SBGN. SBGNViz.js is purely written in JavaScript. It is capable of visualizing the pathway information stored in SBGN-ML format. SBGNViz.js provides full visualization support for SBGN-PD lan-guage including compound structures such as molecular complexes and cellular locations, using nested drawings. In addition to the visualization capabilities, it features loading and saving pathways in SBGN-ML format, automated graph layout support, zooming and scrolling on viewport, deletion of nodes and edges, and highlighting of desired portions of visualized pathways. On demand this tool also provides, detailed properties and external references to macromolecules or nucleic acid features that may be fetched from the BioGene service.
SBGNViz.js uses Cytoscape.js as core network visualization component. How-ever, since Cytoscape.js offers generic shapes for representing nodes like ellipses, rectangles, etc. it is not possible to represent visual characteristics of SBGN el-ements that are defined in SBGN-PD language using such generic shapes that Cytoscape.js provides. Thus, SBGNViz.js provides an extension renderer that is registered to Cytoscape.js to visually represent the SBGN specific elements. SBGNViz.js also provides conversion of pathway information between JSON and SBGN-ML format, since JSON is accepted format by Cytoscape.js, SBGNViz.js parses pathway information from SBGN-ML and generates a JSON object that includes all pathway information. Similary, for exporting visualized pathways SBGNViz.js converts such JSON representation of pathway to SBGN-ML for-mat.
Chapter 3
Network Visualization
Component in cBioPortal
This chapter focuses on design and implementation of software tools that aim to visualize cancer genomics data in the context of networks from simple regula-tory networks to process description diagrams within the cBioPortal for Cancer Genomics (cBioPortal), which is a popular web portal, providing visualization, analysis and download of large-scale cancer genomics data sets.
In this respect, we designed and developed a network visualization and analysis component in cBioPortal that presents neighborhood pathway of genes of interest in the context of specific cancer study. The genomic alteration data is overlaid on the visualized network with numerous ways to filter and manage complexity of the network (e.g. by alteration percentage or by type or source of the interactions).
Upon demand, the user is allowed to obtain a more detailed, mechanistic view of the interactions between gene pairs in such gene interaction networks, from Pathway Commons database with a live query that returns network of interest in the SBGN-PD notation in SBGN-ML format.
3.1
Visualization of Gene Interaction Pathways
with Genomic Data in cBioPortal
One of the core feature that we have provided for cBioPortal focuses on efficient and intuitive visualization of neighborhood pathway of given genes of interest, where interactions among such genes is visualized along with genomic alteration data in the context of a specific cancer study.
Figure 3.1: Ov erview of visualization of gene in teraction p ath w a ys with genomic data in cBioP ortal
Figure 3.1 provides a sample visualization of neighborhood pathway of gene set of MDM2, CDKN2A, MDM4, TP53 which is altered in 30 samples out of 88, in the context of Adrenocortical Carcinoma (TCGA, Provisional) study. The visualized pathway consists of 54 genes in total where 50 of these genes are most frequently altered neighbour genes of MDM2, CDKN2A, MDM4, TP53 out of total 329 neighbours.
Genes are represented using circular node shapes in the visualized networks. Circular nodes with thick borders represent nodes that are in user provided gene set. These nodes are called as seed nodes since they can be considered as seed of the obtained gene neighborhood in the visualized network. Circular nodes with normal borders are called as linker nodes since they connect seed nodes and other linker nodes to each other in the neighborhood.
Figure 3.2: Overlay of genomic data on a node. Disks around the node represent genomic profiles in the context of copy number, mRNA expression and Mutation. The node is colored according to the alteration frequency using a white to red color gradient
By default, each gene in the network is color coded along a white to red color gradient, indicating the total frequency of alteration across the selected cancer study set where deeper red indicates higher frequency of alteration (Figure 3.2). The exact genomic data displayed on the network depends on the genomic
profiles that user selected. For instance, user can chose to include mutation, copy number and mRNA expression profiles to visualize. We overlay such genomic data by rendering three additional disks around the genes in the network. Disk that is placed at the top of a gene is dedicated to visualize copy number profile of a gene in terms of Amplification, Homozygous Deletion, Gain and Hemizygous Deletion. Disk that is placed on the bottom left of a gene represents mRNA expression profile of the gene in terms of Up-Regulation and Down-Regulation. The disk that is placed at the bottom right of a gene is dedicated to visualize the mutation profile of a gene (Figure 3.2).
Figure 3.3: Visualization of drugs targeting a gene in cBioPortal
Drugs that are targeting genes in neighborhood pathways are also visualized by our tool. Note that drugs that are approved by FDA are filled in orange color whereas not FDA approved ones are not filled (Figure 3.3).
The interaction types are derived from the BioPAX to binary interaction map-ping rules defined within Pathway Commons. They are encoded by different edge colors in visualized pathways [53]. The interaction types are:
• Controls-state-change-of : First gene controls a reaction that changes the state of the second gene.
• Controls-transport-of : First gene controls a reaction that changes the cel-lular location of the second gene.
• Controls-phosphorylation-of : First gene controls a reaction that changes the phosphorylation status of the second gene.
• Controls-expression-of : First gene controls a conversion or a template re-action that changes expression of the second gene.
• Catalysis-precedes: First gene controls a reaction whose output molecule is input to another reaction controlled by the second gene.
• In-complex-with: Genes are members of the same complex.
• Interacts-with: Genes are participants of the same molecular interaction. • Neighbor-of : Genes are participants or controllers of the same interaction. • Consumption-controlled-by: The small molecule is consumed by a reaction
that is controlled by a gene
• Controls-production-of : The gene controls a reaction of which the small molecule is an output.
• Controls-transport-of-chemical : The gene controls a reaction that changes cellular location of the small molecule.
• Chemical-affects: A small molecule has an effect on the gene state. • Reacts-with: Small molecules are input to a biochemical reaction.
• Used-to-produce: A reaction consumes a small molecule to produce another small molecule.
Figure 3.4: Color coding of interactions in cBioPortal network visualization com-ponent
Besides the canvas where the network is visualized, there exists complexity management functionality for visualized pathways, help content for usage instruc-tions and documentation, and inspector content for more detailed information about a selected gene, interaction and drug from visualized pathways.
In this respect, there exists a menubar above visualization canvas which con-sists help content about visualization properties of network elements, topology and view related complexity management operations such as hiding selected ele-ments, showing only selected eleele-ments, highlighting neighbour of selected nodes, toggling genomic data discs. It is also possible to perform graph layout to visu-alized network along with the capability of tuning layout parameters of applied graph layout algorithm CoSE (Figure 3.5).
There exists a panel right to the visualization canvas which also includes ad-ditional functionality in different tabs.
Figure
3.5:
Genes
Genes and Interactions tabs provide complexity management operations re-garding genes and the interactions in the network. Details about the complexity management operations that these tabs provide will be elaborated in Section 3.3.2.
Figure 3.6: Detailed drug information of RB1 gene
Details tab provides detailed information about the genomic profile of a se-lected gene in network. This inspector provides additional gene information which is obtained by a query to BioGene [48] service whenever a gene is double clicked on canvas. Similarly, whenever a drug or interaction is selected from visualized network, additional information about selected drug or interaction is provided in
the same tab (Figure 3.6).
Help tab includes useful information about the usage details, visualization details and interaction details.
3.2
Visualization of Process Level Details of
In-teractions in cBioPortal
Gene interaction pathways derived from neighborhoods of seed genes visualize useful information about interactions of genes in the context of a specific cancer study. As discussed in Section 3.1, this view focuses on visualizing binary interac-tions among genes along with genomic alteration profiles of genes in the network. This view ignores the molecular process level interaction details of genes which could support insight about the role of interacting genes in the cancer study of interest.
In this regard, we provided a complementary view that is dedicated to visualize the molecular process level description of an interaction between gene pairs in the gene interaction pathways. To achieve this, we integrated an improved version of SBGNViz.js [11] to cBioPortal for visualizing, analyzing such complementary process description maps in SBGN. This SBGNViz.js instance is improved in a way to provide many additional useful features such as advanced complexity management operations.
Figure 3.7 illustrates process level details of MDM2 and RAD17. Figure 3.7a indicates that there is an interaction between these two genes, where RAD17 controls state change of MDM2. Upon request, view in Figure 3.7b can be ob-tained representing associated interaction details in SBGN, where the pathway information is taken by a live query to the Pathway Commons web service. In this process level view, we observe that RAD17 belongs to a complex molecule structure, which catalyzes the metabolic process where MDM2 enters as substrate and changes its state as a result.
(a) An interaction of interest from gene interaction pathway
(b) Process level details of interaction of interest in (a), visualized in SBGN
Figure 3.7: Process level interaction details of the interaction between MDM2 and RAD17 genes
This complementary view can be obtained for each interaction in the visualized neighborhood pathways. Users can perform a right click on the interactions or can use edge inspector to obtain such view (Figure 3.7a).
Pathway Commons web service is being used for retrieving paths between two genes of interest in SBGN-ML format to provide mechanistic details of interaction between these genes. Pathway Commons converts queried pathway information from BioPAX format to SBGN-ML. To achieve such conversion, Paxtools library is used in Pathway Commons core. In the context of our work, we provided automated graph layout facility to the resulting SBGN pathways that Pathway Commons provides. Virtual representations of SBGN elements after the conver-sion from BioPAX models do not include any geometric information regarding geometric boundaries and location of SBGN elements, in the obtained pathways which is an important aspect considering the efficient visualization of SBGN pathways. In this respect, we contributed to the Paxtools library in a way that geometric boundaries of SBGN elements are estimated according to the annota-tion content of such elements and regarding locaannota-tion informaannota-tion, we integrated CoSE algorithm to Paxtools for automated graph layout of such SBGN path-ways (Figure 3.8).
Figure 3.8: Flo w of ev en ts regarding visualization of pro cess lev el in teraction details
In addition to the visualization capability in SBGN, this view provides com-plexity management operations such as expand and collapse operations, hiding and highlighting regarding specific requirements of SBGN maps along with use-ful functionality such as searching a gene, performing layout. There is a toolbar above visualization canvas where such functionalities are included for easy ac-cess. Moreover, there is also a menu bar above this toolbar that groups regarding complexity management functionalities, help content, graph layout support un-der associated menu items (Figure 3.7b). Corresponding complexity management operations will be elaborated in next section.
Upon request detailed information about genes are also available in this view which is obtained again from BioGene service.
3.3
Complexity Management Operations
As the number of nodes, interactions along with the genomic data increase in visualized networks, utilization of the information represented in such networks decrease with the growing number of nodes and interactions, valuable informa-tion might become unnoticeable and obscured. In this respect, we provided some complexity management operations for the visualized networks to efficiently uti-lize and focus content of interest in both neighborhood networks and process description networks.
3.3.1
Complexity Management Operations for Gene
In-teraction Pathways
In the context of visualized neighborhood pathways along with genomic data. We provide node filtering operations to manage the complexity by the growing number of nodes in such networks. Topology related filtering operations of nodes can be found in the menubar above the visualization canvas under Topology menu item and in Genes tab of right panel. In the Topology menu, there exists func-tionality that controls the visibility of selected elements in the network such as showing only selected entities and hiding selected entities. These operations are handy to focus on content of interest in such networks. (Figure 3.10).
(a) Filtering functions offered by Topology menu item
(b) Network in (a) after filtering operation of ‘Show Only Selected’ is performed
Figure 3.10: Topology related filtering operations
We provide another set of complexity management operations regarding filter-ing of nodes in Genes tab that is located in the panel right to the visualization canvas. Drugs that are targeting genes in the network are filtered out by default but user can change the visibility of drugs from the drop down list in Genes tab (Figure 3.11b).
(a) Filtering functions offered by Genes tab.
(b) Drug filtering operations.
Figure 3.11: Filtering operations in ‘Genes’ tab of network visualization tool in cBioPortal
Genes tab provides complexity management operations regarding pruning the neighbour of seed genes in the network by their alteration frequency. Additionally, all the gene names are listed in this tab as an overview with a search capability. Topology related filtering operations that exists under Topology menu are also included in this tab for easy access along with the functionality of performing
a query to obtain new neighborhood pathway according to selected genes in the gene list (Figure 3.11a).
Pruning the network according to the alteration frequencies can be performed using the slider located under ‘Filter Neighbors by Alteration (%)’ label in Genes tab. Bounds of this slider is defined by the minimum alteration percent, which is 0 by default, and the maximum alteration percent value of neighbours of seed genes in the network, that is denoted as ‘MAX’. Slider controls the visibility of neighbour genes by pruning the neighbor genes that have less alteration per-cent value compared to current slider value. The text box located on the right of ‘MAX’ label indicates the current alteration percent value that network is pruned accordingly (Figure 3.11a). An example pruning process is illustrated in Figure 3.12.
(a) Non pruned neighborhood pathway
(b) Network is pruned according to the alteration percent value of 19.0% .
(c) Network is pruned according to the alteration percent value of 25.0% .
There also exists highlighting functionality that aims to provide focused vi-sualization to the neighborhood of selected nodes in the visualized networks. Associated operations can be found under ‘View’ menu item in the menu bar that is located above visualization canvas. A sample highlight operation is illus-trated in Figure 3.13, here neighborhood of selected gene CDK4 is highlighted by performing ghosting to the other nodes outside of the neighborhood of CDK4.
Figure 3.13: Highlight operation that focuses on neighborhood of CDK4 gene.
Growing number of diverse interactions with more than one interactions be-tween two genes makes it hard to utilize the genomic information and the relations of genes in the context of the visualized neighborhood networks. To manage the complexity that interactions bring, complexity management operations regarding interactions are provided in the Interactions tab (Figure 3.10a).
with the list of sources where information about these interactions is taken. This tab offers filtering functionality according to type and source of interactions. (Figure 3.14).
Figure 3.14: Filtering views by interaction type and source.
There are two buttons named as ‘Modify’ located at the end of the list of inter-action types and sources. When clicked, these buttons show associated filtering views as shown in Figure 3.14. All of the interaction sources are visible by default. On the other hand, only the interactions with types of Controls State Change of, Controls Expression of, In Complex With are visible to provide a simpler and less dense initial network since there are lots of interaction types which might increase the level of complexity in visualized network when visualized at once.
(a) Network visualization where all available edge types are visible
(b) Same network where edges are filtered out by their type
3.3.2
Operations for Process Level Pathways
As discussed in section 3.2, process level details of an interaction between two genes in the neighborhood pathways are visualized in SBGN. These pathways are obtained from Pathway Commons web service. Obtained SBGN pathways include hierarchical structures such as molecular complexes and compartments as compound nodes in the obtained graph topology. SBGN pathways are com-pound graphs, whereas gene interaction pathways are flat graphs that do not include hierarchical structures. In this respect, increasing number of entities in such pathways along with the hierarchical structures bring complexity to the vi-sualized networks which might obscure the information embodied in such SBGN pathways. To handle the complexity, operations of hiding, highlighting along with the expand, collapse utilities for compound structures are provided. To provide an efficient visualization for SBGN pathways in cBioPortal, an improved SBGN-Viz.js is constructed, enhanced by associated complexity management operations which will be discussed in this section.
One of the major complexity management operation that is provided is ex-pand and collapse operations regarding compound structures of SBGN diagrams (Complex and Compartment structures). This utility is important since obtained process level pathways might include many compound structures with lots of en-tities in them, increasing the graph size and obscuring the valuable process level details of visualized pathways (Figure 3.16c).
Initially, Complex structures of the obtained SBGN pathways visualized in cBioPortal is collapsed to provide an effective initial visualization of such path-ways (Figure 3.16a).
(a) Paths between CCND1 and CDKN2A visualized in SBGN where all molecular complexes collapsed initially for a compact, intuitive view
(b) Same pathway in (a) where Nucleoplasm compartment is further collapsed
![Figure 1.1: Textual representation of a biological pathway (recruitment of repair and signaling proteins to double-strand breaks) in PathwayCommons [1]](https://thumb-eu.123doks.com/thumbv2/9libnet/6023567.127248/17.918.175.783.190.660/figure-textual-representation-biological-recruitment-signaling-proteins-pathwaycommons.webp)
![Figure 1.2: Visual representation of a biological pathway (recruitment of repair and signaling proteins to double-strand breaks) in PathwayCommons [1]](https://thumb-eu.123doks.com/thumbv2/9libnet/6023567.127248/18.918.204.764.162.468/figure-visual-representation-biological-recruitment-signaling-proteins-pathwaycommons.webp)
![Figure 2.3: Force-directed graph layout model [2].](https://thumb-eu.123doks.com/thumbv2/9libnet/6023567.127248/25.918.175.786.468.1009/figure-force-directed-graph-layout-model.webp)
![Figure 2.5: BioPAX provides a standard language for the efficient exchange of the pathway data [3].](https://thumb-eu.123doks.com/thumbv2/9libnet/6023567.127248/27.918.240.726.408.615/figure-biopax-provides-standard-language-efficient-exchange-pathway.webp)