a thesis
submitted to the graduate program of materials
science and nanotechnology
and graduate school of engineering and science
of bilkent university
in partial fulfillment of the requirements
for the degree of
master of science
By
¨
Ozlem K¨
oyl¨
u
July, 2011
Assist. Prof. Dr. Mehmet Bayındır (Advisor)
I certify that I have read this thesis and that in my opinion it is fully adequate, in scope and in quality, as a thesis for the degree of Master of Science.
Asst. Prof. Dr. Ali Kemal Okyay
I certify that I have read this thesis and that in my opinion it is fully adequate, in scope and in quality, as a thesis for the degree of Master of Science.
Asst. Prof. Dr. Sel¸cuk Akt¨urk
Approved for the Graduate School of Engineering and Science:
Prof. Dr. Levent Onural Director of the Graduate School
Supervisor: Assist. Prof. Dr. Mehmet Bayındır July, 2011
Photonic band gap fibers are proposed for the medical applications of laser light transmission into body. Conventional optical fibers guide light via total internal reflection. Due to light guiding mechanisms and materials they have limited frequency range, fiber flexibility and laser power. On the other hand, it is possible to scale operating wavelengths of PBG fibers just by changing a few parameters during fabrication process. Besides, hollow core of PBG fibers eliminates material absorptions and non-linearities during light guiding.
PBG fiber production starts from material characterization; and selection; and continues with fiber design, thin film coating, preform preparation and fiber drawing. Studies on theoretical calculations and material properties have shown that best candidate materials for CO2 laser delivery are As2Se3 and
poly-ether-sulfone (PES). For this purpose, As2Se3 coated PES films are rolled to form a
preform and consolidated before thermal drawing. Characterization of drawn fibers indicated that CO2 laser can be transmitted with loss levels of > 1 dB/m
and 32 W output power is observed from a 1.2 m long fiber.
After fabrication and characterization of PBG fibers, a prototype infrared laser system is built and tested on various applications. In our group laser tissue interactions are examined to see effectiveness of CO2 laser on tumor tissue.
Ex-periments showed that tumor tissue is affected in a very distinctive way compared to healthy tissue. Absorption of cancerous lung tissue at CO2 laser wavelength
(10.6 µm) is higher than absorption of healthy tissue at the same wavelength. This study proposes a wide use of PBG fiber for not just CO2 lasers, but also
other laser systems used in different medical operations, such as Ho:YAG lasers. PBG fibers for high power laser delivery are novel structures for fast, painless
Keywords: Photonic Band Gap Fiber, Hollow-core Waveguide, Chalcogenide
Glasses, Medical Lasers, High-Power Laser Beam Delivery. iv
Malzeme Bilimi ve Nanoteknoloji, Y¨uksek Lisans Tez Y¨oneticisi: Yrd. Do¸c. Dr. Mehmet Bayındır
Temmuz, 2011
Bu ¸calı¸smada lazer ı¸sını kullanılarak yapılan cerrahi m¨udahaleler i¸cin fo-tonik yasak banda sahip polimerik (PBG) fiberler ¨onerilmi¸stir. G¨un¨um¨uzde kullanılan konvansiyonel fiberler, lazer ı¸sınını basit indis farkı ile iletmekte ve bu dalga kılavuz yapısı ve malzeme ¨ozellikleri sebebiyle lazer operasyonlarında bazı kısıtlamalar getirmektedir. Bu kısıtlamalar lazer ı¸sınının dalga boyunda, fiber esnekli˘ginde ve lazer g¨uc¨unde g¨ozlemlenmektedir. Di˘ger yandan fotonik bant yapılı fiberin iletim dalga boylarını sadece bir ka¸c ¨uretim parametresini de˘gi¸stirerek ayarlamak m¨umk¨un olmaktadır. Ayrıca, PBG fiberler i¸ci bo¸s olması sebebiyle malzeme kaynaklı ve do˘grusal olmayan optik ¨ozelliklerden kaynaklanan g¨u¸c kayıplarını ¨onlemektedir.
PBG fiber ¨uretimi malzeme karakterizasyonu ve ¸se¸cimiyle ba¸slar, fiber tasarımı, ince film kaplama, preform hazırlanması ve fiber ¸cekimi ile devam et-mektedir. Teorik ¸calı¸smalar ve malzeme ¨ozellikleri g¨oz ¨on¨une alındı˘gında CO2
lazer iletimi yapan PBG fiber ¨uretimi i¸cin en uygun malzeme ¸ciftinin As2Se3 ve
PES oldu˘gu g¨ozlemlenmi¸stir. Bu ama¸cla, As2Se3 kaplı PES filmi rulo olu¸sturacak
¸sekilde sarılmı¸s ve ısıl i¸slem uygulanarak b¨ut¨unle¸stirilmi¸stir. Termal yolla ¸cekilen fiberlerin karakterizasyonu g¨osterdi ki, bu yolla ¨uretilen fiberler ile 1 dB/m’nin altında kayıpla lazer ı¸sını iletilebilmektedir. Ayrıca, 1.2 m uzunlu˘gundaki bir fiberden 32 W g¨uc¨unde lazer iletimi de g¨ozlemlenmi¸stir.
Fiber ¨uretimi ve karakterizasyonundan sonra lazer-doku etkile¸simleri ince-lenmi¸s ve CO2 lazer ı¸sınının t¨um¨orl¨u dokular ¨uzerinde ayırıcı bir etkiye sahip
oldu˘gu g¨or¨ulm¨u¸st¨ur. Grubumuzda yapılan ¨ol¸c¨umler t¨um¨orl¨u akci˘ger dokusu-nun CO2 lazer dalgaboyundaki so˘gurmasının sa˘glıklı dokuya g¨ore daha y¨uksek
lanılan di˘ger lazerler (Ho:YAG lazer gibi) i¸cinde geni¸s bir kullanım alanı vaad etmektedir. Y¨uksek g¨u¸cl¨u lazer ı¸sınının iletimi i¸cin ¨uretilen PBG fiberler acısız, kanamasız ve ¸cabuk iyile¸sme s¨uresine sahip cerrahi m¨udahaleller i¸cin sunulan ¨
umit vaad eden yapılardır.
Anahtar s¨ozc¨ukler : Fotonik Bant Yapılı Fiberler, ˙I¸ci Oyuk Dalga Kılavuzu,
Kalkojenler, Medikal Lazerler, Y¨uksek g¨u¸cl¨u lazer ı¸sınının iletilmesi. vi
an understanding of the subject.
I would like to thank my former group members; Dr. Mecit Yaman, Dr. Hakan Deniz and Dr. Abdullah T¨ulek for their insightful talks and role models as good scientists; Mert Vural for initiating this study; Ekin ¨Ozge ¨Ozg¨ur for sample preparations, SEM images and investigation of laser-tissue interactions. I am also thankful to Mehmet Kanık for thin film coating and his help on fiber drawings; Tural Khudiyev for his help on simulations and use of supercomputers. Additionally, I would like to thank my group members: Erol ¨Ozg¨ur, Adem Yıldırım, Ozan Akta¸s, and Reha ¨Ozalp for their instructive talks. I am also thank-ful to Neslihan Arslanbaba and H¨ulya Buduno˘glu for being my closest friends and supporters especially during my MS studies. I also want to mention my former group members Duygu Akbulut, ¨Ozlem S¸enlik, H. Esat Kondak¸cı, Kemal G¨urel, Murat Kılın¸c, Yavuz N. Erta¸s, Can Koral, Tarık C¸ eber and Ahmet ¨Unal. Engi-neers of National Nanotechnology Research Center Koray Mızrak, Mustafa G¨uler and Enver Kahveci were also very helpful during my studies.
Besides my present and former group members, I wish to give my special thanks to Prof. Dr. Salim C¸ ıracı for being an elite scientist and for his efforts on founding National Nanotechnology Research Center together with my supervisor Assist. Prof. Dr. Mehmet Bayındır. I was a close witness of their struggle.
Finally, I am thankful to my husband Fahri Alkan, who is the greatest sup-porter and most important part of my life. Without him, I could not have com-plete this work. I am grateful for my family for their moral support.
I acknowledge The Scientific and Technological Research Council of Turkey, TUBITAK-BIDEB for the financial support during my graduate studies.
1 Introduction 1
2 Theoretical Background of Photonic Band Gap Fibers 4
2.1 Omnidirectional Reflection . . . 4
2.2 Band Structures . . . 11
2.3 Cylindrical Geometry . . . 14
2.3.1 Index Guiding Waveguides . . . 14
2.3.2 Photonic Band Gap Fibers . . . 15
3 Production of Photonic Band Gap Fibers 20 3.1 Materials Characterization . . . 22
3.1.1 Thermomechanical Properties . . . 25
3.1.2 Optical Properties . . . 31
3.2 Fiber Design . . . 33
3.3 Thin Film Production . . . 37
3.3.1 Thin Film Coating System . . . 39 viii
3.5.1 Characterization of PBG Fibers . . . 61
4 Infrared Laser Beam Delivery 69 4.1 Current Status and System Review . . . 69
4.2 New Coupling System . . . 72
4.3 Measurements on Various Tissues . . . 77
4.3.1 CO2 Laser - Tissue Interactions . . . 78
5 Summary and Future Work 84
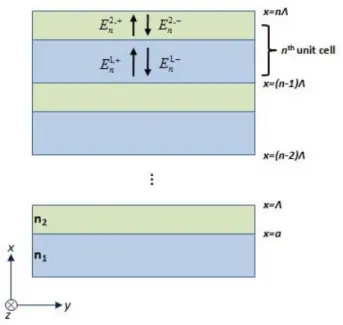
2.1 Schematic representation of a dielectric periodic medium and plane-wave amplitudes associated with nth unit cell. . . . 6
2.2 Spectral dependance of the reflectance R for the 10-segment dielec-tric mirror with n1=1.5, n2=2.5 and Λ=1 µm. Reflection profile
for TE and TM polarisations does not differ for normal incidence. For 30◦ and 60◦ incidence angles they have different profile. Blue lines indicate TE polarisation and red lines indicate TM polarisation. 9 2.3 The reflectance profile of a layered dielectric structure for both
polarizations and whole incidence angle range with n1=1.5, n2=2.5
and N=10. . . 10 2.4 Band structure of a typical periodic layered medium in the
nor-malized ω−ky plane with n1=2 and n2=1 for both TE and TM
po-larizations. The blue regions are allowed bands with| cos KΛ| < 1 while white regions represent the forbidden bands. The red line represents the Light Line. . . . 12 2.5 Band structure of an omnidirectional reflector with n1=4.5 and
n2=1.5 for both TE and TM polarizations. The green regions
represents first order and second order omnidirectional forbidden band. . . 13
(c) Schematic illustration of propagation of electromagnetic waves hopping between the coupled evanescent defect modes on a bended path. (d) SEM image of the 3D photonic crystal which creates a bright green colour on the scales of Parides sesostris. Scale bars; (b) 10 µm, (d) 1.2 µm. Adopted from; (a) Taniyama [33], (b) Knight [30], (c) Bayindir [34], (d) Vukusic [35] . . . 17 2.8 An SEM image of a chalcogenide 2D PCF with kagome lattice.
Scale bar 100 µm. Adopted from, Desevedavy [40]. . . . 18 2.9 SEM image of cross-section of a hollow-core 1D PCF with
PES/As2Se3 alternating layers. The fundamental band gap is at
3.55 µm. Adopted from, Temelkuran [12]. . . . 19
3.1 Thermal drawing is basically reducing feature size of a macro struc-ture to micro scale at softening temperastruc-tures of materials. Figure is an image of schematics of 1D PBG fiber drawing. . . 21 3.2 Schematic illustration of volume dependence temperature of a glass
and a crystalline phases of a typical material. Here Tm is melting
temperature and Tg is glass transition temperature. . . 22
3.3 The DSC data of the materials set: chalcogenide glasses; As2Se3,
As2S3 and GAST. polymers; PES and PEI . . . 25
3.4 The comparison of Arrhenius and Vogel-Fulcher-Tamman models on the viscosity data (Fulcher, 1925) of As2Se3. . . 27
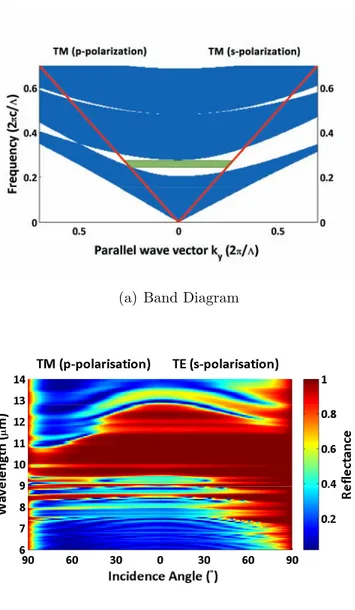
3.7 The temperature viscosity dependence of the candidate material calculated using different models. The inset gives a close look to the region where all materials except GAST has close viscosity values. . . 30 3.8 Dispersion relations of candidate materials. . . 32 3.9 (a) Band diagram of a 10 pair As2Se3-PES dielectric mirror without
losses. (b) Calculated reflectance profile of the same mirror with included dispersion. . . 36 3.10 EDX analysis of coated As2Se3. . . 38
3.11 X-Ray diffraction measurements of bulk powdered As2Se3 and film
As2Se3. . . 38
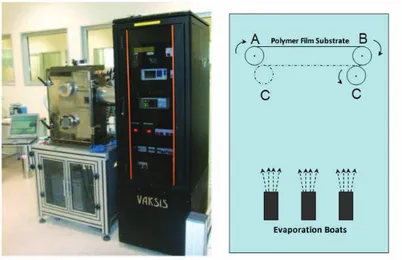
3.12 A general look of custom designed thermal evaporator system (Elif) and schematic diagram of first designed system. . . 40 3.13 (a) Second version of Elif evaporation system. Here the letters are;
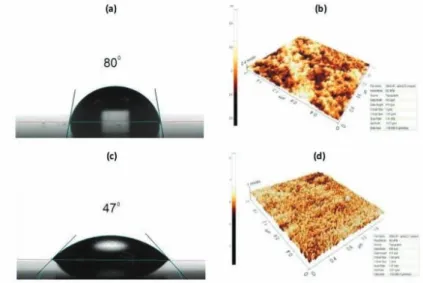
A: The big cylinder on which substrate polymer film is wrapped and fixed; B: Thickness monitor; C: Boats; D:The shutter which enables a sudden stop of coating. (b) The schematic diagram of upgraded coating system. . . 41 3.14 The contact angle measurements and AFM images of regular (a,b)
and plasma treated (c,d) polymers. Microwave operating frequency 2.4 GHz and the power is about 100 W for five minutes [63]. . . . 41 3.15 A photograph of large are coated polymer film. . . 42 3.16 Evaporator geometry with a plane palette as a substrate holder.
Adapted from [65]. . . 44
3.19 Theoretical thickness calculations of Elif evaporation system with different exponents and the experimental thickness values. The green filled area represents the place of the boat. . . 46 3.20 Calculated normalized thickness profile for boat sizes 5 cm and 11
cm. . . 46 3.21 Calculated normalized thickness profile for different substrate
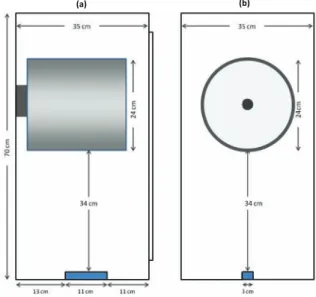
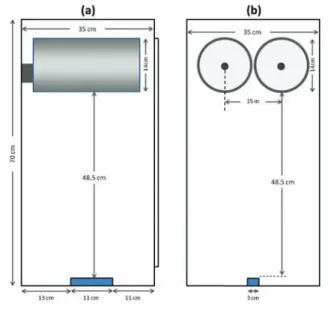
heights. As the height of the substrate increases the film uni-formity decreases. . . 47 3.22 (a) Side view of the newly designed Elif evaporation system vacuum
chamber. (b) Front view of the chamber. . . 48 3.23 Comparison of uniformity of films coated in 1-cylinder and
2-cylinder evaporation systems. The green represents the measured film thicknesses of a PES film coated in the new, 2-cylinder system. 48 3.24 Picture of upgraded Elif evaporator system. . . 49 3.25 The program used for thickness measurement. Program is coded
in Mathematica. The blue line is the interferometric reflection of the film and the red line is calculation result of TMM for one layer of As2Se3 on PES polymer. (a) The data and the calculation are
unfitted. (b) The data and the calculation are fitted. sh and mh are shifting and and scaling parameters to make a good fit. . . . 50 3.26 AFM images of As2Se3 films coated on SiO2, before (a) and after
(b) annealing. . . 51
3.28 Flow diagram of preform preparation process. . . 54 3.29 Custom built preform consolidator system. . . 55 3.30 PBG fibers are drawn in this fiber tower which is custom built by
Bayindir Research Group. . . 57 3.31 (a) A general picture of two zone oven used for heating preform.
(b) Schematics of cross section of the oven. The red areas represent heating parts of the oven. (c) Temperature profile of inside of the oven when top zone is set to 290◦C and bottom zone is set to 200
◦C. (d) Temperature gradient on the vertical cross sectional area
of the oven. . . 58 3.32 Schematic representation of drawing parameters. . . 60 3.33 Transmission bands of three fibers drawn from the same preform. 62 3.34 (a) The Leica EM FC6 Ultramicrotome used for sample
prepara-tion for electron microscopy. (b) Different fiber structure embed-ded into epoxy resin. . . 63 3.35 SEM images of a fiber cross section which is not prepared with
microtome. (Drawing date: November, 2008) . . . 64 3.36 SEM images of a fiber cross section prepared with ultra-microtomy.
(Drawing date: December, 2009) . . . 64 3.37 SEM images of a CO2 fiber core (a) and layers of dielectric mirror
(b). . . 65
4.1 Lumenis C40 CO2 laser system for medical application which is to
be embedded with a laser beam coupling system. . . 70 4.2 The basic laser coupling system used in this study before a
com-plicated coupling system. . . 71 4.3 Power transmission data of a PBG fiber depending on the length
of the fiber. Slopes of the lines give losses of the fibers. . . 72 4.4 Design of the coupling system is done in steps each of which solve
a particular problem. a) Direction change in the beam is done by a 45◦ tilted mirror. b) Adjustment screws are placed behind the mirror. c) A cavity is structure is designed in order to fix the lens which is transparent in the mid-IR region. d) Focal length of the lens is 4”; hence, distance between the fiber and the center of the lens determined accordingly. e) A 0.8 mm window is placed at the focal point of the coupling adapter to ensure the cladding of the fiber is not exposed to high power laser. f) A fiber fixing apparatus is designed to place fiber at the focal point of the lens and provide axial alignment. g) A simple gas valve is added to the system for gas cooling. . . 73 4.5 An image of custom designed fiber coupler. . . 74 4.6 Heat profile of fiber during transmission of 40 W laser beam(with
32 W output power) (a) and burning of a wooden piece by output laser beam (b). . . 75
4.8 Profile of the beam after the lens in the coupler (a) and after trans-mitted through 1 m long PBG fiber (b) (Drawing date: 04.22.2010). 76 4.9 Laser ablation center and zones of laser tissue interaction. . . 79 4.10 Comparison of normal muscle tissue and 2 W, 0.1 s pulsed laser
applied tissue. There is not any significant structural change in the tissue. . . 80 4.11 FTIR spectra of healthy lung tissue and lung tumor. At CO2 laser
wavelength (10.6 µm), absorption of tumor is significantly higher than normal tissue. . . 81 4.12 Laser application on tumorous (a) and healthy (b) lung tissue.
Trials are done at different laser powers and different coolant He gas pressures. . . 82 4.13 1 W-cw laser beam applied tumor tissue (a), 2 W-cw laser beam
applied tumor tissue (b), 1 W-cw laser beam applied healthy tis-sue (c), 2 W-cw laser beam applied healthy tistis-sue (d). All laser applications are done with He gas coolant. . . 82
Ferry viscosity calculation model. Here, dϵ/dt = (ν− V )/ν where
ν is fiber drawing speed and V is feed speed in m/s. . . . 29
3.3 General properties of As2Se3 and PES. The data are taken from,
Amorphous Materials Inc., Glassy Semiconductors [54] and Prop-erties of Polymers [50]. . . 34 3.4 Structure parameters of the materials for both fiber and preform. 35
4.1 Cut-back measurements data of PBG fiber using optimized fiber production and coupling system (Drawing date: 04.22.2010) . . . 75
Introduction
The idea of guiding light in air by using all-dielectric mirror is a promising area for high power laser delivery applications for about ten years [1, 2, 3]. Main idea here is to fabricate an hollow-core fiber with a dielectric mirror on the inner surface. The dielectric mirror here is basically a one dimensional photonic band gap structure. These air core and dielectric mirrors are novel structures of high power laser delivery fibers. In this work we present materials characterization, fiber design, fabrication principles, optical characterization, and use of hollow-core 1D PBG fibers for high power beam delivery for medical applications.
Hollow-core fibers basically consist of a dielectric mirror, which is alternating layers of two high refractive index-contrast materials, on its inner surface and a protecting cladding. Light guiding is provided with existence of radial bang gap in the dielectric mirrors and air core eliminates drastic losses from material absorptions and non-linearity effects arise from material properties and guiding structure [4]. Dielectric mirrors are fabricated with two different materials and there are two essential criteria for the material choice; the difference between the refractive indices should be high and thermomechanical properties of the materials should be similar.
The motivation of this thesis comes from that the fact that quarter wave stack (QWS) structures enable fabrication of omnidirectional mirrors [5]. Occurrence
constitutes low density medium which is more suitable for the high energy beam delivery. In addition to the high-power applications, the air core also provides gas phase sensing applications. For instance by using a binary system, sensing and differentiating different material vapors are possible [6]. Off-axis laser emission was also reported using cavity structures in radial direction [7].
CO2 laser is first used in medical applications in late 1960s and today it is a
very common technique for many surgery operations. Use of CO2laser is generally
in the treatment of many cancer types. In these operations main purpose is to remove cancerous tissue by photothermal effect of CO2 laser beam and reduce
damage to neighboring tissues and organs [8].
Principle reason why CO2 laser is very common in medicine world arises from
laser-tissue interactions. Biological tissues include high amounts of water and water is highly absorptive at CO2 laser wavelength 10.6 µm which is the
fre-quency of vibrational modes of water molecules. Absorption of laser light by water molecules results in heat increase in the tissue, ablation and vaporization of tissue water [9]. Advantages of CO2 laser compared to other commercial lasers
used in medical applications are lower peak power, very small penetration depths and high optical absorption at 10.6 µm. Due to these properties, regions close to ablation site in the tissue are not affected by high laser power; and so, healthy tissue is preserved during the operation. Additionally, coagulation effects of CO2
laser reduce blood loss and prevents edema formations after operation [10, 11]. Hence, patients can experience a painless and bloodless treatment and healing of the organ can take very short time.
The challenge of CO2 laser use comes from laser beam guiding. Present
com-mercial fibers for medical applications generally function in ultraviolet (UV), visible and near infrared (NIR) region of the optical spectra. New ways of light guiding for longer wavelength should be proposed since water absorption and
laser-tissue interaction occur at longer wavelengths [10]. 1D photonic band gap (PBG) fibers are promising novel fibers for high power beam delivery to the oper-ation site in the body [12]. However, fibers produced for such laser beams should be well designed and optimized for ultimate purpose of medical operation. For example, CO2 laser delivery fibers should have a transmission band at 10.6 µm
whereas Ho:YAG laser should have at 2.1 µm. CO2 laser delivery PBG fibers are
main focus of this study, therefore their design, fabrication, characterization and
in vitro applications will be presented in this thesis staring from simple theory of
light propagation.
Reports on the previous studies also shaped the progress of this study [12, 13, 14, 15]. In Chapter 2, the motivation of this work will be described in de-tail and the theoretical background in electromagnetics will be explained. Basic properties of dielectric mirrors, their band structures and one dimensional PBG in radial direction will be discussed in detail. Chapter 3 will be basically about general procedure of PBG fiber production. First, we will investigate material characterization. In the light of theoretical calculations and material properties design of the fiber and prediction of fabrication parameters will be explained. Production of PBG fibers will be explained step by step from the large area thin film coating to the thermal drawing. In Chapter 4, optical characterization of these fibers and the basic loss mechanisms will be examined. Also, CO2 laser
Photonic Band Gap Fibers
2.1
Omnidirectional Reflection
Multilayered dielectric mirrors are basically one dimensional photonic crystals that can possess very high reflection of electromagnetic radiation. They are ba-sically made up of two alternating dielectric materials with different refractive indices. Developments in deposition techniques yielded precise control of film layer thickness and also the control of the optical band gap of dielectric mirrors. These improvements led integration of dielectric mirrors to a variety of optical systems. Metallic mirrors are also used for similar applications. Although they have a very large spectrum range and omnidirectional reflection, they have some absorptions at high energetic part of the spectrum [16]. On the other hand, di-electric quarter wave stack (QWS) structures have metallic-like omnidirectional reflectivity and low-loss behavior. Additionally, they provide frequency selectivity by changing a few parameters during production process [5].
The idea of multilayered mirror is a known phenomena since 19th century with the outstanding observations and calculations by Lord Rayleigh [17]. In
1917, Lord Rayleigh explained that the total reflection from a multilayered struc-ture is the sum of all reflections from each interface [18]. Among many studies, the 1977 paper of Yeh et. al. is a crucial step for the explanation of the dielec-tric mirrors. In this paper, Yeh et. al. gives a general theory of reflection from a stratified media, which bases our calculations [19, 20]. However, omnidirec-tional reflection phenomena is first mentioned by Joannopoulos et. al. in 1998. Joannopoulos and his colleagues derived that if optical paths for two repeating materials in the multilayered mirror can be set to the half of wavelength, an angle- and polarization-independent optical band gap can be achieved [21, 22]. This improvement opens a gate for the fabrication of highly effective cavities and waveguides.
Light guiding in the hollow core fibers is achieved by multilayered dielectric mirrors. The mirrors inside the fibers are basically one dimensional structures in the radial direction. As stated before, for a 1D photonic crystal to have a omnidirectional band gap it is needed to use quarter wave stack (QWS) struc-tures, by which optical paths in the alternating layers are both equal to half of the operating wavelength [5]. Eq. 2.1 gives the necessary layer thickness for a material; here, n is the refractive index and λ is the center wavelength of the optical band gap.
d = λ
4n (2.1)
A dielectric mirror can be considered as a periodic array of dielectric interfaces. When one looks at the reflections from each interface the result can be very weak but the overall reflection from the structure can yield a large fraction of reflection. This overall reflection can be calculated by using a matrix formulation.
Basic structure can be illustrated as in Fig. 2.1 with the periodicity direction along the x axis. The refractive index of the structure as a function of x can be written as;
Figure 2.1: Schematic representation of a dielectric periodic medium and plane-wave amplitudes associated with nth unit cell.
n(x) = n1, if 0 < x < a n2, if a < x < Λ (2.2)
Here Λ is the period and Λ = a + b. The index function is a periodic function; i.e.
n(x) = n(x + Λ) (2.3)
Then, electric field is written as;
E = E(x)ei(ωt−kzz) (2.4)
The x component of electric field for each layer is basically the sum of incident and reflected waves. Using this idea the x component of electric field for nth pair
E(x) = E1,+ n e−ik1x(x−nΛ)+ En1,−eik1x(x−nΛ), if nΛ− a < x < nΛ En2,+e−ik2x(x−nΛ+a)+ E2,− n eik2x(x−nΛ+a), if nΛ < x < (n− 1)Λ − a (2.5) here; k1x = k1cos(θ1) = n1cωcos(θ1), k2x = k2cos(θ2) = n2cωcos(θ2). (2.6)
Here angles are the corresponding ray angles in the layers. Using matrix for-mulation we can write the relation between incident and reflected field coefficients in a column vector notation (Eq. 2.7 and Eq. 2.8).
En2,+−1 En2,−1− = D−1 2 D1P1 En1,+ E1,− n (2.7) and En1,+ En1,− = D−11 D2P2 En2,+ En2,− (2.8) where Pj = eikjxdj 0 0 e−ikjxdj , j = 1, 2 . (2.9)
Dynamical matrices D1 and D2 are independent of layer thicknesses and P
matrices give phase factors for each layer. After substituting these matrices and multiplication, we can obtain reflection relations for s-polarized waves as;
E 1,+ n−1 En−11,− = 1 2 eik2xb ( 1 + k2x k1x ) e−ik2xb ( 1− k2x k1x ) eik2xb ( 1− k2x k1x ) e−ik2xb ( 1 + k2x k1x ) En2,+ E2,− n (2.10)
En2,− 2 eik1xa 1−k1x k2x e −ik1xa 1 + k1x k2x E 1,− n
Using Eq. 2.10 and Eq. 2.11, one can construct a matrix that relates ampli-tudes of the field at one pair to the next one;
E 1,+ n−1 En1,−1− = M˘11 M˘12 ˘ M21 M˘22 En1,+ En1,− . (2.12)
The matrix elements are;
˘ M11 = eik1xa [ cos k2xb + 1 2i ( k2x k1x + k1x k2x ) sin k2xb ] ˘ M12 = e−ik1xa [ 1 2i ( k2x k1x − k1x k2x ) sin k2xb ] ˘ M21 = eik1xa [ −1 2i ( k2x k1x − k1x k2x ) sin k2xb ] ˘ M22 = e−ik1xa [ cos k2xb− 1 2i ( k2x k1x + k1x k2x ) sin k2xb ] (2.13)
Matrix ˘M in Eq. 2.12 is the unit cell translation matrix which relates complex
amplitudes of incident and reflected waves to the next unit cell. Using similar derivation one can find elements of translation matrix for TM waves as;
˘ M11T M = eik1xa [ cos k2xb + 1 2i ( n2 2k1x n2 1k2x +n 2 1k2x n2 2k1x ) sin k2xb ] ˘ M12T M = e−ik1xa [ 1 2i ( n22k1x n2 1k2x − n21k2x n2 2k1x ) sin k2xb ] ˘ M21T M = eik1xa [ −1 2i ( n22k1x n2 1k2x − n21k2x n2 2k1x ) sin k2xb ] ˘ M22T M = e−ik1xa [ cos k2xb− 1 2i ( n2 2k1x n2 1k2x + n 2 1k2x n2 2k1x ) sin k2xb ] (2.14)
Figure 2.2: Spectral dependance of the reflectance R for the 10-segment dielectric mirror with n1=1.5, n2=2.5 and Λ=1 µm. Reflection profile for TE and TM
polarisations does not differ for normal incidence. For 30◦ and 60◦ incidence angles they have different profile. Blue lines indicate TE polarisation and red lines indicate TM polarisation.
The translation matrix for the N -segment structure is multiplication of the translation matrix for all segments. Thus, one can write Eq. 2.15 which relates complex field amplitudes of the incident wave in the isotropic ambient medium to the end of the structure [20].
EN1,+ EN1,− = M11 M12 M21 M22 −N E01,+ E01,− . (2.15)
Eq. 2.15 opens a gateway to all optical properties of the combined system. The ratio between coefficients of the reflected and incident components of electric field will give us reflectivity of the system (Eq. 2.5) and the back propagating component of the field at the end of the mirror will be zero i.e. EN1,−= 0. Using this information and the components of the matrix M which is Nth power of the matrix ˘M , one can find the reflection constant as in Eq. 2.16 and 2.17.
Figure 2.3: The reflectance profile of a layered dielectric structure for both po-larizations and whole incidence angle range with n1=1.5, n2=2.5 and N=10.
rN = ( E01,− E01,+ ) (2.16) and rN = MM21 11, R =|rN| 2 = M21 M11 2 (2.17)
The last equation, together with Eq. 2.13 and 2.14 gives the relation between the frequency of the incident wave and the reflectance of the dielectric mirror [20]. Fig. 2.2 is a characteristic reflectance behavior for a sample mirror with N=10, n1=1.5, n2=2.5 and a = b = Λ/2. The sample structure has different
reflection bands for different frequency, each of them corresponds to different orders of band gap. A noteworthy property is the gap for TE mode gets wider as the incidence angle increases whereas the width of the gap for TM mode gets smaller as it can be seen from Fig. 2.3. Therefore, one can conclude that the width of omnidirectional band gap is determined by the width of the gap of TE
mode at normal incidence plus the width of the gap of TM mode at 90◦. However, the sample structure here does not have an QWS structure and the optical gap for TM mode shifts from the normal incidence gap range.
2.2
Band Structures
Electrons’ motion in a crystalline solid is very similar to wave propagation in periodic media [20, 23]. Therefore, using same methodology one can construct a similar band theory for wave motion in periodic dielectric media and some of the physical concepts such as Bloch waves, forbidden and allowed bands can be used. Basically, a periodic layered media is mathematically same as one dimensional lattice and optical potential i.e. the refractive index of the media is invariant under translation: n(x + Λ) = n(x). This methodology gives periodic solutions to the wave equations and there is only a lattice translation factor between two consecutive pairs (Eq. 2.18 ).
En1,+ En1,− = e−iKΛ E 1,+ n−1 En1,−1− (2.18)
From Eq. 2.12 and 2.18 problems become an eigenvalue problem [19]:
M11 M12 M21 M22 En1,+ E1,− n = eiKΛ En1,+ E1,− n (2.19)
Here K is Bloch wave number and the expression e−iKΛ corresponds to the phase shift of the electromagnetic wave propagating along the lattice. Eigenvalues of Eq. 2.19, which are solutions to the Bloch wave numbers determine the propa-gation behavior of electromagnetic wave i.e. the real solutions of K correspond to the waves that can propagate and complex solutions correspond forbidden waves. The solutions of the Bloch wave numbers are given in the following expression:
Figure 2.4: Band structure of a typical periodic layered medium in the normalized
ω− ky plane with n1=2 and n2=1 for both TE and TM polarizations. The blue
regions are allowed bands with | cos KΛ| < 1 while white regions represent the forbidden bands. The red line represents the Light Line.
cos KΛ = cos k1a cos k2b−
1 2 (n 2 n1 +n1 n2 ) sin k1a sin k2b (2.20) where K =√k2 x+ k2y
and Fig. 2.4 represents the projected band diagram of a QWS structured pe-riodic media (i.e. d1/d2 = n2/n1). In the figure, the red line represents the Light
Line which is determined by ω = cK. Originally we are interested in the waves
that are originating from a homogenous medium which is air. Hence, only the region above the light line is important for our case, i.e. below the light line area are trivially forbidden bands. Here, ky =0 corresponds to normal incidence and
ky values lying on the light line corresponds to 90◦ incidence. For this structure
there is an optical band gap for normal incidence. An interesting result is that TM forbidden bands shrink to zero as incidence angle gets to a specific angle.
Figure 2.5: Band structure of an omnidirectional reflector with n1=4.5 and
n2=1.5 for both TE and TM polarizations. The green regions represents first
order and second order omnidirectional forbidden band.
This angle value is called Brewster Angle (yellow line in the figure). Fig. 2.5 is another example structure (n1=4.5 and n2=1.5) which has omnidirectional
for-bidden bands (green regions) for both polarizations. Here, an important feature is the difference between refractive indices which affects the width of the band region. Higher the refractive index contrast, wider the forbidden gap. Addition-ally, high refractive index contrast lead to shorter evanescent wave decay lengths and decrease material-light interaction; hence, decreased material losses.
As explained above, in order to have an omnidirectional reflection the ratio of layer thicknesses should be equal to the reciprocal of the ratio of indices. An important property is one can adjust central frequency of the band gap using Eq. 2.1. This feature provides an important way to design many dielectric struc-tures for a variety of applications [12, 13, 14, 24]. In solid crystals impurities can cause scattering and absorptions. A similar phenomenon is also exists in dielectric mirrors. Impurities in the layer thicknesses of the structure can lead to filtering effects for particular frequencies [25, 26]. Such properties of layered
2.3
Cylindrical Geometry
Today’s communications systems are mainly depend on waveguides which trans-port light for very long distances with very small losses. Simple structure of an optical fiber is a core-cladding structure in which light is guided with total inter-nal reflection (TIR) [27]. The most known example of this kind is conventiointer-nal silica fibers which are known as index guiding fibers. Embedding different struc-tures and different materials to the fibers enables the usage of fibers in a wide range of applications [23, 27, 28]. For instance, improving glass drawing methods led to solid and air core photonic crystal glass fibers [29, 30, 31, 32]. In addition to core-cladding and photonic crystals glass fibers, applying a one dimensional dielectric mirror as explained above results in a light guiding due to the photonic band gap in the radial direction [1]. Main materials used for the fabrication of photonic band gap fibers are basically chalcogenide glasses and polymers [12].
2.3.1
Index Guiding Waveguides
Simple index guiding fibers are the basis for most of the telecommunication lines. Main reason is the ease of fabrication of these fibers and low loss levels at optical frequencies. Propagation of light through these fibers is basically due to total internal reflection between core and cladding structures with indices n1 and n2.
Mathematical solution simply comes from Snell’s Law;
n1sin θ1 = n2sin θ2 (2.21)
The critical angle for the structure can be found by setting the refraction angle to 90◦. Thus the critical angle for the structure can be found as;
θc= sin−1 (n 2 n1 ) (2.22)
This means propagating light which has an incidence angle bigger than θc
encounters a complete reflection. Hence, refractive indices of core and cladding materials determine the angle window of total reflection. From Eq. 2.22 one can conclude that to have a total internal reflection light guiding index of the core should be higher than the cladding. Accordingly, guiding light in air is very dif-ficult and losses due to material absorptions and dispersion becomes significant. Another difficulty for these fibers are mechanical properties of materials. Gener-ally core-cladding structure fibers are made of rigid materials and so, fibers have a limited flexibility. The most common material for TIR fibers is silica because of its low absorptions at 1.55 µm, which is the wavelength that most of the optical communications systems operate. Basically both core and cladding are isotropic media and light guiding occurs in the region where both of the materials’ light cones intersect. A simple representation is in Fig. 2.6 for a typical silica fiber with core index 1.5 and cladding index 1.45.
The light waves coupled into the fiber has different propagation angles. Each of these propagation angles constitutes different modes. Each waveguide depend-ing on its geometry, dimensions and other optical properties allows sdepend-ingle or multi modes. A single mode fiber has a very small core (on the order of the wavelength) that the light wave does not have enough room to bounce off. Hence, in a single mode fiber light wave travels straight in the core of the fiber.
2.3.2
Photonic Band Gap Fibers
Photonic band gap fibers basically guides light by band gaps in different di-rections in the structure. The reflection mechanism and the band structure of dielectric structures are explained in sections 2.1 and 2.2. For waveguide and fiber structures geometry is two or three dimensional. Different periodicity in multi dimensions or cavity structures covered with mirrors constitutes small conduits for the propagation of light.
Figure 2.6: The propagation allowed light cones of the a conventional silica fiber with ncore=1.5 (ω1) and nclad=1.45 (ω2). The green area between light lines is
the propagation bands for the fiber structure.
As the optical signal transportation and integrated optical circuits continues to develop optical waveguide structures conserve its importance. Basic obsta-cles for the area is elasticity of the waveguide structures and loss mechanisms. As mentioned above, materials’ properties and limited guidance angle is a big problem for optical silica fibers. A similar problem is seen at metallic fibers that bending fibers increase loss due to absorptions. Hence, both TIR and metallic fibers have a very large critical radius of curvature. These reasons lead to an increasing interest in dielectric photonic band gap waveguides and fibers.
Photonic band gap structures can be grouped due to their periodicities: one dimensional, two and three dimensional. From the analogy of the solid crystals one can think these photonic structures as photonic crystals. One dimensional photonic crystals are basically layered structures which are explained in the pre-vious sections. Waveguide is constructed by trapping light in two dimensions, the structure is isotropic in two dimensions and the light guiding occurs in these directions (Fig. 2.7a) [33]. A two dimensional photonic crystal has periodicity in two dimensions and isotropic in the third dimension. Similarly, light guiding
Figure 2.7: (a) Waveguide structure with one dimensional photonic crystal guid-ing. Light propagation is in the x-direction. (b) An electron microscopy image of a hollow-core photonic band gap fiber. (c) Schematic illustration of propagation of electromagnetic waves hopping between the coupled evanescent defect modes on a bended path. (d) SEM image of the 3D photonic crystal which creates a bright green colour on the scales of Parides sesostris. Scale bars; (b) 10 µm, (d) 1.2 µm. Adopted from; (a) Taniyama [33], (b) Knight [30], (c) Bayindir [34], (d) Vukusic [35]
can occur in the isotropic direction. Two dimensional photonic crystals fibers are prominent examples of this kind of waveguides (Fig. 2.7b). Another light guiding mechanism in the 2D photonic crystals is using defects. An example can be seen in Fig. 2.7c. Using a series of cavities in close vicinity makes it possible to construct a defined path for the propagation of light at certain frequencies [30, 34, 36]. These wave guiding mechanism is widely used in integrated opti-cal circuits and it is possible to make the electromagnetic wave to pass through 90◦ corners. In 1991 Yablonovic and Gmitter fabricated first three dimensional photonic crystal with a complete band gap [37]. Functioning wavelength for the structure was at microwave but the following studies showed that it is possible to adjust the structure for particular wavelength by using different pitch size and different geometries [28]. There is an interesting example of three dimensional
Figure 2.8: An SEM image of a chalcogenide 2D PCF with kagome lattice. Scale bar 100 µm. Adopted from, Desevedavy [40].
photonic band gap structures in nature, on the scales of certain butterflies. For instance, Fig. 2.7d is an SEM image of photonic structures on the scales of
Parides sesostris. The structure is very close to tetrahedral structure which is
resulting in a very bright green color [35]. However, wave guiding in 3D crystals is again due to the cavity structures in close vicinity in three dimensions [38, 39]. A fiber is basically a two dimensional structure which is generally examined in polar coordinates. Their properties along their length is considered as the same extending to infinity since their aspect ratio is very high. Hence, optical properties of these fibers are examined only for cross sections. Optical fibers can be also used for different applications apart from wave guiding; however, main application examined and used in this thesis is propagation of electromagnetic wave through the fiber. The simplest form of the optical fibers are the core-cladding structured fibers which are explained in the previous sections. Besides TIR fibers, there are fibers in which guiding is done by photonic band gap. These photonic band gap structures has periodicity in radial or both in radial and angular directions. In the last few decades development in fabrication methods gave the advantage of guiding electromagnetic waves in air-cores. Air guiding is advantageous compared to solid core fiber because of linearity effects. In air the losses due to non-linearities are mostly eliminated. For example, a recent study shows an example of chalcogenide glass 2D photonic crystal fibers with a few dB losses (Fig. 2.8) [40]. Common material for the 2D PCF is silica. However, these type of fibers are
Figure 2.9: SEM image of cross-section of a hollow-core 1D PCF with PES/As2Se3
alternating layers. The fundamental band gap is at 3.55 µm. Adopted from, Temelkuran [12].
generally used for high frequency waves . On the other hand chalcogenide glasses have promising optical properties in the infrared region but 2D chalcogenide gals fibers are very new area.
One dimensional photonic crystal fibers are the main subject of this thesis and they have a simpler structure compared to 2D PCFs. In 1D PBG fibers, periodicity is along the radial direction; and hence, there is a band gap in all polar directions. Basic structure of the fiber is periodic dielectric layers around the air core with high and low index materials. Low index material is polymer and high index material is chalcogenide glass which have similar thermo-mechanical properties around the drawing temperature (explained in detail in Chapter 3). Fig. 2.9 is an electron micrograph image with alternating layers of PES and As2Se3 with fundamental band gap at 3.55 µm. Ease of fabrication and working
wavelength and hollow core makes these fibers promising candidates for high power laser beam delivery especially for medical applications [41, 10].
An important property of these structures is as long as QWS ratio is preserved between the layer thicknesses, it is possible to adjust the center frequency of the fundamental omnidirectional band gap. This property allows to fabricate different fibers, each working at different frequency, from one drawing process.
Gap Fibers
The extensive fabrication method of conventional optical fibers is thermal drawing [31, 42]. This method is also used for the fabrication of photonic band gap fibers (PBG) even for the ones with hollow-core [4, 43, 30]. Studies have shown that thermal drawing is a reliable fabrication method for multi-material PBG fibers as well [12, 13, 15, 44]. However, drawing is done at high temperatures where the materials are viscous. Hence, characterization of materials’ properties becomes very important to ensure material compatibility for both fabrication and optical performance of the fiber. Besides, fabrication process should be revised for the composite fiber fabrication.
In Chapter 2 necessity for high-index contrast for the optimum photonic band is explained. For the fabrication purposes, thermomechanical properties of mate-rials should be examined; material preference and fabrication parameter settings should be done accordingly. This chapter will focus on basic material properties necessary for successful fiber fabrication. We will first focus on the candidate ma-terials and then we will look at their optical and thermo-mechanical properties. Then we will adapt the conventional method for the new materials and focus on production of PBG fibers.
Figure 3.1: Thermal drawing is basically reducing feature size of a macro structure to micro scale at softening temperatures of materials. Figure is an image of schematics of 1D PBG fiber drawing.
The thermal drawing method used for conventional fiber fabrication has been a well established method for the last few decades. However, the method is generally used for glass and single material fibers. In the last decade studies are focused on fabrications of composite fibers for a variety of purposes and with very small feature size [12, 44, 15, 45]. The reason for big interest in thermal drawing arises from the fact that it is commonly used in industry and it allows to produce kilometer-long fibers with consistent properties in a very short time. Reports have shown that there are other methods to fabricate such composite small featured fibers [46, 47]; but, these methods are generally used for fabrication of very small laboratory scale samples [48]. Therefore, the focus of this chapter will be characterization of candidate materials and choice of the optimum set of materials which have compatible properties for both fabrication purposes and optical functions. Mostly our focus will be on enhancement of overall production process from the thin film production to the end product.
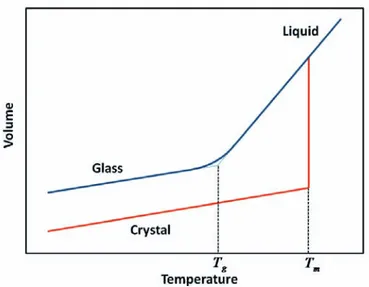
Figure 3.2: Schematic illustration of volume dependence temperature of a glass and a crystalline phases of a typical material. Here Tm is melting temperature
and Tg is glass transition temperature.
3.1
Materials Characterization
Glass or glassy materials are typical materials for thermal drawing processes due to their amorphous structure. Basically, amorphous materials do not have long range symmetry and this feature allows them to experience a continuous phase change upon heating. Crystals on the other hand have sudden changes in their properties such as volume and viscosity during the phase change from solid to liquid. Hence, amorphous or glassy materials are the best candidates for controlled mechanical deformation at high temperatures [49]. Therefore, one should choose glassy materials which will remain amorphous during the thermal processes such as thermal deposition and drawing. Fig. 3.2 illustrates a typical volume change of an amorphous material and a crystalline material.
The quasi-continuous change in viscosity is an advantage for fabrication of composite materials since it enables use of inorganic glasses and organic polymers at the same time [49, 50, 51]. However, there are some constraints in the fabrica-tion of glassy/thermoplastic composite structures. For instance, during thermal processes viscosities of materials must be close and they should experience similar plastic deformation under stress. In addition, adhesion of materials must be high
during evaporation and remain same during drawing and end product.
The dielectric properties of the materials are another important aspect for efficiency of fibers. After the production processes complete, the end product should have a large optical band gap and low penetration depth to eliminate ma-terial absorption. As stated earlier, this can be achieved by having high refractive index contrast material sets. Although in some studies it is claimed that high index contrast is limited for material sets that have similar thermomechanical properties [52], the studies afterwards indicated that it is possible to have very different materials showing similar thermoplastic properties and having high in-dex contrast [45]. Besides inin-dex contrast, low absorption property is also required from the materials. The objective of this study is transmitting high power CO2
laser beam. Hence, materials of interest should have no or very low absorption levels on the infrared region, especially around 10.6 µm.
Considering all the criteria mentioned above, best material choice will be chalcogenide glasses. Chalcogenide glasses are amorphous structures that contain Group-16 elements such as; selenium, sulfur and tellurium [53]. These materials generally have high refractive indices. Depending on the composition there are a big variety of chalcogenide materials. Basically they are categorized depending on their elemental composition; eg. two-, three- or four-component systems [54]. An important property is that chalcogenide glasses generally do not contain oxygen which is an advantage to work in high temperatures. In this study the candidate chalcogenide glasses are commercially available As2Se3 and As2S3 which have
infrared transparency (i.e. lossless in IR region). Another candidate is a four-component system contains Ge, As, Se and Te.
The composition of chalcogenide glasses affect important properties of these materials. For example, electronic structure of an element determines its coordi-nation number and tendency of cross-linking. As the cross-linking increase the degrees of freedom of atoms decrease and results in raise of softening point of the material [45, 54]. For instance, it has been reported that As40Se60 glass has
a viscosity value of 1013 Pa×s at temperature 170◦C, albeit As40Ge10Se50 has at
binding energy for their outer shell. Hence, their valance electrons has higher tendency toward polarization. This relation emerges an increase in dielectric constant, whereupon the refractive index. For example, As2Se3 has a dielectric
constant of 9.92 and when thallium including composite glass (20 at.%) has a dielectric constant of 22.3 [54]. In general chalcogenide glasses have high refrac-tive indices and they are very good candidates for high index material for the multi-material fiber.
For the low index material one can have different material candidates such as other glassy materials. For instance, SiO2 which is used for conventional optical
fibers. However, even though it is possible to change the melting point with different impurities, still the softening point of such oxide glasses are very high compared to chalcogenide glasses (in the range 750 - 1700◦C). Another material class is thermoplastic polymers since they have amorphous structure and are easy to process. Nonetheless, majority of these polymers have very low softening points except some commercial thermoplastics such as poly(ether-sulfone)(PES) or poly(ether-imide)(PEI). Measurements have shown that these materials have similar softening points with some simple structured chalcogenide glasses such as As2Se3 and As2S3 (Fig. 3.3).
In this study material set examined and studied in detail is as follows; high index material: As2Se3, As2S3 and Ge15As25Se15Te45(GAST), low index material:
PES, PEI. The following section of this chapter is about thermomechanical and optical characterization of these materials. Basically, glass transition, viscosity, wettability of materials and optical constants are determined for the optimization of production process.
150 200 250 300 -3 -2 -1 0 Temperature (oC) Heat Flow (W/g)
As2Se3 As2S3 GAST PES PEI
Figure 3.3: The DSC data of the materials set: chalcogenide glasses; As2Se3,
As2S3 and GAST. polymers; PES and PEI
3.1.1
Thermomechanical Properties
Thermal fiber drawing process requires a series of heat treatments and the last step requires a thermo-mechanically compatible material set. Hence, thermal behavior of materials should be examined for production of PBG fibers. For instance, for safety of the fabrication structure of materials should remain amor-phous. Additionally, glass transition and softening points of the materials should be measured. Fig. 3.3 is Differential Calorimetry System (DSC) data of our ma-terial set. Steps on the curves represent glass transition temperatures of mama-terials which are; for As2Se3 Tg=189 ◦C, for As2S3 Tg=209 ◦C, for GAST Tg=193 ◦C,
for PES Tg=220 ◦C, and for PEI Tg=217 ◦C. Hence, it is confirmed that all of
these materials have similar glass transition temperatures. The values are close enough to work. Basically Fig. 3.3 is a measure that all these materials have similar softening points.
An important property for the process is the viscosities of the materials de-pending on the temperature. Viscosity is basically a resistance of materials to flow under applied stress. One of the first mathematical definitions of viscosity is made by Trouton in 1906. Trouton defined viscosity as the ratio of applied stress
When this proportionality is constant, i.e. viscosity is independent of stress and strain, such materials are called Newtonian fluids. In this study, however, all the materials are non-Newtonian and viscosities are generally depend on applied stress. Previous studies have shown that estimating the viscosities using models for Newtonian fluids are enough for the design of he fabrication process [45].
Due to the structural differences in glassy materials and thermoplastic poly-mers, models for estimation of viscosity values are differ for these materials. For instance a study in 2003 gives some simple relations for the viscosities of glassy chalcogenides [56]. Tverjanovich reported that viscosity of chalcogenide glasses has a general form:
η = η0exp (En/RT ) (3.2)
Here, En is the activation energy and η0 is exponential constant. Activation
energy can be calculated by En = B + Cexp(D/T ); where the constants B, C,
and D should be determined experimentally. The coefficient B can be embedded into η0, and after taking the logarithm of Eq. 3.2, Arrhenius gives the empirical
viscosity relation for chalcogenide glasses as in Eq. 3.3 where the coefficients has specific values for different glasses [56];
log(η) = log(η0) + ( C exp(D/T ) 2.3RT ) (3.3)
A recent study on the fiber drawing with As2Se3 gives a similar relation for the
viscosity relation of As2Se3 in Eq. 3.4 using Vogel-Fulcher-Tamman formulation
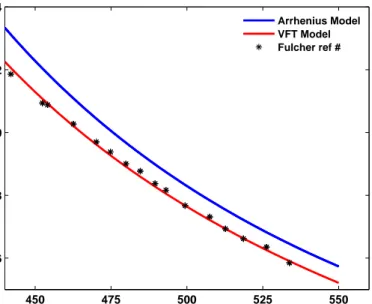
[57, 58]. In this formulation constants vary with the composition of glass. A comparison of these two models along with the experimental data are given in Fig. 3.4 where the constants for As2Se3 are given in Table 3.1. As it is seen from
450 475 500 525 550 6 8 10 12 14 Temperature (K)
Log Viscosity (Pa.s)
Arrhenius Model VFT Model Fulcher ref #
Figure 3.4: The comparison of Arrhenius and Vogel-Fulcher-Tamman models on the viscosity data (Fulcher, 1925) of As2Se3.
Table 3.1: Coefficients used to calculate the plot in Fig. 3.4. Arrhenius Model [56] Vogel-Fulcher-Tamman Model [58]
log η0 -3.09 C 18878 D 876 A 6.79 B 3569.20 T0 252.60
the figure Vogel-Fulcher-Tamman model gives smaller error assuming the data is very close to real values.
log(η) = −A +
( B
T − T0
)
400 500 600 700 800 900 1000 −5 0 5 10 15 Temperature (K)
Log Viscosity (Pa.s)
Figure 3.5: Viscosity behaviors of candidate chalcogenide materials.
For As2S3, there is not any study on the Vogel-Fulcher-Tamman model.
Hence, in this thesis we will use Arrhenius model for this glass with the coef-ficients: log η0=-3.62, C=33744.1, D=650.8 [56]. For the Ge-As-Se-Te system,
VFT model is reported on various compositions [59]. This study has shown that as the Te component decreases viscosity of the material also increases as explained above. The coefficients for the Ge30As13Se27Te30 are given as; A=8.1, B=4868
and T0=308.52K [59]. Here, we will use these coefficients for comparison
how-ever actual viscosity values should be lower than this result. Fig. 3.5 illustrates viscosity behaviors of the three chalcogenide glasses.
Similar to the chalcogenide glasses viscosity of thermoplastics are estimated using similar formulations together with Trouton relation. The model proposed for the polymers is called Williams-Landel-Ferry Model (Eq. 3.5) [56]. Here, the coefficients are given as C1=8.86 kJ/mol and C2=52.86 K. Tr=Tg+43 K.
The log η0 values are determined from the experimental measurements. Using
fabrication parameters together with Trouton relation for the uniaxial direction (Eq. 3.6) we were able to calculate specific viscosity values for PES and PEI. The change in strain is directly related to the change in volume of the preform and the produced fiber. Hence, the preform feed speed and fiber drawing speed gives exact
value of change in strain; dϵdt = ν−Vν . Using this relation, we measured viscosity of PES as 5.14×10⁴ P a· s at 289 ◦C (562 K) and viscosity of PEI as 1.19×10⁵
P a· s at 295 ◦C (568 K). Using this value and Williams-Landel-Ferry equation (Eq. 3.5) η0 values are found as 1.99×10⁸ P a· s for PES and 1.39×10⁹ P a· s
for PEI. Table 3.2 gives these values together with log η0, Tr values and Fig. 3.6
gives calculated viscosity-temperature dependence of candidate thermoplastics.
log(η) = log(η0) + ( −C1(T − Tr) C2+ T − Tr ) (3.5) σz = 3η0 dϵz dt (3.6)
Table 3.2: Calculated parameters of PES and PEI for the Williams-Landel-Ferry viscosity calculation model. Here, dϵ/dt = (ν − V )/ν where ν is fiber drawing speed and V is feed speed in m/s.
PES PEI ν (at 562K) 0.007 m/s V (at 562K) 1.50×10⁻⁵ m/s log η0 8.268 P a· s Tg 493 K Tr 526 K ν (at 568K) 0.0035 m/s V (at 568K) 0.87×10⁻⁵ m/s log η0 8.601 P a· s Tg 490 K Tr 523 K 500 550 600 650 700 750 800 850 900 950 0 2 4 6 8 10 12 14 16 18 Temperature (K)
Log Viscosity (Pa.s)
PES (WLF model) PEI (WLF Model)
500 550 600 650 700 750 800 850 900 950 −2 0 2 4 6 8 10 Temperature (K)
Log Viscosity (Pa.s)
550 600 650 2
3 4
Figure 3.7: The temperature viscosity dependence of the candidate material cal-culated using different models. The inset gives a close look to the region where all materials except GAST has close viscosity values.
Fig. 3.7 gives a complete comparison of viscosities of all candidate materials. As it is seen in the figure GAST glass has fairly different viscosity behavior than the others. Hence, at this point we eliminated GAST as a candidate material. For the remaining materials the optimum temperatures are ranging from 540-600 K (267-327 ◦C).
An important phenomena that should be considered for the design and fab-rication process is the capillary break-up limit for glass layers. First trials of the fiber fabrication showed that for the outer layers of chalcogenide glasses capillary break is very common(The fabrication process will be explained in detail in the next section). This means that there is a limit for the chalcogenide layers and hence there is limit for highest frequency transmitted by the fiber. This layer thickness limit is reported for As2Se3 as around 200 nm [12, 45]. Necessary layer
thicknesses for the same glass will be calculated in the following section. How-ever, studies have shown that it is possible to fabricate well functioning fibers with band gaps around 2-3 µm which require glass thicknesses around 200-250 nm.
Thermal fiber drawing process is done at fairly high temperatures and fab-rication of composite fiber structure requires materials to have similar thermo-mechanical properties. First of all, materials should have high crystallization temperatures and close glass transition temperatures. That enables them to have similar viscosity-temperature dependencies for a particular range. We have shown that using semi-empirical calculation, all of our materials have similar viscosity values for 540-600 K, except GAST glass which has higher viscosity values com-pared to other glasses. Still, studies have shown that it is possible to fabricate composite fibers containing small percentages of GAST glass [15]. However, we will not use GAST glass for the fabrication of high power laser delivery fibers.
In conclusion two chalcogenide glasses (As2Se3 and As2S3) and two polymers
(PES and PEI) have similar thermomechanical properties and can easily be con-sidered in the fabrication of photonic band gap fibers using thermal drawing process.
3.1.2
Optical Properties
Optical properties of materials have great importance for the function of end product since optical band gap is mostly depend on these properties. Hence, an optical characterization should be done for both choosing materials with lowest losses at the operating wavelengths and adjusting fabrication parameters. Using optical data of materials it is possible to calculate necessary film thicknesses for different wavelengths. However, this thesis will focus on specific laser beam deliveries for medical surgeries. Main focus of this thesis is fabrication of PBG fibers for CO2 laser beam delivery. Hence, we will design out whole process
considering the operating wavelength of CO2 laser which is 10.6 µm.
The first step for the optical characterization is to determine dispersion rela-tion of the materials. For this purpose a J.A. Woollam IR-Vase Ellipsometer is used to acquire ellipsometric optical data of the materials. Materials are deposited on crystal silicon substrates for certain thicknesses for measurements. Then el-lipsometric data is fit to Cauchy function which is given in Eq. 3.7 [60, 61].
tric constant; aj/bj is peak height at the resonance frequency; ωj is the resonance
frequency; and 2bj is the width of half maximum at the resonance frequency.
Eq. 3.7 basically gives the Kramers-Kronig relation between real and imagi-nary components of the dielectric constant casted into Cauchy formulation. A more convenient formulation is used by the ellipsometry system (Eq. 3.8) with the coefficients are determined via fitting the reflection signals of ordinary and extraordinary oriented light rays [62]. The results of measurements and fitting calculations are given in Fig. 3.8.
0 2 4 6 8 10 12 0.5 1 1.5 2 2.5 3 3.5 4 As2Se3 Wavelength (µm) Refractive Index 0 2 4 6 8 10 12 0 0.1 0.2 0.3 0.4 0.5 0.6 0.7 Extinction Coefficient
(a) Arsenic triselenide
0 2 4 6 8 10 12 0.5 1 1.5 2 2.5 3 3.5 4 As2S3 Wavelength (µm) Refractive Index 0 2 4 6 8 10 12 0 0.1 0.2 0.3 0.4 0.5 0.6 0.7 Extinction Coefficient (b) Arsenic trisulfide 0 2 4 6 8 10 12 0 0.5 1 1.5 2 2.5 PES Wavelength (µm) Refractive Index 0 2 4 6 8 10 12 0 0.4 0.8 1.2 1.6 2 Extinction Coefficient
(c) Poly (ether sulfone)
0 2 4 6 8 10 12 0 0.5 1 1.5 2 2.5 PEI Wavelength (µm) Refractive Index 0 2 4 6 8 10 12 0 0.4 0.8 1.2 1.6 2 Extinction Coefficient
(d) Poly (ether imide)
n(λ) = A + B λ2 + C λ4 k(λ) = β exp [ γ ( 1 λ − 1 L )] (3.8)
In Chapter 2, the necessity of high refractive index contrast is mentioned. High refractive index contrast is an important criteria when choosing glass-polymer material set. According to the measurements the refractive index of As2Se3 is
about 2.75 and of As2S3 is about 2.30 around 10.6 µm. Refractive index of
polymers are very close around 10.6 µm, however it can be seen from the figure that polymers have higher absorption values around the wavelength of concern. Extinction coefficient of PES is lower compared to PEI. Thus, PES is a better candidate for the fabrication of PBG fiber for CO2 laser delivery.
In summary, after a detailed examination of materials’ thermomechanical and optical properties best material set for the fabrication of dielectric Bragg fibers for guiding around mid-IR region is As2Se3 - PES glass-polymer system.
Fur-ther material properties specifically related to the fabrication steps and overall fabrication process will explained in the following chapter.
3.2
Fiber Design
Theoretical background of optical band gap and required properties for an efficient light guiding is explained in Chapter 2. In the previous section, other properties of materials are examined for the fabrication process and based on the measurements best material set for CO2 laser beam delivery is found as As2Se3 - PES system.
In this section, having all the properties of these materials we will focus on the design of the preform from which PBG fibers will be drawn.
A preform is basically a macro object which has the same structure with the resultant fiber by a factor. In order to draw fibers from a multi-material preform, thermomechanical properties of the materials must be similar. We have explained that both As2Se3 and PES close softening points i.e. similar viscosity