Full Terms & Conditions of access and use can be found at
http://www.tandfonline.com/action/journalInformation?journalCode=vjer20
ISSN: 0022-0671 (Print) 1940-0675 (Online) Journal homepage: http://www.tandfonline.com/loi/vjer20
Impact of sustained professional development in
STEM on outcome measures in a diverse urban
district
Robert M. Capraro, Mary Margaret Capraro, James Joseph Scheurich,
Meredith Jones, Jim Morgan, Kristin Shawn Huggins, M. Sencer Corlu, Rayya
Younes & Sunyoung Han
To cite this article: Robert M. Capraro, Mary Margaret Capraro, James Joseph Scheurich, Meredith Jones, Jim Morgan, Kristin Shawn Huggins, M. Sencer Corlu, Rayya Younes & Sunyoung Han (2016) Impact of sustained professional development in STEM on outcome measures in a diverse urban district, The Journal of Educational Research, 109:2, 181-196, DOI: 10.1080/00220671.2014.936997
To link to this article: https://doi.org/10.1080/00220671.2014.936997
Published online: 18 Feb 2016. Submit your article to this journal
Article views: 716 View related articles
Impact of sustained professional development in STEM on outcome measures
in a diverse urban district
Robert M. Capraroa, Mary Margaret Capraroa, James Joseph Scheurichb, Meredith Jonesa, Jim Morganc, Kristin Shawn Hugginsd, M. Sencer Corluf, Rayya Younesf, and Sunyoung Hang
aDepartment of Teaching, Learning, and Culture, Texas A&M University, College Station, Texas, USA; Aggie STEM Center, Texas A&M University, College
Station, Texas, USA;bDepartment of Education, Indiana University - Purdue University Indianapolis, Indianapolis, Indiana, USA;cDepartment of
Engineering, Charles Sturt University, Bathurst, NSW, Australia;dDepartment of Education, Washington State University, Vancouver, Washington, USA; eBilkent University, Ankara, Turkey;fCollege of Education and Human Development, Radford University Radford, Virginia, USA;gDepartment of
Education, Sungkyunkwan University, Seoul, South Korea
ARTICLE HISTORY
Received 27 October 2013 Revised 5 May 2014 Accepted 14 June 2014
ABSTRACT
Sustained professional development can support STEM (Science, Technology, Engineering, and Mathematics) reform. The authors describe a 3-year study of sustained professional development for 3 diverse urban schools across the salient factors offidelity of implementation of project-based learning, development of professional learning communities, and student achievement. Qualitative and quantitative data were collected. The students who experienced the greatestfidelity of implementation exhibited the greatest gains (d D 1.41–2.03) on standardized test scores, while those with the lowest fidelity of implementation exhibited negative gains (d D –0.16 to –0.08). Qualitative data indicated teachers perceived there were multiple benefits from the implementation of project-based learning.
KEYWORDS
High school; mathematics; professional development; project-based learning; science; urban schools
Although STEM (Science, Technology, Engineering, and Math-ematics) has been diversely defined by various researchers (e.g., Buck Institute for Education,2003; Capraro, Capraro, & Mor-gan, 2013; Scott, 2009; Wolf, 2008) during the last decade, STEM education has gained an increasing presence on the national agenda through initiatives from the National Science Foundation and the Institute for Educational Sciences (IES). Several states, such as Texas and Ohio, have also initiated state-wide STEM efforts focused on preK–12 schools (Herzog,2010). Additionally, STEM has attracted private sector interest from diverse groups, such as the Bill and Melinda Gates Foundation, the Houston Endowment, the Society of Manufacturing Engi-neers, and the American Association of University Women (Berry et al., 2004; Dyer, 2004; Toulmin, & Groome, 2007). Furthermore, a major national report, Rising Above the Gather-ing Storm (National Academies, 2007), prepared by leading participants from academia, corporations, and government, has garnered considerable attention.
That report was released at a time of growing concern over the future of the United States in an increasingly globalized and competitive world, particularly in relation to the demand for workers proficient in science and technology (National Acade-mies, 2007). The Committee examined existing research and trends regarding the science and technology enterprise in the United States and developed specific recommendations. The summary painted a solemn picture, expressing its concern that “the scientific and technological building blocks critical to our economic leadership are eroding at a time when many other nations are garnering strength” (National Academies,2007, p.
3). Particularly noted were inadequacies in science and mathe-matics education, deficiencies in research funding, and eco-nomic policies that stifle innovation in science and technology as factors limiting the number of qualified workers and threat-ening the future prosperity of the United States.
To remain competitive, the Committee recommended that the United States optimize“its knowledge-based resources, par-ticularly in science and technology” (National Academies,2007, p. 4). Recommendations included calls for increased recruit-ment of science and mathematics teachers, expanded teacher education, promotion of the STEM pipeline through K–12 edu-cation, greater research funding, and adoption of economic policies that would foster innovation in mathematics and sci-ence. While the report attracted widespread attention, it also has received some criticism from individuals who said it por-trayed a more severe situation than the data warranted. For example, Lowell and Salzman (2007) argued that existing data indicated that the performance of U.S. students in mathematics and science is actually improving or has remained stable and that the current system is producing more qualified graduates in science and engineering than there are open positions for these graduates tofill. Schools are starting to evaluate their own education systems and examining strategies that will increase the overall quality of STEM education to prepare students for jobs in a 21st century workforce. Researchers need to guide high schools by providing research that supports increasing the rigor of high school curriculum, addressing the needs of stu-dents who are college-bound, and improving excellence in teaching and leadership within schools. Thus the researchers
CONTACT Mary Margaret Capraro [email protected] 4232 TAMU, College Station, TX 77843-4232.
© 2016 Taylor & Francis
involved in this study were guided by the following research questions:
Research Question 1: What was the impact of sustained and systemic professional development (PD) on classroom enactments of project-based learning (PBL) on teacher enactments of STEM PBL in three urban high schools? Research Question 2: What effect does classroom
implemen-tation level have on student outcome measures? Research Question 3: What were the teachers’ perceptions of
their experience when (a) implementing PBLs in their classrooms, (b) implementing professional learning communities, and (c) receiving PD on the implementa-tion of PBLs and professional learning communities?
STEM and education
In recent years, concern about the mathematics and science achievement of U.S. students has led to increasing interest in STEM education. Cross-national comparison data have shown that U.S. students lag behind many other nations in student proficiency in mathematics and science, and data regarding degree attainment has shown that U.S. students receive fewer degrees in mathematics and physical sciences than students in many other countries (National Academies,2007). In addition, while the overall proportion of STEM degrees attained by U.S. students has remained fairly constant (approximately 17% of all degrees received), other nations have seen more rapid growth in receipt of STEM degrees (Kuenzi,2008). Data indi-cate lower levels of enrollment in mathematics and science courses among students of color in K–12 education and a lower retention rate in STEM majors in college (Museus, Palmer, Davis, & Maramba,2011). In response, there has been a grow-ing effort to promote STEM education and to encourage U.S. students’ achievement in STEM areas (Kuenzi, 2008). These efforts to promote STEM education are evident in the numer-ous federal and state initiatives and standards that aim to pro-vide funding and support for STEM education (Moyer-Packenham, Kitsantas, Bolyard, Huie, & Irby,2009).
STEM PBL activities are supported by the Common Core State Standards (CCSS), the Next Generation Science Stand-ards (NGSS), and the Texas Essential Knowledge and Skills (TEKS). When working on STEM PBL students follow the key components of engineering design, one of the key compo-nents of the NGSS (National Research Council,2013) through researching, reasoning, listening to other students’ ideas, per-sisting until an artifact is created, being able to critique other students’ ideas, revising, and deciding on appropriate tools and strategies (National Governors Association Center for Best Practices Council of Chief State School Officers, 2010). The TEKS address STEM content through student expecta-tions for courses in all four of the STEM areas that can be related to STEM PBL (Texas Education Agency, 2013). In addition, the TEKS are closely aligned to the college and career readiness standards that are also well suited to STEM PBL instruction (Texas Higher Education Coordinating Board,
2009). Two cross-cutting objectives common to all three are the following: (a) Students will communicate ideas, reasoning, and their implications using multiple representations such as symbols, diagrams, graphs, and language and (b) students will
generate solutions and make connections and predictions. More generally, TEKS statements include phrases or terms real-world problem-solving, or problems arising in everyday life to specify that problems students solve should include contex-tual situations. Similar to the TEKS, the CCSS Standards for Mathematical Practice are based on the NCTM Process Stand-ards and the NGSS include connections within and outside of a single subject matter. In mathematics, the CCSS for mathe-matics focus on problem solving specifying that students can apply what they know to solve problems arising in everyday life, society, and the workplace.
Efforts to promote STEM education have also been facili-tated through collaboration between universities and K–12 schools (Moyer-Packenham et al., 2009). Such efforts have taken several forms including PD for in-service teachers and STEM programming for K–12 students. Collaborative centers have also been established to facilitate partnerships between higher education institutions and K–12 schools, where univer-sity centers partner with school districts to provide STEM-oriented in-service education (Hailey, Erekson, Becker, & Thomas,2005).
Sustained professional development
The present literature regarding the effects of teacher PD on student achievement outcomes indicates differential effects depending on the quality and the specific features of PD pro-vided. Findings indicate that high-quality sustained teacher PD typically has statistically-significant positive effects on teaching practices and student outcomes (Garet, Porter, Desimone, Bir-man, & Yoon, 2001; Guskey & Yoon, 2009; Nadelson et al.,
2013; Supovitz & Turner, 2000Wei, Darling-Hammond, & Adamson, 2010; Yoon, Duncan, Lee, Scarloss, & Shapley,
2007). However, research has shown that many teachers do not experience high-quality PD, and these less effective PD experi-ences may have negligible effects on student achievement (Desimone, Porter, Garet, Yoon, & Birman, 2002; Wei et al.,
2010).
Nonetheless, a substantial body of research has demon-strated that teacher PD can benefit student achievement. For example, a longitudinal, quasi-experimental study by Saunders, Goldenberg, and Gallimore (2009) compared nine Title I schools receiving PD to six control schools in the same district and found that the PD schools had greater achievement growth on three years of state-mandated testing. These findings have been supported by previous research, which showed that teacher participation in PD is associated with continuous growth in state assessment scores across the years and increases in students’ academic achievement (Cohen & Hill,2000; Czer-niak, Beltyukova, Struble, Haney, & Lumpe, 2005; Loucks-Horsley, Love, Stiles, & Mundy, 2003; Schneider, Krajcik, Marx, & Soloway,2002).
Several characteristics of effective PD have been identified in the research (Guskey, & Yoon, 2009). In their longitudinal study, Desimone et al. (2002) identified six key features of PD, including three structural features (reform type, duration of PD, and collective participation) and three core features (opportunities for active learning, coherence, and content focus). Additionally, several studies have shown that the most
effective PD is intensive and sustained (Garet et al.,2001; Gus-key & Yoon,2009; Supovitz & Turner,2000; Yoon et al.,2007). K. Johnson, Hays, Center, and Daley (2004) defined
sustain-ability as the“continued ability of an innovation (infrastructure or program) to meet the needs of its stakeholders” (p. 137). The primary factor associated with statistically-significant posi-tive outcomes was 14 or more hours of PD. Studies that pro-vided fewer than 14 hr of PD did not have statistically significant effects on student outcomes (Yoon et al.,2007)
Further research is needed, though, to examine the connec-tion between the impact of PD on teacher knowledge and prac-tices and enhanced student outcomes (Penuel, Fishman, Yamaguchi, & Gallagher,2007; Yoon et al.,2007). In a research synthesis of PD effectiveness, there was a limited number of methodologically rigorous studies (Yoon et al.,2007). Studies, such as the one presented here, that take place in real world classroom settings and that make of use sophisticated statistical techniques to relate teacher classroom behaviors due to sus-tained PD to student achievement will strengthen the evidence base in this area.
To obtain sustainable innovation-based improvements in student achievement, change must be established systemically at the school level (Resnick & Hall,1998). Research shows that the key elements in building and maintaining this cycle of sus-tainable growth at the school level are the type and duration of PD provided to teachers and the extent to which they partici-pate in communities of practice (Smylie, Allensworth, Green-berg, Harris, & Luppescu,2001). Whole school sustained PD programs that are supported by focused collaboration among teachers will likely result in improved instructional practice (Hart & Lee,2003; C. C. Johnson, Kahle, & Fargo,2007).
Professional learning communities
In an era of standards-based accountability (No Child Left Behind Act of 2001, 2002), improving instruction to increase student achievement is of paramount importance. Within orga-nizational learning theory, expanding capacity, increasing new ways of thinking, and learning how to learn together (Senge,
1990) are mutually supportive and intertwined resulting in sys-temic school improvements. Professional learning communities provide organizations, such as schools, with a research-sup-ported way of increasing organizational learning (Argyris & Sch€on,1978; Hedberg,1981). Professional learning communi-ties can be characterized by several factors, including shared beliefs, values, and vision; shared and supportive leadership; collective learning; supportive conditions; and shared personal practice (Hord & Sommers,2008) in which administrators and teachers continuously learn together (Hord,1997).
There are two core beliefs that are foundational, though, to the application of professional learning communities in schools. The first belief is that the day-to-day experiences teachers share within the school assist them in helping their colleagues improve practice (Buysse, Sparkman, & Wesley,
2003). The second belief is that teachers who have time for col-laboration are able to improve their practice more than they would in isolation, by obtaining and using the knowledge of their colleagues (Talbert & McLaughlin,2002). Accessing col-lective knowledge is particularly important in PD situations
where teachers may be asked to adopt pedagogical changes that are foreign to what they have experienced or how they have previously taught (Darling-Hammond & McLaughlin,1995).
Because many schools struggle with the adoption of new pedagogy, some professional learning communities have been created to engage teachers in new ideas and methods within a supportive context (e.g., Englert & Tarrant, 1995; Hollins, McIntyre, DeBose, Hollins, & Towner,2004). In fact, multiple professional learning communities, including cross school, school based, and within school have been implemented to achieve pedagogical change (e.g., Englert & Tarrant,1995; Hol-lins et al.,2004; Huggins, Scheurich, & Morgan,2011; Louis & Marks,1998). Such pedagogical change often involves innova-tive instructional approaches that are intended to improve teaching and learning for diverse low socioeconomic status and underachieving students (Hollins et al., 2004; Phillips, 2003). One study (Hollins et al., 2004) showed how teachers who par-ticipated in professional learning communities over a two-year time period improved the literacy acquisition and development of African American elementary students. Indeed, professional learning communities have been found to maximize time spent in PD in several different socio-demographic contexts (e.g., Cochran-Smith & Lytle, 1999; Louis, Kruse, & Marks, 1996; Louis & Marks, 1998). However, most of the research has examined professional learning communities at elementary and middle grades with only a few published studies focusing on high school (Huggins et al.,2011; Louis et al.,1996; McLaugh-lin & Talbert, 2001) and even fewer specifically addressing STEM issues in sustained PD (Darling-Hammond, Wei, Andree, Richardson, & Orphonos,2009).
STEM project-based learning
The etiology of STEM PBL can be traced back to the origin of problem-based learning. The origin of problem-based learning was firmly rooted in the preparation of physicians. Patients possess a set of symptoms and the goal of modern medicine is to, as quickly as possible, arrive at the most likely diagnosis and commence treating or to employ a test to rule out that likely diagnosis (Flexner, 1910). The main purpose was to create a parsimonious yet robust solution set involv-ing convergent thinkinvolv-ing. As engineerinvolv-ing gained prominence after the first engineers were appointed in the military by President Washington circa 1775, both in formal apprentice-ships and university preparation, convergent thinking was dominant. As engineer preparation became more formalized in colleges and universities, there was a movement in the late 1800’s to reduce shop hours where engineers sought par-simonious and convergent solutions to science that fostered divergent yet robust solutions based on constraints (Thur-ston, 1891, 1892). Educationally, there was a great deal of emphasis on projects that were comprised of identifying needs and solving all problems that arise from the given solution path (Kilpatrick,1918; Noyes,1909). The education movement is often credited as having given rise to the idea of engineering design where classrooms rich in projects lead students to use reasoning skills (Wilhelm, Sherrod, & Wal-ters,2008). Given this rich history, STEM PBL makes heavy use of the engineering design process, where multiple and
diverse solutions are accepted and valued. The project is gov-erned by constraints and assessed by milestones (Polman,
2000) or rubrics that honor the inter/trans disciplinary nature of engineering. Final projects in which students accu-rately represent concepts (Wilhelm, Sherrod, & Walters,
2008) are often presented in writing, orally, or in other media as product marketing, funding solicitation, or commercialization.
STEM PBL was been defined as a “well-defined outcome with an ill-defined task” (Capraro, Capraro, & Morgan, 2013, p. 2) within an interdisciplinary framework. These ill-defined tasks can be complex and messy by nature (Bridges & Hallin-ger,1996; Torp & Sage, 1998). With ill-defined projects, stu-dents investigate interdisciplinary, rigorous, real-world topics (Chin & Chia,2006) that usually stem from a driving question or issue (Blumenfeld et al.,1991; Krajcik, Blumenfeld, Marx, & Soloway, 1994). According to Holbrook, Rannikmae, & Vald-mann (2014), project-based learning has been defined as a
model for classroom activity where the focus on the teacher is diminished and the focus on student activity is increased with a greater emphasis on long-term interdisciplinary and integrated addressing of real-world issues in a practice-based format. PBLs comprise many aspects and a variety of content combinations.1
In addition, research has shown that students learn bet-ter when they are engaged in meaningful activities (Fortus, Krajcik, Dershimer, Marx, & Mamlok-Naaman, 2005; Han-cock & Betts, 2002) that produce authentic artifacts (Hung, Tan, & Koh, 2006). Accordingly, using real-world problems within PBLs makes knowledge more relevant for students and increases the transfer of skills and information from the school setting to the real world (Bransford, Brown, &
Cockling, 2000; Colburn, 1998; Curtis, 2001; Satchwell & Loepp, 2002), thus promoting life-long learning (Dunlap,
2005).
There have been several studies examining the effects of PBL on student achievement. Students who participated in PBL units showed significantly higher pass rates on high stakes test-ing, demonstrating the efficacy of PBL for reducing the achieve-ment gap for urban African-American males (Geier et al.,
2008). PBL instruction resulted in students demonstrating higher levels of comprehension and application of concepts compared to when the same content was taught using a lecture format (Sungur & Tekkaya,2010; Wirkala & Kuhn, 2011). It was also found to improve science academic achievement for students from disadvantaged backgrounds (Lee, Buxton, Lewis, & LeRoy, 2006). In addition, developing PBLs within profes-sional learning communities made the adoption process go more smoothly (Krajcik et al.,1994). When qualitative studies were meta-synthesized it was shown that PBL instruction was more effective than traditional instruction to promote long-term retention of knowledge and skills (Strobel & van Barne-veld,2009).
Implementing STEM PBL has trade-offs. For example, while teachers valued PBL, they felt that the constraints of time, schedules, materials and facilities hindered their ability to fully implement PBL (Bradley-Levine et al., 2010). Another tension was that teachers struggled with implemen-tation of STEM PBL because they felt accountable for deliv-ering a standards-based curriculum to prepare students for end of year exams and standardized tests. One final tension was that teachers who were more content/achievement focused opposed to career skills focused had difficulty because they were not able to use traditional measures of
student achievement as a success indicator (Rodgers, Cross, Gresalfi, Trauth-Nare, & Buck,2011). Therefore, the tensions arose from time constraints, accountability, and personal paradigms.
Philosophical perspective and framework
Figure 1summarizes our framework in terms of a logic model. The message in the Gathering Storm supports our purpose and context for improving STEM education particularly at the high school level through sustained professional development (input). While various strategies have been tried and some studied (as discussed previously), there is still a substantial de fi-ciency in this area. In the current research reported here, the following activities were provided: an intervention of sustained PD provided by a university-based team of professors and grad-uate students working with high school educators on STEM PBL with the support of professional learning communities was studied in terms offidelity of implementation (short term outcome) and ultimately in terms of effects on student achieve-ment as measured by state accountability tests and perceptions of teachers on how the PD effected their classroom instruction (long term outcomes). Thus, the systemic intervention in terms of a logic model studied here examined how professional learn-ing communities can support PD with teachers in developlearn-ing STEM PBLs and how that unique pedagogical innovation in flu-enced both student achievement and teacher perceptions espe-cially in mathematics and science (see Figure 1, which summarizes our logic model framework for this study).
Method
The present study was a longitudinal investigation of urban sec-ondary STEM PBL and professional learning community PD using propensity score matching to compare two groups of stu-dents per school. In addition, longitudinal observational data were collected, and focus group interviews were conducted to better describe the effects. Student achievement on a state high-stakes test was used as an indicator of the effectiveness of the model because of the systemic and comprehensive nature of the implementation.
Study demographics
This study was conducted in an independent school district within a mid-sized urban area (population of 120,000) with an enrollment of 15,171 students. The district has 20 elementary schools, seven middle schools, and three high schools and largely serves a low-income population, with 83.1% of the stu-dents classified as economically disadvantaged. The demo-graphics of the student body included 34.9% Black, 50.9% Hispanic, and 13.6% White. Additionally, 14.4% of the students were classified as limited English proficient, 11.4% as special education, and 13.14% as bilingual/English as a second lan-guage. The state education agency accountability system assigns different ratings based on the performance of the particular school, including standardized test scores and graduation rate. Schools may receive one of four rankings including: recognized, acceptable, academically unacceptable, and not rated. During
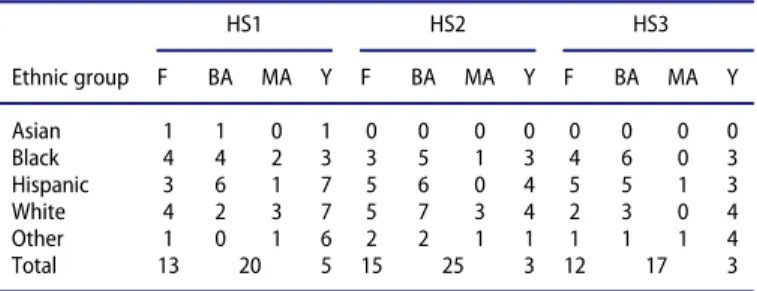
thefirst school year (inception of the study), 75% of the district students met state standards and nine campuses in the district were rated as“recognized” by the state education agency. The district had a high school completion rate of 85%, according to the state’s measurement of completion. The study took place in all three-district high schools with a total student population of 1,185 in Grade 9, 943 in Grade 10, 923 in Grade 11, and 750 in Grade 12. During the first study year, all three high schools were rated as academically acceptable by the state education agency. The salient teacher background variables are contained inTable 1. Proportionately, the schools had similar ethic com-position and years completed for teachers.
Intervention
A systemic, district-level initiated intervention occurred, con-sisting of three components: (a) PD delivered for a three-year period with 10 set days (60 hr per year, for a total of 180 hr over the course of the study using afixed set of PD providers, (b) development of professional learning communities, (c) classroom observations of PBL implementation within each school coupled with research-based PD for implementing pro-fessional learning communities. Classroom observations of PBL implementation and feedback were conducted throughout the three-year duration of the study. Baseline observations of PBLs were conducted before study inception by the research team. Initially the scope and sequence was arranged by best practices and then by needs assessment and careful analysis of proximal measures (such as benchmarking tests, teacher-made tests, and school-developed just-in-time measures) of school district change, including the results of the observations. The proximal measures were used solely to examine specific aspects of the intervention and changed over time, thus no stable esti-mates over time exist for those measures and will not be reported here.
The participants consisted of science, technology, engineer-ing, and mathematics teachers at three high schools (nSchool1
D 20, nSchool2D 25, nSchool3D 11). Classroom observation data
were used to directly measure the quality of classroom imple-mentation of the PBL PD, and student scores on the state’s high-stakes test were used as a measure of value added attrib-uted to the teachers’ implementation of the PD. The PBLs that were developed varied by discipline and covered many topics. The focus of the PBL content was on learning objectives where students scored low historically: measurement and problem solving in mathematics and science process skills and motion
Table 1.Salient teacher participant background information.
HS1 HS2 HS3 Ethnic group F BA MA Y F BA MA Y F BA MA Y Asian 1 1 0 1 0 0 0 0 0 0 0 0 Black 4 4 2 3 3 5 1 3 4 6 0 3 Hispanic 3 6 1 7 5 6 0 4 5 5 1 3 White 4 2 3 7 5 7 3 4 2 3 0 4 Other 1 0 1 6 2 2 1 1 1 1 1 4 Total 13 20 5 15 25 3 12 17 3
Note. Data from initial year of the study. F D female. No teacher held a PhD or EdD, degree (BA or MA) was highest held infield, Y D weighted mean years com-pleted at that school. No teacher was out offield in mathematics or science.
and energy. The lesson plans are lengthy and not contained here (for samples see Capraro, Capraro, Morgan, & Scheurich, 2010). Topics of the PBLs ranged fromfinding the applications for geometric figures found around their school community, finding the optimal area for cages in the local zoo, determining which summer jobs to apply for that allows students to make the highest salaries with the constraints of cost of transporta-tion and uniforms, designing a trebuchet that will toss the heaviest object the farthest, determining the greatest sources of pollution in their school community and develop a remediation plan, assuming a zombie apocalypse what would be the necessi-ties to assure survival, designing a car that travels the fastest given a ramp. Most of the PBLs were developed and access was provided across the school district during the profes-sional development. The school district’s curriculum specialists ensured that the STEM PBLs were placed into the district share box and assisted withfidelity of implementation.
PD framework
The PD program was initially designed to meet the needs of the district, school administration, and teacher participants. In some cases, these initial goals were not well aligned among the stakeholders, and thus it was the responsibility of the PD pro-viders to guide and merge the expectations of the stakeholders into a coherent PD plan. The resultant PD plan provided a coherent and systemic scope and sequence (yet with sufficient flexibility to accommodate emergent needs in subsequent years) for the three years (total of 30 days of PD) focused on STEM PBL pedagogical strategies, professional learning com-munities, and STEM content knowledge focusing on algebraic concepts most frequently missed and scientific process skills, motion, and energy. The district plan was to provide training for all teachers to increase awareness and understanding and to encourage support for interdisciplinary PBLs. Training was provided to a consistent set of 75 STEM teachers over the three-year period, however, periodically special education teachers, pull-out coaches, language arts, and art teachers par-ticipated. Their participation often depended on the topic. The agenda was provided to teachers 5 days in advance of each PD. Each PD was led by a single team member with support from other team members to facilitate small group interaction. A strict ratio of 10 teachers to one PD specialist was maintained throughout the three years. The PD titles specific to STEM PBL were (a) STEM PBL structure, (b) STEM PBL facilitation, (c) student participation, (d) resources, (e) assessment, and (f) STEM classroom learning environment (cf. Stearns, Morgan, Capraro, & Capraro, 2012). The sustained and systemic PD planning included the needs of all stakeholders, the delivery methods, assessment, and observations that were used for plan-ning each year.
Other topics covered during the sustained PDs covered: defining STEM and PBL, interdisciplinary STEM PBLs, the engineering design process, covering state standards while implementing PBL activities, classroom management considera-tions including grouping of students, questioning techniques, designing rubrics, formative and summative assessments, seam-lessly integrating technology into PBLs, developing PBLs for high school classrooms, and professional learning communities.
A book on STEM PBL (Capraro & Slough,2008) was provided to the teachers as a reference guide.
The PD process included iterative and recursive planning and implementation phases that assisted with designing subse-quent PD sessions. During the planning phases, the stakehold-ers participated in discussions about what was and was not working, planned activities, and allotted days to specific topics. They examined their own content knowledge and brought issues and concerns to their leadership teams and then PD was designed to address those concerns. Both strengths and weak-nesses were discussed with strengths incorporated into profes-sional learning community time and weaknesses addressed initially during formal PD by the provider. The initial year of PD focused on PBL-related pedagogy; ways to incorporate immediate response technology, calculators, and interactive whiteboards within the PBL classroom; and setting up profes-sional learning communities. The PDs were designed to help teachers integrate PBLs within their classrooms with a focus on PBL structure, PBL facilitation, and creation of a STEM sup-portive classroom-learning environment. The second year of PD focused on student engagement, managing PBL resources, and conducting assessments. The third and final year of PD provided advanced coverage of the same topics, while also help-ing teachers develop plans for sustainhelp-ing the innovation through their professional learning communities. Throughout the three years, teachers developed and taught one STEM PBL each grading period and shared their lesson plans through an electronic repository. STEM PBLs consisted of between five and seven lessons taught noncontiguously based on four tenets (e.g., Capraro et al.,2013): (a) active engagement, (b) projects are comprised of a well define outcome but an ill-defined task that requires students to develop and solve multiple problems with divergent solution sets, (c) student ownership of learning, and (d) multiple seamless formative and summative assessments.
Observations– Fidelity of implementation and
teacher implementation data
Teachers developed lessons that met the needs of their students based on prior student performance on district assessments. Therefore, three schools, seven subject courses across mathe-matics and science, eight grading periods per year, for three years equaled 378 STEM PBLs. Not all STEM PBLs were unique, some teachers borrowed one lesson framework and modified it to address their objectives of interest. Because teachers were addressing content in their classrooms broadly with one STEM PBL addressing potentially 6–8 objectives char-acterization of the lessons across this broad a spectrum would over generalize.
A teacher observation instrument was developed to measure the alignment of the PD to teachers’ classroom enactments of PBL with their students (Stearns et al., 2012) containing twenty-two items (indicators) organized into six categories, including: (a) lesson structure, (b) lesson facilitation, (c) stu-dent participation, (d) resources, (e) assessment, and (f) class-room learning environment. The number of indicators under each category varies. Each item can be evaluated on a 5-point Likert-type scale ranging from 0 (no evidence) to 5 (to a great
extent). The observer must justify every score assigned to each item. Occasionally, an item will not apply to what is taught dur-ing a particular observation. This may happen if the observer is only present for part of a lesson. However, well-documented lesson plans available prior to the observation typically pro-vided insight and additional information that allowed an item to be evaluated even if not directly observed. Nonetheless, the observer may still choose to indicate that a particular behavior (item) was not applicable or not observed during the class period.
Data analysis and participants
The data collected consisted of raw scores on the state account-ability instrument for mathematics, science, and language arts (reading), teacher observations, and focus group interviews with teachers and administrators. To address the potential issue of high student mobility (38% during thefirst year of data col-lection), a target population needed to be identified that con-sisted of the students most likely to be retained in the same school for three years, (i.e., Grade 9 through exit level taken in Grade 11). Students who were members of the following groups were omitted from the study due to the potential for high mobility or attrition: at-risk status, which included migrant, learning disabled, or early parenthood (Freudenberg & Ruglis,
2007; Gibson & Hidalgo, 2009; Morrison & Codsen, 1997). Also omitted from participation were students who were non– English proficient (cf. Ashby, 2010) and students receiving services that supplanted regular mathematics or science instruction, because these students were not likely to receive the intended program. Based on these criteria, 27% of the stu-dent population at the three high schools was excluded from the target population. The remaining 73% of students served as the target population for the study, which, nonetheless, was a highly diverse group primarily from low-income families. Without this adjustment, it would not have been possible to have a reasonably stable longitudinal study population. This initial selection comprised the student scores for each of the three years.
Teachers were the target population participating in the professional development. First, teachers’ level of PBL implementation was estimated by the classroom instruction observation instrument (Stearns et al., 2012). This resulted in high and low level implementers at each school. For the purposes of this categorizing, high and low were artifacts of each school and not overall across schools. Generally, teach-ers were tightly grouped above or below the mean for the school. Teachers above the mean constituted the high group while those below constituted the low group (high school 1 [HS1] D 7 above, 6 below; HS2 D 8 above, 8 below; HS3 D 5 above, 6 below). Mathematics and science teachers planned together and implemented different parts of the same PBL in their individually subject-focused classrooms. All teachers were all highly qualified by federal and state definition, had earned traditional teacher certification and on average had 4.32 years teaching (SDD 6.21 years).
Because both mathematics and science classes were implementing the program, the simple arithmetic mean
level of implementation was used across mathematics and science to select the student sample. The sample of interest (n D 60) was randomly selected from this population. The matched population consisted of the students who were enrolled in Grade 9 in teachers’ classes who demonstrated the lowest level of STEM PBL enactments based on class-room observations at each school, that is, below the mean at each school. The simple arithmetic mean was used across mathematics and science classes. The matched sample (n D 60) was selected using propensity score matching to the longitudinal group using one-to-one, nearest neighbor matching (Dehejia & Wahba, 2002) at each school. Student academic performance was matched in the selection process as well as for the courses the students had taken. This allowed for intraschool comparisons based on students’ ini-tial induction into the program. Because iniini-tial experience in Grade 9 often sets student academic expectations for the remainder of high school, there was interest in Grade 9 stu-dents and those teachers whose implementations were at the high and low extremes. In this regard, we expected that students might be influenced by their initial experiences (Cooper & Liou, 2007). Whereas, all the students would likely experience the average level of implementation at the school over the duration of the study, we wanted to be able to determine the relative importance of average fidelity within each school while comparing the highest and lowest initial implementation at each high school without intro-ducing inter-school variance. That is, comparing schools introduces salient and substantial factors (e.g., school cli-mate, administrator factors, school curriculum) that could not be modeled nor controlled (Shadish, Cook, & Campbell,
2012).
Quantitative research
Data were gathered for the year prior to the beginning of the project and for the next three successive years while teachers participated in the PD. Data from the state’s high-stakes accountability instrument were used to determine the gross improvement. The raw Texas Assessment of Knowledge and Skills (TAKS; the state’s accountability exam) scores for all three years were 0–54 (reading), 0–55 (science), and 0–59 (mathematics). The project was not intended to effect reading scores so reading scores were included as an estimate of overall change and as an indicator to determine whether some other factor may have been responsible for the observed changes. Therefore, only science and mathematics scores were expected to be sensitive to the innovation. For example, if reading scores were correlated with the mathematics and science scores, this would indicate contamination of the results. In addition, read-ing scores uncorrelated or disassociated with mathematics and science would indicate that the anticipated observed effect could be attributed to the innovation.
Data were collected on the quality of PBL implementation throughout the study using the observation instrument (Stearns et al., 2012). Research personnel received training in how to conduct observations using the observation instrument and subsequently conducted observations (contact the authors for a
copy). Interrater reliability was calculated using mixed pairs (James, Demaree, & Wolf, 1984) conducting simultaneous observations and reconciling immediately following the obser-vation. The mixed-pairs model ensured the raters did not become consistent among themselves while becoming totally different from other raters. The mixed-pairs model also ensured that each rater rated a different teacher and lesson with a unique partner for the purpose of calculating consis-tency. The inter-rater reliability was 100% agreement after rec-onciliation (97% before). The mean level of implementation was calculated based on the full instrument to answer the research questions.
Qualitative research
Qualitative research is generally used to gather the experiences or perspectives of one or more individuals (Lincoln & Guba,
1985; Marshall & Rossman, 2006). Accordingly, the spoken or written words of these individuals become the data for qualita-tive work (Creswell,2009). The most common method for col-lecting qualitative data is through interviews, which occur either in group or individual settings (Kvale & Brinkmann,
2009). In this study, the qualitative data were drawn from focus group interviews conducted with teachers. Patton (2002) described focus group interviews as “an interview of a small group of people on a specific topic” (p. 385). The size of the group, length of the interview, and the degree of interview structure, however, may vary.
In the present study, the size of the focus groups ranged from four to ten teachers with interviews lasting between 60 and 90 min in duration. All three qualitative researchers fol-lowed the same set of sequenced questions during the inter-view. The groups were conducted separately with mathematics teachers only or science teachers only at each of three high schools. This resulted in six focus group interviews conducted by three researchers. All of the interviews were digitally recorded.
The interview questions addressed the positive and negative experiences participants had with the sustained PD on STEM PBL, implementation of PBLs, and their professional learning communities. Specifically, the questions addressed such topics as the positives and negative aspects of the PD on STEM PBL and professional learning communities, the implementation of STEM PBL in their classrooms, the reactions of their students to PBL, and the implementation of professional learning communities.
After conducting the focus group interviews, the next step was to analyze the data. Typically, interview data are coded in small chunks of words that have meaning for the researcher in reference to the study. These coded chunks are then combined into logical categories, followed by aggregating categories into themes (Lincoln & Guba,1985; Miles & Huberman,1994; Pat-ton,2002). Because in this study all interviewers followed the same sequence of questions, a more simplified approach was employed. An innovative software program, Microsoft One-Note (Microsoft Corporation, Redmond, WA) was used instead of the more traditional approach of transcribing all of the inter-views for data analysis (Silverman,2010). Microsoft OneNote enables listening to an audio recording and type notes while
listening. The notes are digitally connected or keyed to the spe-cific part of the interview that is being listened to on the record-ing when the note is typed. When a specific quote from the interview is needed, it is possible to return via the code to the recording and just transcribe the segment needed. While this transcribing process might not work with more unstructured, complex interview material, it worked well in this study because of the structured interview format.
In this study, each interviewer listened to her or his record-ings, coded the responses to each question, and then catego-rized the codes for each question when a higher level of abstraction was warranted. The next step was aggregating and thematizing the codes and categories of all three interviewers by the group. This process resulted in the identification of six themes.
Results Quantitative
The observation instrument results showed that by the third year of the innovation, there was marked improvement in mean scores for each of the six categories from baseline obser-vations in the year prior to study inception through the next three years. The longitudinal observation results indicated that mean observational patterns emerged within schools clearly disaggregated by level of implementation. HS3 demonstrated the highest mean scores of indicators, followed by HS2 and HS1. Teachers in HS1 showed the lowest implementation level, which was typified as the mean of most indicators being below 2.5 and called level 1. Teachers in HS2 demonstrated mean scores of indicators clustered around 2.5, which was designated a middle implementation and termed level 2. Teachers in HS3 had the highest implementation level that was typified by a mean of 3.5 and the means of all indicators being above a 2.5, which was considered a high implementation level of the inter-vention and called level 3. For a complete reporting of the char-acteristics at each level please see Stearns et al. (2012).
HS1. The teachers in this school (n D 20) demonstrated a level one implementation with the mean of all but one indicator
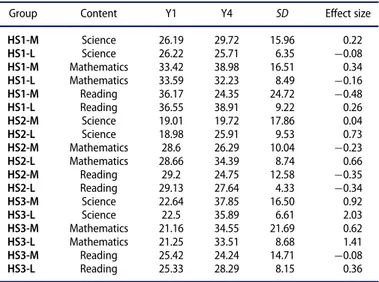
Table 2.Means, standard deviations, and effect sizes by school and content.
Group Content Y1 Y4 SD Effect size
HS1-M Science 26.19 29.72 15.96 0.22 HS1-L Science 26.22 25.71 6.35 ¡0.08 HS1-M Mathematics 33.42 38.98 16.51 0.34 HS1-L Mathematics 33.59 32.23 8.49 ¡0.16 HS1-M Reading 36.17 24.35 24.72 ¡0.48 HS1-L Reading 36.55 38.91 9.22 0.26 HS2-M Science 19.01 19.72 17.86 0.04 HS2-L Science 18.98 25.91 9.53 0.73 HS2-M Mathematics 28.6 26.29 10.04 ¡0.23 HS2-L Mathematics 28.66 34.39 8.74 0.66 HS2-M Reading 29.2 24.75 12.58 ¡0.35 HS2-L Reading 29.13 27.64 4.33 ¡0.34 HS3-M Science 22.64 37.85 16.50 0.92 HS3-L Science 22.5 35.89 6.61 2.03 HS3-M Mathematics 21.16 34.55 21.69 0.62 HS3-L Mathematics 21.25 33.51 8.68 1.41 HS3-M Reading 25.42 24.24 14.71 ¡0.08 HS3-L Reading 25.33 28.29 8.15 0.36
below a 2.5. In HS1 there were two teachers considerably above the mean for that school on the initial observation (¡ XD 1.72, SDD 0.22) while still indicating a poor implementation. Addi-tionally, there were three teachers considerably below the mean (¡ XD 0.37, SD D 0.25), in essence, no implementation. At the end of the study, teachers in HS1 were closely grouped around the mean (¡ XD 1.83, SD D 0.42), indicating an overall poor implementation (seeTable 2).
Student performance for HS1, as measured by state account-ability tests, showed little change across the years. The statistics were obtained byfirst calculating the mean scores on the state accountability test for each longitudinal and matched group and the effect size was calculated using mean difference from inception to the final year of the project dividing the pooled standard deviation for both years. The longitudinal group (ND 54) lost 6 due to attrition, the matched group (n D 19) lost 41 due to attrition. The results indicted a positive effect for reading. The project was not intended to impact reading (lan-guage arts). The longitudinal group exhibited increased reading scores (Cohen’s d D 0.26), while both mathematics and science scores remained consistentlyflat across those years (Cohen’s d D –0.16, 0.08) with an overall retention of 54 students out of the initial 60 students. The propensity score matched group showed improvement in mathematics and science (Cohen’s d D 0.34, 0.22), while scores in reading showed negative growth (Cohen’s d D –0.48), but only 19 of the original 60 students remained in this group. Because the changes in reading scores were not a focus of this study, the differential results may be evidence that the trajectory was unrelated to the sustained PD. Because the selection criteria were highly useful for predicting retention in the other two cases, it was not readily apparent why the propensity score matched group in this school did not reflect similar retention as all the other groups. Therefore, the positive effects by the propensity score matched group were for a select group of students who remained. While there were no data to explain the attrition, it is possible that students who experienced a poor PBL implementation in Grade 9 had impor-tant differences in initial experiences as compared to those stu-dents who experienced virtually no implementation, or perhaps there may have been important teacher differences not mea-sured by the observation instrument (seeTable 3).
HS2. The average implementation to which raters were trained was a mean of 2.5. The teachers in HS2 (nD 25) dem-onstrated a level two implementation with mean scores clus-tered around 2.5 within the range of 2.0–3.0. In HS2, there were three teachers considerably above the mean for the school on the initial observation (¡ XD 1.79, SD D 0.33); additionally,
there were four teachers considerably below the mean (¡ XD 1.09, SDD 0.17). By the end of the study, the teachers in this school exhibited similar variance to the start of the study except the mean had increased substantially (¡ XD 2.78, SD D 0.42), indicating an overall average implementation (seeTable 2).
The statistics presented here were computed in the same way as for HS1. HS2 student performance showed moderate gains across the years for mathematics (Cohen’s d D 0.66) and science (Cohen’s d D 0.73) but negative effects for reading (Cohen’s d D –0.34), although no changes in reading were expected. The longitudinal group had an overall retention of 56 students out of the initial 60 students. The matched group showed modest negative effects for mathematics and reading (Cohen’s d D –0.23, –0.35), respectively, and no effect for sci-ence (Cohen’s d D 0.01) with an overall retention of 57 stu-dents (see Table 3). Students in HS2 were likely to have experienced average fidelity of implementation from their teachers over the entire study.
HS2 had the greatest teacher attrition of the three schools. The principal replaced all but one teacher out of the entire mathematics department during summer of 2008. The princi-pal replaced the teachers due to a lack of commitment to the innovation as well as other factors related to teaching perfor-mance. During the interview process a paramount concern was the new teachers’ willingness to adopt an active and positive stance toward the innovation. These new mathematics teachers participated in the three-day summer PD and six make-up ses-sions during the fall of thefirst study school year and worked with their team during their school site professional learning communities.
HS3. A mean implementation of 3.5 with all indicators above 2.5 was considered a high implementation of the inter-vention or a level 3 implementation. HS3 typified this level of implementation with one teacher considerably above the mean for the initial observation (¡ XD 2.76, SD D 0.41), indicating an average implementation; additionally, two teachers per-formed considerably below the initial mean (¡ XD 1.19, SD D 0.45), indicating a poor implementation, but by far HS3 dem-onstrated the highest level of implementation among the three schools. By the end of the study, teachers in HS3 exhibited much less variance as compared to the study start with the mean increasing considerably (¡ XD 3.6, SD D 0.23), indicat-ing a high implementation (seeTable 2).
Longitudinal student performance showed impressive gains across the years for mathematics (Cohen’s d D 1.41) and science (Cohen’s d D 2.03) and a modest effect for reading (Cohen’s d D 0.36) with an overall retention of 53
Table 3.Mean STEM PBL enactments by observation category and school across years.
High School 1 High School 2 High School 3
Category Y1 Y2 Y3 Y4 Y1 Y2 Y3 Y4 Y1 Y2 Y3 Y4 Structure 0.46 1.53 1.65 1.44 1.01 1.28 2.01 2.93 0.076 1.28 3.20 4.04 Facilitation 1.82 2.09 2.31 2.19 1.24 1.43 2.40 2.72 1.34 1.72 3.54 3.93 St. Part. 1.74 2.72 2.88 2.65 2.01 2.25 2.45 2.34 2.44 2.30 2.67 3.38 Resources 1.45 1.75 1.65 1.57 1.75 2.50 3.29 3.54 2.34 2.21 3.07 3.97 Assessment 0.88 1.56 1.40 1.32 1.00 1.20 3.40 2.93 1.24 1.53 2.03 3.19 Learning environment 2.01 3.30 2.53 1.78 2.09 2.21 3.02 2.74 1.98 1.76 3.45 3.58
students of the initial 60 students (see Table 3). The matched group also showed important positive effects for mathematics and science (Cohen’s d D 0.62, 0.92) and a negative effect for reading (Cohen’s d D –0.80) with an overall retention of 55. HS3 exhibited the greatestfidelity to the intervention, and after reducing variance on teaching performance in the second year, the teachers in this school consistently grew in fidelity. Furthermore, there was no teacher attrition in the STEM fields. The large growth in both student groups might account for two important differences at HS3. Students were likely to have had teach-ers with high fidelity for all three years of the study. Addi-tionally, differences between the teachers were generally small, making differentiating between teachers’ fidelity unimportant.
An important difference emerged in the variance between student scores. While the variance between the lon-gitudinal and matched groups was nearly the same at the start of the study, the variance had decreased for the longi-tudinal group, perhaps indicating that teachers with the highest fidelity at the inception of the study helped to reduce within group variance as compared to teachers with a poor initial implementation. This is speculation, and other plausible explanations may exist for the decrease in student score variation.
Qualitative results
The qualitative data were based on two types of focus group interviews—mathematics and science professional learning communities within each high school for a total of six focus group interviews. Thus, there are qualitative data from each high school, but this was not done in a way to provide a com-parison among the three schools, though there is a published, in-depth study of the school with the highest fidelity to the intervention and the best results (Huggins et al.,2011). Instead, the qualitative data will be used to present themes that emerged from analyzing all of the teacher focus groups conducted for both science and mathematics teachers in all three schools. These data were intended to provide some richness and depth to the effects found in the quantitative analyses. The main themes (seeTable 4) that emerged from the qualitative analyses included teachers’ (a) general experiences from using PBLs in their classrooms, (b) perceived changes in teaching methods drawn from using PBLs in their classrooms, (c) general experi-ences with professional learning communities, and (d) teachers’ perceptions of the PD provided to them on PBLs and profes-sional learning communities. Thus, these qualitative data do not addressfidelity comparisons but the teachers’ experience of doing project-based learning in this particular district context.
Teachers’ general experiences from using PBLs in their classrooms
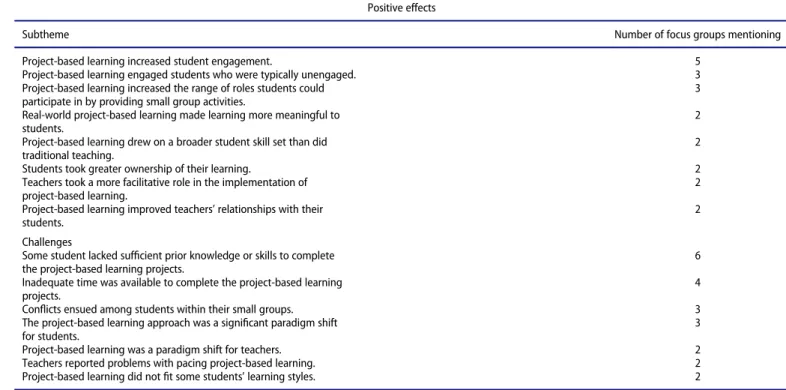
District wide, the teachers indicated that there were major posi-tive effects and some significant challenges from implementing PBLs. The strongest positive effect that was reported (con-firmed by five out of six focus groups) was that the PBLs increased student engagement. This result was particularly important because one of the major reported problems in diverse high schools is the lack of engagement of diverse urban students (National Research Council and Institute of Medicine,
2004). A second positive effect reported by three focus groups was that PBLs engaged students who were typically unengaged, another desired result. For example, one teacher stated,“I find that more students are getting involved in the lab. Some of those that would just sit off to the side in a regular lab that are relying on the lab partners to do the work actually got involved in the project.” Similarly, another teacher in different group said,“[The PBLs] drew some interest from students who may not have been interested otherwise because you could say directly‘this relates to your project.’ And then they would listen to the lesson a little more intently.” This helps explain the first point, as it indicates that some of the increased student engage-ment likely came from engaging the typically disengaged stu-dents. A third positive effect reported by three focus groups was that PBLs increased the range of roles students could par-ticipate in by providing small group activities.
There were five more positive effects regarding PBLs that were supported by two focus groups: (a) real-world PBLs made learning more meaningful to students; (b) PBLs drew on a broader student skill set than did traditional teaching; (c) stu-dents took greater ownership of their learning; (d) teachers took a more facilitative role in the implementation of PBLs; and (e) PBLs improved teachers’ relationships with their stu-dents. An example that illustrates the third positive effect of greater student ownership was that students became attached to their projects and their role in the project, such as contribut-ing a drawcontribut-ing that illustrated their group’s collaborative work. The teachers also reported that their students wanted to display their projects for other students and teachers to see. Thus, it can be observed that several of the positive effects reported by teachers related to greater student engagement, while other positive effects were related to pedagogical improvements.
The teachers also discussed some of the challenges encoun-tered while implementing PBLs in their classrooms. The great-est challenge the teachers reported (supported by all six focus groups) was that some students lacked sufficient supporting knowledge or skills to complete the PBLs. One teacher stated,
Many of our students have a difficult time reading, and some of them don’t understand what they’re reading so if they’re not
Table 4.Main themes from qualitative analyses.
Theme # Theme
1 General experiences from using project-based learning in their classrooms
2 Perceived changes in teaching methods drawn from using project-based learning in their classrooms 3 General experiences with professional learning communities
understanding what they’re reading, then that’s going to affect the way they’re writing. They go hand in hand.
Another teacher stated,
Our kids are, generally speaking... seventy to eighty percent of our kids are behind where they should be mathematically... so PBLs are interesting, but trying to make itfit with all the stuff that they don’t know... [for teaching science] makes it interesting.
The second greatest challenge to PBL implementation (reported by four focus groups) was that there was inadequate time to complete the PBLs. One teacher stated,
Ultimately, it just boils down to not having enough time. My kiddos go out there and, you know, like we’ve done a few projects now. But, the thing is I never feel like we’ve ever had the chance to really truly go into it, do it, and then do the follow up on it. I feel like we get halfway there, and we get the momentum going. And then, we have to go on to another thing. You know, it’s never enough. A few days, two days, three days isn’t enough to finish a complete project for most of my kiddos. We have to keep up with [curriculum].
Three focus groups brought up two additional challenges encountered in PBL implementation: (a) conflicts among stu-dents within their small groups (e.g., unequal work, personality conflicts) and (b) the PBL approach was a significant paradigm shift for students. Regarding the paradigm shift for students, teachers stated that students were so used to traditional instruc-tion that adapting to a PBL-oriented classroom was difficult for them. One teacher pointed out that the students had experi-enced traditional instruction from kindergarten through mid-dle school so it was difficult for them to accept a substantially different approach in high school. Finally, there were three additional challenges brought up by two focus groups: (a) PBLs were a pedagogical paradigm shift for teachers; (b) teachers reported problems with pacing PBLs; and (c) PBLs did notfit
some students’ learning styles. Regarding the pacing issue, one teacher stated,
One thing for me is... trying to know when I’m giving enough time versus too much time, whether the kids are just dragging their feet versus they’re really working with the material. It’s just very difficult for me to know when I need to say,“Okay this is a firm and hard deadline, and we’re going to stick to it,” versus “Okay. I can see everybody’s struggling, so I’ll give you guys one extra day or maybe, two extra days.”
Thus, the teachers reported some challenges they faced in implementing PBLs and some that the students faced. It might be expected, however, that with more teacher and student expe-rience in implementing and participating in PBLs, many of these challenges would dissipate.
Teachers’ perceived changes in teaching methods drawn from using PBLs in their classrooms
The focus groups reported eight different ways that their teach-ing methods changed from implementteach-ing PBLs (seeTable 5). Four focus groups said that implementing PBLs in their class-rooms placed them in a more facilitative role and in less of a direct teaching or lecturing role. For example, one teacher said, “When kids ask me questions [about the PBL], I ask them, What does your team say? Go ask your teammates.” And they are like,“oh, okay.” Three focus groups reported that they used more real-world projects in their teaching, and three different focus groups reported that using PBLs in their classrooms pro-moted individual student accountability and ownership.
There were two categories under this theme reported by two focus groups, and three categories that were brought up by only one focus group. Two focus groups reported that the PBL process helped their students see that they knew more than they thought they did. The second category, which was
Table 5.Subthemes for Theme 1: General experiences from using project-based learning in their classrooms. Positive effects
Subtheme Number of focus groups mentioning
Project-based learning increased student engagement. 5
Project-based learning engaged students who were typically unengaged. 3
Project-based learning increased the range of roles students could 3
participate in by providing small group activities.
Real-world project-based learning made learning more meaningful to 2
students.
Project-based learning drew on a broader student skill set than did 2
traditional teaching.
Students took greater ownership of their learning. 2
Teachers took a more facilitative role in the implementation of 2
project-based learning.
Project-based learning improved teachers’ relationships with their 2
students. Challenges
Some student lacked sufficient prior knowledge or skills to complete 6
the project-based learning projects.
Inadequate time was available to complete the project-based learning 4
projects.
Conflicts ensued among students within their small groups. 3
The project-based learning approach was a significant paradigm shift 3
for students.
Project-based learning was a paradigm shift for teachers. 2
Teachers reported problems with pacing project-based learning. 2
reported by two focus groups, was that PBLs gave the students more freedom to learn from their mistakes. The three catego-ries that were reported by only one focus group included: (a) as teachers, they have learned that students“doing it themselves learn better”; (b) that they do less “drill and kill” in their class-room; and (c) PBLs provides an alternative teaching method for new teachers.
Teachers’ general experiences with professional learning communities
Professional learning communities were an integral part of the PD the teachers received. The district supported the profes-sional learning communities by providing one extra period per day for teachers to collaborate that were constructed around the research-based characteristics of professional communities, including shared values, reflective dialogue, deprivatization of practice, focus on student learning, and collaboration (Kruse et al.,1995). This period was an addition to the one individual planning period allotted to teachers. In the focus groups, the teachers were asked to discuss the positive and negative aspects of the professional learning communities.
Five of the focus groups reported that professional learning communities provided more time for the teachers to learn from each other (a specific goal of professional learning communi-ties) and provided strong support for the development of their PBLs (e.g., McLaughlin & Talbert, 2001). One teacher said, “Improvement in teaching strategies has occurred because of the collaboration between new and old teachers.” Another teacher stated,“This has been my first year teaching chemistry, so without the [professional learning communities], I wouldn’t have been able to improve with my kids, to teach, to complete everything because... .we help each other all the time. We talk. We share comments [and] concerns when we get together.” Three focus groups reported two other categories: (a) time to plan together and (b) enhanced communication among teach-ers. Two focus groups reported that professional learning com-munities made teachers feel less isolated and supported new teachers in adopting the curriculum. Finally, four categories were reported by only one focus group. These categories included: (a) professional learning communities provided time to collectively diagnose students’ strengths and weaknesses, (b) professional learning communities resulted in teachers being more attached to the success of their colleagues, (c) professional learning communities helped teachers become better at team-ing, and (d) professional learning communities enabled more sharing of supplies and equipment.
Regarding negative aspects of professional learning commu-nities, two categories were provided by three focus groups. First, three focus groups reported that school leaders sometimes interrupted professional learning community meetings. Addi-tionally, three focus groups reported that some professional learning community time was not spent on discussion related to teaching and learning. Three categories were reported by two focus groups: (a) there was a need for more professional learning community time; (b) subject-focused professional learning communities did not provide time for interdisciplinary collaboration; and (c) group consensus was time consuming and perceived as sometimes more difficult than individual planning. For instance, one teacher commented on the need for
interdisciplinary work, “I think the interdisciplinary thing is key because they’ve given within-subject matter, that common planning time, but we don’t have that cross-subject matter.”
Teachers’ perceptions of the PD provided to them on PBLs and professional learning communities
There were many positive aspects of the PD reported, but most were brought up by only one focus group. Three focus groups reported that the opportunity to plan PBLs with the PD trainers was beneficial. Two focus groups reported that the opportunity to work with teachers from other schools during PD was also beneficial. Two focus groups also praised the trainers for the materials provided during the PD. Additionally, two focus groups reported that the teachers had received PD on how to work effectively in professional learning communities. The rest of the categories were provided by only one focus group each: (a) teachers praised the hands-on nature of the PD, (b) teachers appreciated the ability to readily turn their ideas into curricu-lum use, (c) teachers offered praise for specific PD trainers, (d) teachers reported that they liked the individual feedback they received from the PD trainers, (e) teachers said the PD was pro-fessionally done, (f) teachers reported that the trainers were willing to adapt to their feedback, (g) teachers reported that the time provided within PD to develop guidelines for individual teacher teams was helpful, and (h) the initial training was viewed as beneficial for helping teachers to get started on work-ing effectively in professional learnwork-ing communities.
Regarding negative aspects of PD, one theme was brought up byfive focus groups, and this was a desire for more concrete examples of PBLs used in other schools. There were a range of other criticisms provided by two focus groups: (a) at times teachers felt evaluations of their individual PBLs were not given back quickly enough, (b) teachers reported that they needed more guidance during the first year of PBL implementation, and (c) some teachers felt they did not need follow-up profes-sional learning community training.
Discussion
Without question, effectively bringing STEM into high school classrooms is a critically important issue (Kuenzi,2008). How-ever, there is very little research that investigates how this might be done and done in such a way that improves student learning (U.S. Department of Education,2007), especially in mathemat-ics and science, which are generally weak areas nationally (National Academies, 2007). Furthermore, there is a lack of research on STEM initiatives that are highly successful with diverse, urban high school students (Museus et al.,2011). This study may, thus, be thefirst that addresses all of these needed areas.
This study demonstrates that sustained and systematic high-quality, research-based PD on STEM-oriented PBLs and pro-fessional learning communities could lead to major student learning gains, as measured by state accountability measures, when there was a high-quality implementation of the initiative. This latterfinding is very important, as this study shows that low-quality implementation of a new initiative actually hurt student learning. This finding could be mediated through teacher content knowledge. However, we did not neither