T
ECHNICALB
RIEFPATIKAmad: Putting microarray data into
pathway context
Ozgun Babur
1, Recep Colak
2, Emek Demir
3and Ugur Dogrusoz
1, 41Center for Bioinformatics, Bilkent University, Ankara, Turkey
2Computing Science Department, Simon Fraser University, BC, Canada 3Computational Biology Center, MSKCC, New York, NY, USA
4Tom Sawyer Software, Research Division, Oakland, CA, USA
High-throughput experiments, most significantly DNA microarrays, provide us with system-scale profiles. Connecting these data with existing biological networks poses a formidable chal-lenge to uncover facts about a cell’s proteome. Studies and tools with this purpose are limited to networks with simple structure, such as protein–protein interaction graphs, or do not go much beyond than simply displaying values on the network. We have built a microarray data analysis tool, named PATIKAmad, which can be used to associate microarray data with the pathway models in mechanistic detail, and provides facilities for visualization, clustering, querying, and navigation of biological graphs related with loaded microarray experiments. PATIKAmad is freely available to noncommercial users as a new module of PATIKAweb at http://web.patika.org.
Received: August 7, 2007 Revised: December 19, 2007 Accepted: February 10, 2008
Keywords:
Bioinformatics / Gene expression / Molecular interaction / Pathways
2196 Proteomics 2008, 8, 2196–2198
Pathway databases contain information about possible interactions and reactions between molecules in a cell. Usually, this data is created by manually curating biological literature and can span multiple experiments from different tissues, organisms, and contexts. When taken as an inter-connected network, these interactions and reactions offer a causal model of a cell’s response to stimuli. For instance, in a typical microarray experiment, relatively small portions of this network are differentially active between the control and the sample, and determining these parts can be extremely useful for finding causal explanations for the correlations observed in the data.
There are many microarray specific statistical tools that normalize and cluster the data, and provide a variety of visu-alization options using tables and plots. Similarly, many pathway databases and tools for creating, storing, querying,
and analyzing biological networks exist [1]. But, there are only a few tools that bring both worlds together. One such tool is GenMAPP [2], which provides static pathway dia-grams and the ability to map color-coded expression values on top of entities in the diagram. MAPPFinder is a tool for finding overrepresented gene ontology (GO) terms in a microarray experiment, and for searching GenMAPP path-ways for the ones that have genes related with these over-represented GO terms. However, GenMAPP lacks an inte-grated database, thus it is incapable of producing dynamic pathways related with experiments. Cytoscape [3] has a plu-gin that loads tab-delimited array data, and performs several statistical analyses. These values can be visualized on Cytos-cape pathways via color coding. Reactome [4] database shows an overview map of the reactions in the database, which is laid out according to the module that the reaction belongs to. They support loading of microarray values and show them on an overview graph by color coding, so that users have an idea about the affected module. None of these tools are, however, capable of connecting microarray data with graph– theoretic queries or any other advanced graph analysis operations.
Correspondence: Dr. Ugur Dogrusoz, Center for Bioinformatics, Bilkent University, Ankara 06800, Turkey
E-mail: [email protected] Fax: 1+90-312-266-4047
DOI 10.1002/pmic.200700769
Proteomics 2008, 8, 2196–2198 Systems Biology 2197 We have built a microarray data integration
compo-nent, called PATIKAmad, within PATIKAweb [5], which is a Web interface to the PATIKA database for querying, visu-alizing, and analyzing biological networks. Its ontology supports pathway graphs at two levels: bioentity level and mechanistic level. Bioentity-level graphs contain less detailed information, such as protein–protein interactions or transcriptional regulations between biological entities. Mechanistic-level graphs have state information (e.g., dif-ferent phosphorylated states) and compartment of mole-cules. This level models reactions with its inputs, outputs, and effectors.
About graphs at the bioentity level or other levels of similar detail, there is a small body of literature regarding microarray data integration and coanalysis [6]. The common goal in almost all these works is to detect regions or pathways where significant microarray data is somehow “dense.” This approach makes sense when the mechanism of interactions is not clear in the graph. However, in the case of mechanistic graphs, interesting paths do not necessarily have to be rich in microarray annotation. Many reactions are post-translational events and can be part of a differentially active network without any change of expression in their actors. Expression changes may be linked through paths, whose activity change is independent from expressions. In PATIKAmad, we supply a facility to query for paths between significant nodes (according to users’ significance criteria) in an integrated pathway knowledgebase, in order to compile a “graph of interest.”
PATIKAmad accepts tab-delimited microarray data files containing data values, and external database references. Such files are available from well known public microarray databases such as Gene Expression Omnibus, Stanford Microarray Database, and ArrayExpress. Supported external references are GenBank, Unigene, Entrez Gene, HUGO Gene Symbol, Swiss-Prot, OMIM, Entrez RefSeq Protein ID, and Entrez RefSeq Transcript ID. During the processing of tab-delimited files, rows of the array are matched to the ob-jects in the PATIKA database, and a “.pmad” (PATIKA microarray data format) file is created for later use in
PATI-KAmad. Alternatively, one may load their local model, for instance in BioPAX (http://www.biopax.org) format, con-taining external references. Then, microarray data with compatible external references may be loaded and mapped to this model, facilitating one to work on their proprietary data independent of PATIKA database.
After loading a set of experiments specified in a.pmad” file, the user may set an experiment of interest, or choose to average a group of experiments, or compare log-2 ratios of two groups. These settings are managed using the Data Management dialog. This selection determines the value to be used for each row, directly affecting visualization, and querying events.
Expression values, calculated from current experiments of interest, are visualized on the graph through node color-ing and labelcolor-ing. Visualization options can be modified using the Visual Settings dialog. Besides the default red/ green coloring, the user may customize coloring by assign-ing colors to values. Values in between are shown with colors in between.
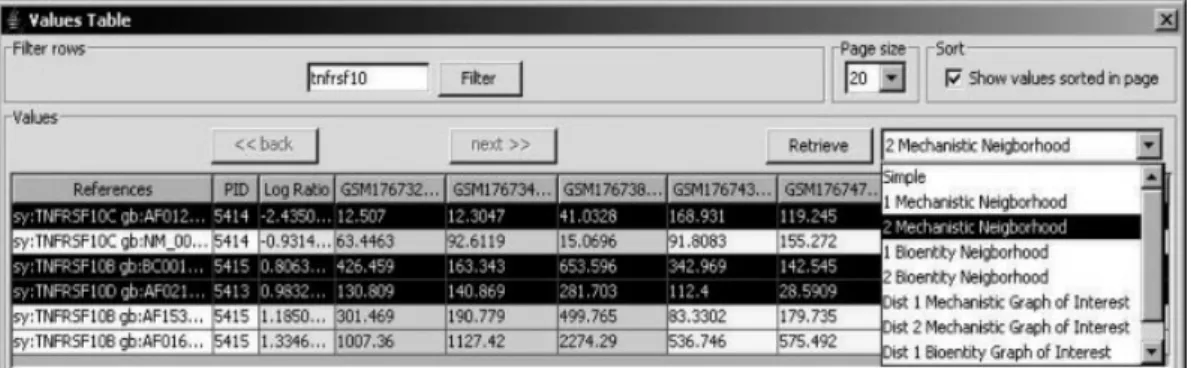
Rows of the loaded experiment may be visualized in the Values Table, which also provides an interface for querying the PATIKA database associated with the selected rows (Fig. 1). The rows displayed may be filtered by keywords, which partially exist in external references. Selected rows may be used for retrieving related PATIKA objects from the database, or for running neighborhood or graph-of-interest queries using related nodes as seed in the database (This query aims at completing “missing links” and molecules on these links, no longer than a specified limit, among a set of molecules of interest). These queries may run on either bioentity or mechanistic levels.
An experiment-scale graph-of-interest query using the Graph of Interest dialog is also supported. This dialog dis-plays the user’s significance criteria for the rows, length of search path, and type of graph, on which to execute the query. This query maps significant rows to significant nodes and searches paths between significant nodes. All paths not longer than the search length are included in the resulting graph of interest.
Figure 1. Part of the Values Table, where experiment rows are filtered with string “tnfrsf10” in ascending order, according to the log-ratio values. Any number of rows may be selected and used for executing neighborhood or graph-of-interest queries.
2198 O. Babur et al. Proteomics 2008, 8, 2196–2198
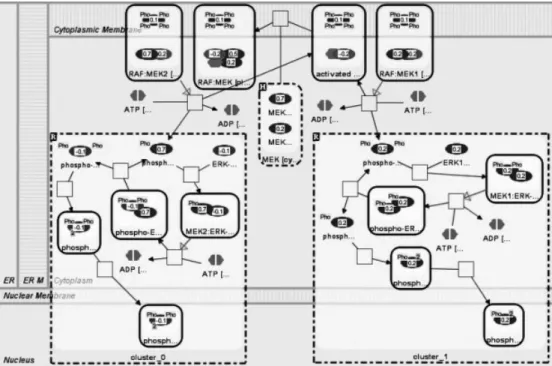
Figure 2. Part of a MAP kinase pathway where two clusters are shown using compound nodes. Loaded microarray values are shown with labels and colors on nodes.
Clustering is one of the most popular microarray data analysis methods. The aim here is to group similarly behaving genes, thus to have an idea about modules and genes whose function is not clear. PATIKAmad supports k-means and hierarchical clustering of the loaded experi-ments. Users have the option for scale normalization, standard normalization, and filtering out a certain percent-age of genes that show low variance. Clustering results can be saved in a “.pcaf” (PATIKA cluster analysis file) file for later use. Clusters in loaded clustering results are visualized on pathways using compound graphs or by highlighting nodes (Fig. 2).
The authors have declared no conflict of interest.
References
[1] Bader, G., Cary, M., Sander, C., Pathguide: A pathway resource list. Nucleic Acids Res. 2006, 34, D504–D506. [2] Salomonis, N., Hanspers, K., Zambon, A. C., Vranizan, K. et
al., GenMAPP 2: New features and resources for pathway
analysis. BMC Bioinformatics 2007, 8, 217.
[3] Shannon, P., Markiel, A., Ozier, O., Baliga, N. et al., Cytoscape: A software environment for integrated models of biomolec-ular interaction networks. Genome Res. 2003, 13, 2498–2504. [4] Joshi-Tope, G., Gillespie, M., Vastrik, I., D’Eustachio, P. et al., Reactome: A knowledgebase of biological pathways. Nucleic
Acids Res. 2005, 33, 428–432.
[5] Dogrusoz, U., Erson, E., Giral, E., Demir, E. et al., PATIKAweb: A Web interface for analyzing biological pathways through advanced querying and visualization. Bioinformatics 2006,
22, 374–375.
[6] Curtis, R., Oresic, M., Vidal-Puig, A., Pathways to the analysis of microarray data. Trends Biotechnol. 2005, 23, 429–435.