294
Geliş tarihi (Received): 10.03.2018 Kabul tarihi (Accepted): 18.12.2018
Araştırma Makalesi/Research Article (Original Paper)
Effect of Selenium Application on Selenium and Macro-Micro
Nutrients Content of Grain Maize in Turkey
Aise DELIBORAN
1*, Yilmaz ISIK
2, Hasan ASLAN
2, Abdullah Suat NACAR
2, Tuba
Yasemin TEKGUL
2, Hatice KARA
2, Mustafa HARMANKAYA
3, Sait GEZGIN
31Directorate of Olive Research Institute, Department of Plant Nutrition and Soil-Water Management, Izmir, Turkey 2Directorate of GAP Agriculture Research Institute, Sanliurfa, Turkey
3Department of Soil Science and Plant Nutrition, Agriculture Faculty, Selcuk University, Konya, Turkey *e-posta:[email protected]; Tel: +90 (232) 4627073; Fax: +90 (232) 4357042
Abstract: Selenium is essential for both humans and animals, and must be taken with nutrients in sufficient
amount. Concentration of selenium in the food for both human and animal is desired between 100-1000 μg kg-1. This study conducted field experiments on the Harran Plateau to investigate; the effect of soil
applications in form of selenite on maize grain yield and Se content; the efficiency of soil application; the relationship between Se content in maize grain and Se application rate; and the effect of Se fertilisers on macronutrients and other micronutrients in grain maize. In this study, DKC 5783 F1 which is grown
intensively in the area as agrain maize variety, sodium selenite was used as selenium source with eight levels (0-5-10-15-25-50-75-100 g Se ha-1). Sodium selenite was applied to the soil in liquid form before
sowing. Sodium selenite application didn’t affect the total Ca, Mg, S, Zn, B, Mo and Se content of grain, but it affected N, P, K, Fe, Cu and Mn content, statistically.
Keywords: Maize, selenium, soil application, sodium selenite,
Türkiye’de Selenyum Uygulamalarının Tane Mısırın Selenyum ve Makro-Mikro Besin
Elementi İçeriğine Etkisi
Özet: Selenyum hem insanlar hem de hayvanlar için zorunlu bir besin maddesidir ve besinlerle yeterli
miktarda alınmalıdır. İnsan ve hayvanlar için besin maddesindeki selenyum konsantrasyonu 100-1000 μg kg-1 arasında değişmektedir. Bu çalışma; Harran Ovası’nda tarla denemesi olarak selenit formunda toprak
uygulamalarının tane mısır verimi ve selenyum içeriği üzerine etkisini; toprak uygulamasının etkinliğini; tane mısırın Se içeriği ile uygulama oranı arasındaki ilişkiyi ve selenyum gübrelemesinin tane mısırda makro besin elementleri ile diğer mikro besin elementleri üzerine etkisini saptamak amacıyla yürütülmüştür. Bu çalışmada mısır çeşidi olarak bölgede yoğun olarak yetiştirilen DKC 5783 F1, selenyum
kaynağı olarak da sodyum selenit sekiz farklı dozda (0-5-10-15-25-50-75-100 g Se ha-1) kullanılmıştır.
Sodyum selenit ekim öncesi toprağa sıvı formda uygulanmıştır. Sodyum selenit uygulamaları istatistiki olarak tanenin toplam Ca, Mg, S, Zn, B, Mo ve Se içeriğini etkilememiştir, ancak N, P, K, Fe, Cu ve Mn içeriğini etkilemiştir.
Introduction
In recent years, the importance of qualified food has been increasing steadily in the human and animal nutrution. In this context, selenium is one of the most studied micronutrients in the World, which is important for human and animal health. Selenium has been known for many years as a highly toxic, even carcinogenic element. It was first shown in 1957 as a useful element for biological systems. Although it is not considered an obligatory nutrient for most plant species, it is important for plants to become involved in the structure of amino acids and proteins after absorption (Erikson 2001).
Selenium is essential for both humans and animals, and must be taken with nutrients in sufficient amount (Cakmak et al. 2009; Surai 2000; David 1995). Habitual suboptimal dietary selenium intake leads to reduced selenium status, which is associated with a range of adverse health outcomes including cardiovascular disorders, impaired immune function, and some forms of cancer (Chilimbia et al. 2012). Food is the principal source of selenium intake. Meat and seefood contain the highest amounts of selenium,
YYÜ TAR BİL DERG (YYU J AGR SCI) 2018, 28(özel sayı):
295
with 0.4-1.5 μg per gram (Rayman 2008), but fruits and vegetables are also good food sources. According to Cakmak et al. (2009), Broadley et al. (2007), Adams et al. (2002), Allaway (1968), concentration of selenium in the food for both human and animal is desired between 100-1000 μg kg-1. Selenium
concentrations in food, including crops, depend not only on selenium concentrations in agricultural soils (which vary considerably between countries and regions) but also on selenium phytoaccessibility controlled by many abiotic and biotic factors such as soil pH, redox conditions, organic matter content, microbial activities, irrigation and compaction. In some countries or regions, low selenium levels in soil lead to low concentrations in food or forage, which in turn can result in selenium deficiency in livestock and humans. The rates of serum selenium in children alter between 50-70 μg L-1 and daily selenium intake alter between
30-40 μg day-1 in Turkey. This value is lower limit for children aged 9-13 and low for children aged 14-18
with regard to required daily value. Daily requirement of selenium is 40 μg for children between 9-13 ages and 55 μg for children between 14-18 ages. It was found that serum selenium levels were very low in the children with goiter and iron deficency anemia. In the same research, it was emphasized that taking higher rate of selenium can protect from several diseases including cancer. It was shown that wheat is the most important source of selenium in food for nutrition of humans (Cakmak et al. 2009). Major purchases of selenium for animals are with alimentation but the chemical selenium taken with the nutrition is thrown out by digestion. Organic selenium is taken with depending on feed, and stored in body proteins (Shamberger 1984). Selenium shows a synergistic effect with vitamin E in animals, it undertakes a powerful antioxidan task with glutathione peroxidase (Lawrence et al. 2003). Both selenium and vitamin-E are antioxidants, preventing oxidative damage in the cell and there is a link among these compounds; one can perform other’s task (Surai 2000; Kaneko 1989).
Major source of selenium is soil in plant-based foods. Plants accumulate selenium in the body for functions but rather accumulate mainly in the seeds (Steven 1994). A lot of research have been done in this regard. For example, content of selenium increases by adding sodium selenite (Na2SeO3)to the freshwater for
germination in chickpea plant (Zang et al. 2011) and by adding to the hydroponic irrigation water in maize plant (Longchamp et al. 2013). Chilimba et al. (2012) expressed that sodium selenate (Na2SeO4), NPK+Se
and CAN+Se increased the content of selenium in grain maize, respectively to 19.7; 20.7 and 14.8 μg selenium kg-1. Curtin et al. (2006) reported that they also obtained similar results in field trials and 0.03 mg
kg-1 selenium concentration in the control sample increasing 0.39 mg kg-1 by the 20 g Se ha-1 soil
application. Chilimbia et al. (2012a) reported that selenium content of grain maize increased to 21 mg kg-1
with each gram of Na2SeO3 application during the sowing time of the maize plant. They also indicate that
selenium content of grain maize is 33% higher in late selenium application than early selenium application. Eurola et al. (2006) reported that soil application increases the contents of selenium in many plants. Selenium application in the soil is widely used in Finland to increase the content of selenium in the major nutrients, thus preventing selenium deficiency of humans. In contrast to humans, the role of selenium for plants is more ambiguous, although studies on young plants have led to a better understanding of selenium pathways in higher plants. Plant development and selenium metabolism are strongly dependent on the form of supplied selenium. The greater mobility of selenate compared to selenite results in differences in the absorption, translocation and metabolism of selenium within the plant. Indeed, when plants are exposed to selenite, selenium accumulation is less than selenate treatment, with a greater reduction in biomass production. After selenate treatment, selenium is almost entirely translocated to the leaves and weakly metabolized as selenoamino-acids, with a selenate concentration in shoots (i.e. stems and leaves) representing more than 90% of the total shoot selenium. In contrast, when supplied as selenite, selenium accumulates principally in roots with little translocation, although selenoamino-acid production (principally selenomethionine, selenocysteine and selenomethylselenocysteine) is greater and the selenium volatilization rate is about 2-fold higher from those plants (Longchamp et al. 2015). According to Deliboran and Nacar (2018), it is seen that the results of the low content of Se in the soil taken from the maize grown fields are overlapped with the findings of the researcher. In this research, Se contents of leaf samples ranged from <10-38.48 μg kg-1 in the Center to 0-27.53 μg kg-1 in Viransehir, depending on the provinces; in
general ranges from 0 to 38.48 μg kg-1. The samples taken from Ceylanpinar, Harran and Akcakale districts
do not contain Se. Se contents are evaluated according to the Ozbek et al. (2001) with the qualification limit values; 100% soils of Akcakale, Ceylanpinar and Harran have a low Se content. In the Central district, 43% is low and 57% is adequate; in Viransehir, 80% is low and 20% is enough class. However, it can be said that leaf samples which appear in the sufficient group are insufficient in terms of Se feeding considering that they are in sufficient group with a very small difference when considering Se content. Considering that the available Se contents of soils are insufficient in all regions, it appears that there is a feeding problem in terms of Se feeding in maize grown areas.
296
This study was planned because of Se feeding problems in Sanlıurfa province. This study conducted field experiments on the Harran Plateau to investigate (1) the effect of soil applications in form of selenite on maize grain yield and Se content; the efficiency of soil application; (2) the relationship between Se content in maize grain and Se application rate; and (3) the effect of Se fertilisers on macronutrients and other micronutrients in grain maize. This study was conducted to determinine the proper Se fertilizer application rate for improving the Se content in maize grain and alleviating Se deficiency in humans and animals.
Material and Method
Experiment locationThe research was carried out in 2013 and 2014 at the selenium deficiency area in Talat Demirören Research Station of GAP Agricultural Research Institute, located in Sanliurfa. Sanliurfa is located in the Southeastern Anatolia climatic region but it is under the influence of the Mediterranean climate. The climate is characterized by warm and dry summers and mild winters. The amount of precipitation increases from south to north and west to east. Monthly average temperatures are around 32 0C in July and Agust. The
highest daily temperatures are observed in the same months, and the highest daily temperature recorded to date was 48 0C in July. The avarage of daily sunbathing time is over 12 hours in summer. Sanliurfa is on
the lowest relative humidity line in Turkey and the relative humidity in summer is around 35%.
The soil in the experiment fields is clay loam. The main characteristics of the soil in each year of experiment are shown in Table 1.
Maize variety and selenium sources
In this study, DKC 5783 F1 which is grown intensively in the area as agrain maize variety, Na2SeO3 were
used as selenium source. Solid Na2SeO3 is a water-soluble compound (85 g/100 g water at 20 °C) and its
molecular weight is 172.9 g. The selenium in Na2SeO3 is in the +4 oxidation state and is found naturally
(Sangbom et al. 2005).
Table 1. Some of the physical and chemical properties of pre-test soil that belongs to the research area
Soil property Year
2013 2014
Texture clay clay
Sand (%) 28.5 27.5 Silt (%) 19.6 19.3 Clay (%) 51.9 53.2 EC ds m-1 0.98 1.06 pH 7.9 7.5 Lime (%) 31.2 29.2 Organic material (% ) 1.57 1.92 Total N ( mg kg-1) 600 700 Available P (mg kg-1) 30.4 16.8 Available K (mg kg-1) 552 604 Available S (mg kg-1) 18.5 16.6 Available B (mg kg-1) 0.32 1.27 Available Mg (mg kg-1) 1678 840 Available Mo (mg kg-1) 34.10 37.84 Available Se (µg kg-1) 3.90 3.50 Experimental design
Experiments were carried out in 3 replicates according to the design of random blocks as the grain maize test in 2013 and 2014. Eight selenium levels (0-5-10-15-25-50-75-100 g Se ha-1) were used in the
experiments. Na2SeO3 was applied to the soil in liquid form before sowing. Sowing operation was done
with pneumatic seeder as 70 cm between rows and 16 cm above the rows on June 24 2013 in the first year of research, and on June 17 2014 in the second year.
297
The amount of fertilizer was determined after the analysis of soil samples taken before the experiment in the field in each two years of the research. The analysis results are given in Table 1. Amount of fertilizer given to maize plants during the vegetation period was completed with pure 25 kg da-1 nitrojen (N) and 10
kg da-1 phosphorous (P), potassium (K) was not applied since the amount of soil available K was sufficient.
All of the P and some of the N were given to soil as a base fertilizer before the final tillage application. The remainder of the nitrogenous fertilizer was supplied as a top fertilizer with maize plants reached 30-40 cm in length.
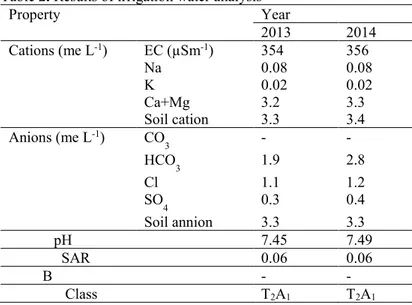
Water was given immediately after sowing. Other irrigation was given equal water to the parcels by flood irrigation procedure. It was set between parcels to prevent surface flow. Anchor and once throat filling were done at appropriate times. Weed medicine were used against weeds after seed emergence, also drug fighting was done aganist harmful stalk and steed. The water sample was taken from the water source in the area where the pre-test experiment was analyzed. The analysis results are given in Table 2.
Table 2. Results of irrigation water analysis
Property Year 2013 2014 Cations (me L-1) EC (µSm-1) 354 356 Na 0.08 0.08 K 0.02 0.02 Ca+Mg 3.2 3.3 Soil cation 3.3 3.4 Anions (me L-1) CO 3 - - HCO3 1.9 2.8 Cl 1.1 1.2 SO4 0.3 0.4 Soil annion 3.3 3.3 pH 7.45 7.49 SAR 0.06 0.06 B - - Class T2A1 T2A1 Sampling
The harvest was made on November 12 2013 in the first year of the research, and on November 6 2014 in the second year. Maize grain at harvest were measured by harvesting the entire plot through weighing the total straw and maize grain with the cob. After harvest, maize plants with cob were sampled, maize grains were threshed from the cob, and subsamples of mazie grain were washed twice with de-ionised water to remove the attached soil and other contaminants. Samples were then oven-dried at 60 0C to contant weight.
The dried samples were ground into powder to pass through a sieve of 0.15 mm for nutrient analysis.
Chemical analysis
In soil samples, texture was determined by hydrometer method (Bouyoucos 1951); pH in 1:2,5 soil: water mixture, electrical conductivity (EC) with electirical conductivity instrument in the saturated soil paste, lime (CaCO3) with Scheibler calcimetry (Tuzuner 1990); organic matter by modified Walkley-Black
method (Black 1965); total N by modified Kjeldahl method; changeable K, calcium (Ca), magnesium (Mg) and sodium (Na) by 1 N ammonium acetate (pH=7) extraction (Kacar 1995); available P by NaHCO3
extraction (Olsen and Sommers 1982); available iron (Fe), zinc (Zn), manganase (Mn) and copper (Cu) by di ethylene tri amine penta acetic acid-tri ethanol amine (DTPA-TEA) excraction (Lindsay and Norvell 1978); available boron (B) was determinated by exacting B from the soil with hot water based on the color intensity of azomethine-H complex (Kacar 1995), available Se was determined by KH2PO4 extraction
method by reading the Atomic Absorption Spectrophotometer (ASS) connected to ETC-60 (Electrohermal Temperature Controller) and VGA-77 (Vapor Generator Aparatus) apparatus ontained (Cakmak et al. 2009).
298
In dried and ground grain samples; N analysis was determined by modified Kjeldahl method; total P with nitric acid (HNO3)+perchloric acid (HClO4) mixture by vanadomolibdophosphoric yellow color method in
wetted burnt plants samples; total K, Ca, B, S, Mg, Fe, Cu, Zn and Mn contents were determined by ICP with the same solution (Kacar 1995). Grain samples were dried to a constant weight at 40 ºC in an air circulating dryer cabinet for selenium analysis. The dried and ground grain samples were prepared for
selenium determination by wet digestion in microwave oven with 5 ml concentrared HNO3 and 2 ml 30%
hydrogen peroxide (H2O2)by using a digesting program, which have been developed for the grain samples.
All selenium measurements in grain meterials were checked against certificated selenium values in different reference plant material (1547 Peach Leaves, NIST) obtained from the National Institute of Standarts and Technology (Gaithersburg USA). After digestion, the total volume was completed up to 20 ml, and Se concentration of the samples were measured by Atomic Absorption Spectroscopy (Varian) equipped with VGA 77 (vapor generation accessories) and ETC-60 (electrothermal temperature controller). First, Se (+ VI) in the samples was reduced to Se (+ IV) form by treatment with hydrochloric acid. After, Se was reacted with sodium tetraborate (NaBH4) reductive in acidic medium and reduced to form volatile hydrogen
selenide (SeH2) in the hydride forming unit which a hydride generator module (VGA-77) mounted in front
of the sample entry system of the AAS device, and measured by atomizing SeH2 at high temperature
(850-950 ºC) with ETC-60 instrument. The accuracy and reproducibility of the analysis values were controlled using standard reference materials in every 10 samples in the analyzes (Cakmak et al. 2009).
Statistical analyses
All data were anlysed using MSTAT-C software package. The data obtained from the experiments were evaluated with variance analysis every year, homogeneity tests were made and the differences between experiment subjects were cheched with LSD tests. The levels of significant was 0.05.
Results and discussion
In this study, the effects of Na2SeO3 on the grain yield and biomass, accumulation of selenium and other
nutrients in grain maize have been investigated and the average values of 2013-2014 has been evaluated.
Grain yield and biomass of maize
There was no statistical difference between application doses, when the grain yield and biomass was examined with the Na2SeO3 applications. Grain yield and biomass ranged from 9.10-9.52 t ha-1 and
78.7-83.4 t ha-1 at different selenium doses, respectively, the highest values was obtained from 0 g Se ha-1
application in both (Table 3). This result is consistent with that selenium application didn’t affect the plant yield and the other plant properties for example wheat (Cakmak et al. (2009); Broadley et al. (2007); Deliboran et al. (2018)), maize (Chilimbia et al. (2012); Longchamp et al. (2013)) and lettuce (Duma et al. 2011). For example, several studies showed that with selenium application, grain yield of maize ranged from 2764-7009 kg ha-1 (Chilimbia et al. 2012); grain yield of maize ranged from 5.41-9.13 t ha-1 in 2009,
7.93-12.25 t ha-1 in 2010 with soil application of Na2SeO3, 6.15-9.91 t ha-1 in 2009, 9.58-17.05 t ha-1 in
2010 with foliar application of Na2SeO3 (Wang et al. 2013). Howewer, several studies showed that selenium
application posivitely affects the plant due to antioxidative activity of patato plants (Turakainen 2007) and maize plant (Sajedi et al. 2011); respiratory potential of young chicory (Germ et al. 2007) and brassica plants (Cakmak et al. (2009); Lyons et al. (2009)).
Selenium content in maize grain
There was no statistical difference between application doses, when the selenium content of the grain was examined with the Na2SeO3 applications. Total selenium levels of grain ranged from 19-22 µg kg-1 at
different selenium doses, the highest value was obtained from 15-25-50-75-100 g Se ha-1 application (Table
4). When the selenium rate was increased from 0 to 100 g Se ha-1, the grain selenium content increased by
1.16-fold (from 19 µg kg-1 to 22 µg kg-1) and the selenium accumulation by 1.13 fold (from 181 mg ha-1 to
205 mg ha-1) but both of them showed no significant change across the selenium rates. The selenium
299
Table 3. Effect of different levels of sodium selenite application on maize grain yield and biomass
Se rates (g Se ha-1) 2013 2014 Avarage 2013-2014 Grain Yield (t ha-1) Biomass (t ha-1) Grain Yield (t ha-1) Biomass (t ha-1) Grain Yield (t ha-1) Biomass (t ha-1) 0 7.51a 68.3 11.52 98.4 9.52 83.4 5 7.59 62.6 10.85 95.6 9.22 79.1 10 7.69 67.2 10.55 94.2 9.12 80.7 15 7.20 63.9 9.93 93.6 8.57 78.8 25 7.50 65.3 10.85 97.4 9.18 81.4 50 7.43 62.5 10.92 98.7 9.17 80.6 75 6.90 65.2 11.30 94.6 9.10 79.9 100 7.34 61.1 11.40 96.2 9.37 78.7
(Values in the same column followed by the same small letter are not significantly different at P=0.05.) Table 4. Effect of different levels of sodium selenite application rates on Se content in maize grain and Se uptake and recovery by the grain.
Se rates (g Se ha-1)
Grain Se content
(µg kg-1) Grain Se uptake (mg ha-1) Grain Se recovery (%)
2013 2014 Average 2013-2014 2013 2014 Average 2013-2014 2013 2014 Average 2013-2014 0 20 18 19 150 209 181 5 21 21 21 159 228 193 1.87 3.77 2.45 10 21 21 21 165 226 195 1.47 1.71 1.41 15 22 22 22 155 214 184 0.33 0.34 0.22 25 21 22 22 161 244 202 0.45 1.41 0.82 50 22 22 22 161 236 198 0.22 0.55 0.35 75 22 21 22 150 243 196 0.00 0.45 0.20 100 22 22 22 161 248 205 0.11 0.39 0.24
(Grain Se accumulation (mg ha-1) = grain Se concentration (µg kg-1) x grain yield (g ha-1). Grain Se recovery
(%) = ((Grain Se uptake in the treatment (mg ha-1) - (grain Se uptake in the control (mg ha-1)) / rate of
applied Se (g ha-1) x 1000. Values in the same column followed by the same small letter are not significantly
different at P=0.05.)
According to Allaway (1968), Adams et al. (2002) and Broadley et al. (2007), it is desirable that the concentration of selenium in consumed foods is between 100-1000 μg kg-1 for adequate nutrition of both
humans and animals. Miller et al. (1991) indicate that selenium levels should be at least 0.1-0.3 mg kg-1 for
animal nutrition, 0.1-1 mg kg-1 selenium level is sufficient and >5 mg kg-1 is toxic effect. In our study,
selenium levels of grain were increased with Na2SeO3 application from the control group, selenium
accumulation was not sufficient in term of human and animal nutrition, it is thought that selenium may be absorbed from soil deu to the fact that soils of research is heavy. In addition, when compared to Wang et al. (2013), it is considered that the levels applied doses in our study are low to increase selenium content of grain for human and animal nutrition. According to Wang et al. (2013), selenium content of grain was increased from 3.7 μg kg-1 to 206 μg kg-1 at applications of Na2SeO3 from soil between 0 g Se ha-1 ile 600
g Se ha-1 doses. In term of increased selenium levels in Na2SeO3 applications, in our study the results
obtained are in harmony with the researchers (Wang et al. 2013; Chilimbia et al. 2012; Chilimbia et al. 2012a; Zang et al. 2011; Curtin et al. 2006; Eurola et al. 2006). Otherwise, it is known that many factors increase Se activity in plants. For example crop spicies and variety in chickpea (Zang et al. 2011) and maize (Longchamp et al. 2013); application time and rate (Curtin et al. 2006; Chilimbia et al. 2012a; Wang et al. 2013); soil and climatic conditions (Cakmak et al. 2009; Kacar and Katkat, 1989; Zhao et al. 2007); selenium applications and selenium form (Wang et al. 2013; Chilimbia et al. 2012; Cartes et al. 2005). It is known that foliar selenium application caused than soil selenium application for increasing selenium content of maize grain. At the competence level with Na2SeO3 application to the soil, the selenium content
300
were higher than in the control group by Na2SeO3 application but the Se accumulation was not sufficient
in term of human and animal nutrition.
Macromineral content in maize grain
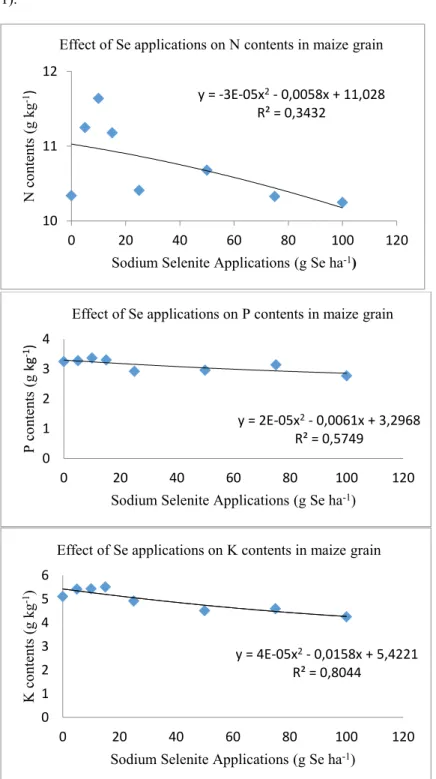
There was statistical difference between application doses, when the N, K and P content of the grain were examined with the Na2SeO3 applications, when years were evaluated collectively. At different Na2SeO3
doses, the total N values were varied between 10.25-11.64 g kg-1, total K values between 4.25-5.51 g kg-1
and total P values between 2.92-3.37 g kg-1, respectively. Se applications affected the values of N, K and P
on grain. The highest values were obtained with 11.64 g N kg-1 from 10 g Se ha-1 application, with 5.51 g
K kg-1 from 15 g Se ha-1 application and with 3.37 g P kg-1 from 10 g Se ha-1 application (Table 5, Figure
1).
Figure 1. N, P and K content of maize grain with sodium selenite (Na2SeO3) application
y = -3E-05x2- 0,0058x + 11,028 R² = 0,3432 10 11 12 0 20 40 60 80 100 120 N co nten ts (g k g -1)
Sodium Selenite Applications (g Se ha-1) Effect of Se applications on N contents in maize grain
y = 2E-05x2- 0,0061x + 3,2968 R² = 0,5749 0 1 2 3 4 0 20 40 60 80 100 120 P co nten ts (g kg -1)
Sodium Selenite Applications (g Se ha-1) Effect of Se applications on P contents in maize grain
y = 4E-05x2- 0,0158x + 5,4221 R² = 0,8044 0 1 2 3 4 5 6 0 20 40 60 80 100 120 K co nten ts (g k g -1)
Sodium Selenite Applications (g Se ha-1) Effect of Se applications on K contents in maize grain
301
There was not statistical difference between applications doses, when the Ca, Mg and S content of the grain were examined with Na2SeO3 applications when years were evaluated collectively. At different Na2SeO3
doses, the total Ca values were varied between 0.076-0.090 g kg-1, total Mg values between 1.65-1.85 g kg -1 and total S values between 1.06-1.18 g kg-1, respectively. Selenium applications did not affect as statistical
the values of Ca, Mg and S in grain on Na2SeO3 applications (Tables 5). Howewer, when compered to the
control group, the S content of the grain were decreased at increasing selenium levels. Wang et al. (2013) indicated that N, P, K, Ca and Mg content of grain can not be affected from soil and foliar application when compared with control groups. In term of N, K, P, Ca and Mg content of grain, our studies results obtained are in harmony with the researchers. In term of interaction between Se and N, K, P, the results obtained are in concordance with researchers for N, partly compatible for K and contradictory for P. The results obtained from our researchare in contradiction for Ca and Mg. Hawrylak-Nowak (2008) found that Se application of 5, 25, 50, 100 μmol.dm-3 Na2SeO3.5H2O to maize plant in the hydroponic system increased
the P content of the root and shoot of plant, espicially with 5 and 25 μmol.dm-3 doses, but the differences
were not statistically significant, P content increased by 4-5 fold over the control group in 50 and 100 μmol.dm-3 Se applications. According to Huang et al. (2008); Cruz-Jimenez et al. (2005); White et al.
(2004); Pezzarossa et al. (1999); Mikkelsen and Wan (1990), Barak and Goldman (1997) and Gissel-Nielsen (1973) there is significant interaction between S and Se. Our studies results obtained from Na2SeO3
are in concordance for S with researchers.
Micromineral content in maize grain
Statistical difference between selenium doses in Na2SeO3 application for Fe, Cu and Mn was found, when
the Fe Cu, Zn, Mn, B and Mo content of grain were examined. Total Fe values of grain were changed between 27.10-38.59 mg kg-1, total Cu values 4.89-7.14 mg kg-1, total Mn values 2.63-5.20 mg kg-1, total
Zn 22.64-26.47 mg kg-1, total B 27.14-34.45 mg kg-1 and total Mo 4.28-4.45 mg kg-1 with different Na2SeO3
doses. Selenium applications statistically affect the Fe, Cu and Mn values of grain maize, Fe, Cu and Mn content of grain were increased at the increasing selenium levels, the highest values were obtained with 38.59 mg Fe kg-1 from 10 g Se ha-1 application, with 7.14 mg Cu kg-1 from 15 g Se ha-1 application and with
5.20 mg Mn kg-1 from 10 g Se ha-1 (Table 6, Figure 2). Selenium applications did not affect Zn, B and Mo
values of grain statistically. Krystyna et al. (2008) reported that applying 10-6 mol dm-3 sodium hydrogen
selenite (NaHSeO3), 10-4 mol dm-3 indole-3-acetic acid and IAA-NaHSeO3 together (IAA) to maize plant
in the hydroponic systems were effective on the root and leaf in term of Fe, Mg, Cu, Mn and Zn content. In addition, the researchers reported that interactions between these elements with selenium was found, the levels of these elements in the plant were increased and the accumulation organ changed according to the plant species. Wang et al. (2013) reported that soil and foliar applications of selenium did not affect Fe, Mn, Cu and Zn content of grain. In our study, the results obtained from selenite applications are consistent with Krystyna et al. (2008) in terms of the interaction between Se and Fe, Cu, Mn and their content.
302
Figure 2. Fe, Cu and Mn contents of maize grain with sodium selenite (Na2SeO3) application
y = 0,0003x2- 0,0992x + 33,363 R² = 0,307 0 10 20 30 40 50 0 20 40 60 80 100 120 Fe co nten ts (g k g -1)
Sodium Selenite Applications (g Se ha-1) Effect of Se applications on Fe contents in maize grain
y = 8E-05x2- 0,0226x + 6,4129 R² = 0,5062 0 2 4 6 8 0 20 40 60 80 100 120 Cu co nten ts (g k g -1)
Sodium Selenite Applications (g Se ha-1) Effect of Se applications on Cu contents in maize grain
y = -6E-05x2- 0,0184x + 5,1106 R² = 0,902 0 2 4 6 0 20 40 60 80 100 120 Mn co nten ts (g k g -1)
Sodium Selenite Applications (g Se ha-1) Effect of Se applications on Mn contents in maize grain
303
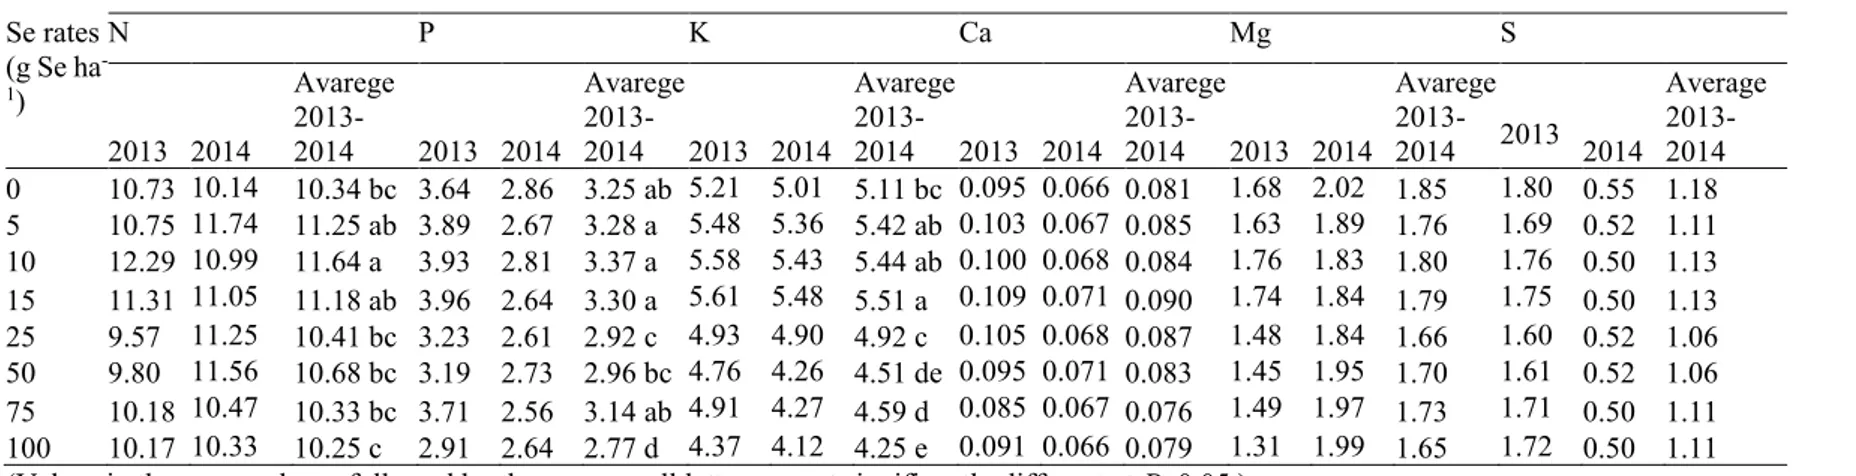
Table 5. Effect of Se applications on N, P, K, Ca, Mg and S contents in maize grain. Se rates (g Se ha -1) Nutrient contents (g kg-1) N P K Ca Mg S 2013 2014 Avarege 2013-2014 2013 2014 Avarege 2013-2014 2013 2013-2014 Avarege 2013-2014 2013 2014 Avarege 2013-2014 2013 2014 Avarege 2013-2014 2013 2014 Average 2013-2014 0 10.73 10.14 10.34 bc 3.64 2.86 3.25 ab 5.21 5.01 5.11 bc 0.095 0.066 0.081 1.68 2.02 1.85 1.80 0.55 1.18 5 10.75 11.74 11.25 ab 3.89 2.67 3.28 a 5.48 5.36 5.42 ab 0.103 0.067 0.085 1.63 1.89 1.76 1.69 0.52 1.11 10 12.29 10.99 11.64 a 3.93 2.81 3.37 a 5.58 5.43 5.44 ab 0.100 0.068 0.084 1.76 1.83 1.80 1.76 0.50 1.13 15 11.31 11.05 11.18 ab 3.96 2.64 3.30 a 5.61 5.48 5.51 a 0.109 0.071 0.090 1.74 1.84 1.79 1.75 0.50 1.13 25 9.57 11.25 10.41 bc 3.23 2.61 2.92 c 4.93 4.90 4.92 c 0.105 0.068 0.087 1.48 1.84 1.66 1.60 0.52 1.06 50 9.80 11.56 10.68 bc 3.19 2.73 2.96 bc 4.76 4.26 4.51 de 0.095 0.071 0.083 1.45 1.95 1.70 1.61 0.52 1.06 75 10.18 10.47 10.33 bc 3.71 2.56 3.14 ab 4.91 4.27 4.59 d 0.085 0.067 0.076 1.49 1.97 1.73 1.71 0.50 1.11 100 10.17 10.33 10.25 c 2.91 2.64 2.77 d 4.37 4.12 4.25 e 0.091 0.066 0.079 1.31 1.99 1.65 1.72 0.50 1.11
(Values in the same column followed by the same small letter are not significantly different at P=0.05.) Table 6. Effect of Se applications on Fe, Cu, Mn, Zn, B and Mo contents in maize grain.
Se rates (g Se ha -1) Nutrient contents (mg kg-1) Fe Cu Mn Zn B Mo 2013 2014 Avarege 2013-2014 2013 2014 Avarege 2013-2014 2013 2014 Avarege 2013-2014 2013 2014 Avarege 2013-2014 2013 2014 Avarege 2013-2014 2013 2014 Avarege 2013-2014 0 37.08 21.13 29.10 c 5.53 5.79 5.66 bcd 5.10 4.50 4.80 ab 22.37 25.46 23.92 13.62 40.66 27.14 6.38 2.52 4.45 5 40.02 21.32 30.67 bc 5.53 7.06 6.29 ab 5.30 4.77 5.04 a 23.91 26.09 25.00 13.86 43.38 28.62 6.34 2.48 4.41 10 54.74 22.43 38.59 a 5.64 6.83 6.23 ab 5.48 4.93 5.20 a 25.12 27.81 26.47 14.20 40.17 27.19 6.33 2.46 4.40 15 48.16 25.49 36.82 ab 5.92 8.38 7.14 a 5.71 4.63 5.17 a 24.66 27.86 26.26 14.00 43.24 28.62 6.35 2.45 4.40 25 34.78 21.05 27.91 c 5.60 6.64 6.11 abc 3.21 5.61 4.41 ab 20.82 27.09 23.96 13.86 49.41 31.64 6.34 2.45 4.39 50 34.83 19.56 27.19 c 5.38 4.55 4.97 de 3.62 3.75 3.69 bc 20.75 26.48 23.62 13.58 50.83 32.21 6.32 2.38 4.35 75 35.68 20.03 27.85 c 5.38 4.40 4.89 e 4.28 3.19 3.73 bc 20.38 26.40 23.39 13.20 55.69 34.45 6.23 2.41 4.32 100 33.78 20.43 27.10 c 5.17 5.18 5.17 cde 3.19 2.07 2.63 c 18.87 26.41 22.64 13.55 48.18 30.87 6.23 2.34 4.28
304
When the effect of Na2SeO3 application to the soil in the grain maize investigated, it was seen that Na2SeO3
application did not affect the total Zn and Se content of grain, but it affected N, P, K, Fe, Cu and Mn content of grain statistically; N, P, K, Fe, Cu and Mn content of grain increased with selenium applications. It has been found that there was an interaction between the selenium applications and it is in accordance with the literature (Wang et al. 2013; Hawrylak-Nowak 2008; Krystyna et al. 2008). At the competence level with Na2SeO3
application to the soil, the selenium content of grain did not increase and this is the most important finding in this study as a results. According to Adams et al. (2002) and Allaway (1968) it is desirable that the concentration of selenium is between 100-1000 μg kg-1 in consumed foods. Miller et al. (1991) indicate that at least 0.1-0.3 mg
kg-1 selenium must be present in feeds for animal nutrition and 0.1-0.3 mg kg-1 selenium is adequate and >5 mg
kg-1 selenium is toxic. It was seen that selenium values of grain are not compatible when compared to the
researchers’ findings and the selenium values of grain are lower than the values required for human and animal nutrition. In this study selenium levels were higher than in the control group by Na2SeO3 application but the
selenium accumulation was not sufficient in term of human and animal nutrition. It is thought that selenium clinges to soil due to the fact that soil of the research region is heavy, and also compared to Wang et al. (2013), the levels of selenium applied in our study are thought to be low to increase the selenium content of grain. According to Wang et al. (2013), with the application of Na2SeO3 to soil, the selenium content of grain maize
was increased from 3.7 μg kg-1 to 206 μg kg-1 at doses between 0 g Se ha-1 and 600 g Se ha-1.
It is clear that Na2SeO3 application is not more effective on the selenium contents of grain maize in this study
which was carried out to determine the effect of Na2SeO3 applied to the soil. It is more effective on the N, P, K,
Fe, Cu and Mn contents of grain maize.
References
Adams ML, Lonbi E, Zhao FJ, McGrath SP (2002). Evidence of low selenium concentrations in UK bread-making wheat grain. Journal of the Science of Food and Agriculture 82: 1160-1165.
Allaway WH (1968). Controls on the environmental levels of selenium. Trace Substances in Environmental Health 2: 181-206.
Barak P, Goldman L (1997). Antagonistic relationship between selenate and sulfate uptake in onion (Allium cepa L.) implications fort he production of organosulfur and organoselenium compounds in plants. Journal of Agricultural and Food Chemistry 45: 1290-1294.
Black CA (1965). Methods of Soil Analiysis, pp. 1372-1376, Part 2. American Society of Agronomy Inc., Publisher Madison, Wilconsin, USA.
Bouyoucos GJ (1951). Arecelibration of the Hydrometer for Marking Mechanical Analysis of Soil. Argonomy Journal 43: 433-437.
Broadley MR, White PJ, Bryson RJ, Meacham MC, Bowen HC, Johnson SE, Hawkesford M J, McGrath SP, Zhao FJ, Breward N, Harriman M, Tucker M (2007). Biofortification of UK food crops with selenium. Proceedings of the Nutrition Society 65: 169-181.
Cakmak I, Ozturk L, Basaga H, Cekic C, Taner S, Irmak S, Geren H, Kilic H, Aydın N, Avcı M, Gezgin S (2009). Investigation of selenium concentration of wheat and soil in selected regions in Turkey, reaction of wheat to selenium fertilization and physiological characterization of rich genotypes in selenium. TUBITAK Final Report Project No: 105 0 637, Turkey.
Cartes P, Gianfreda L, Mora ML (2005). Uptake of selenium and its antioxidant activity in ryegrass when applied as selenite and selenite forms. Plant Soil 276: 359-367.
Chilimba ADC, Young SD, Black CR, Meacham MC, Lammel J, Broadley MR (2012). Agronomic biofortification of maize with selenium (Se) in Malawi. Field Crop Research 125: 118-128.
Chilimba ADC, Young SD, Black CR, Meacham MC, Lammel J, Broadley MR (2012a). Agronomic biofortification of maize with selenium (Se) in Malawi. Field Crop 125: 118–128.
Curtin D, Hanson R, Lindley TN, Butler RC (2006). Selenium concentration in wheat (Triticum aestivum) grain as influenced by method, rate, and timing of sodium elenate application. New Zealand Journal of Crop and Horticultural Science 34 (4): 329-339.
Cruz-Jimenez, G., Peralta-Videa, j.R., De la Rosa, G., Meitzner, G., Parsons, J.G., Gardea-Toresde, JL (2005). Effect of sulfate on selenium uptake and chemical speciation in Convolvulus arvensis L. Environmental Chemistry 2(2):100-107.
305
Deliboran A, Nacar, AS (2018). Evaluation of Nutritional Status In Term of Selenium and The Other Nutrients of Maize Cultivation Lands In Sanliurfa Province. International Agricultural Science Congress 09-12 May 2018, Van, Turkey.
Deliboran A, Isık Y, Aslan H, Nacar AS, Tekgül TY, Kara H, Harmankaya M, Gezgin S (2018). The effect of selenium application on yield parameters, selenium, protein and oil contents of grain maize. Soil Science Society of Turkey 6(1): 1-11.
Duma M, Alsina I, Dubova L, Stroksa L, Smiltina Z (2011). The effect of sodium selenite and selenite on the quality of lettuce. In: Conference proceedings of the 6th Baltic Conference on Food Science and
Technology Foodbalt, Jelgava, Latvia.
Eriksson J (2001). Concentrations of 61 trace elements in sewage sludge, farmyard manure, mineral fertilizer, recipitation and in oil and crops. Report 5159, The Swedish Environmental Protection Agency. Eurola MH, Ekholm PI, Ylinen ME, Varo PT, Koivistoinen PE (2006). Selenium in finnish foods after beginning
the use of selenate-supplemented fertilisers. Journal of the Science of Food Agriculture 56: 57–70. Germ M, Stibilj V, Osvald J, Kreft I (2007). Effect of selenium foliar application on chicory (Cichorium intybus
L.). Journal of Agricultural and Food Chemistry 55: 795-798.
Gissel-Nielsen G (1973). Uptake and distribution of added selenite and selenate by barley and red clover as influenced by sulfur. Journal of the Science of Food and Agriculture 24: 649-655.
Hawrylak-Nowak B (2008). Effect of selenium on selected macronutrients in maize plants. Journal of Elementology 13 (4): 513-519.
Huang YZ, Hu Y, Liu YX (2008). Interactions between sulfur and selenium uptake by corn in solution culture. Journal of Plant Nutrition 31: 43-54.
Kacar B, Katkat V (1998). Plant Nutrition. Uludag University Foundation for Empowerment No: 127, VIPAS Publication: 3, ISBN 975-564-068-1.
Kacar B (1997). Plant and Soil Chemical Analysis, III. Soil Analysis. University Faculty of Agriculture, Educational Research and Development Foundation Publication No: 3, Ankara.
Kaneko JJ (1989). Clinical Biochemistry of Domestic Animals. pp. 772-776, Academic Pres, Inc., San Diego. Krystyna P, Andrzej K, Mariusz P (2008). Effect of selenium on magnesium, iron, manganase, copper and zinc
accumulation in corn treated by ındole-3-acetic acid. Communications in Soil Science and Plant Analysis 39: 2303-2318.
Lawrence AK, Amadeo JP, Steven CK (2003). Clinical Chemistry, 4th Edition, 714.
Lindsay WL, Norwell WA (1978). Development of DTPA soil test for zinc, iron, manganase and cooper. Soil Science Society of America Journal 42: 422-428.
Longchamp M, Angeli N, Castrec-Rouelle M (2013). Selenium uptake in Zea mays supplied with selenate or selenite under hydroponic conditions. Plant and Soil 362 (1-2): 107–117.
Longchamp M, Castrec-Rouella M, Biron P, Bariac T (2015). Variations in the accumulation,
localization and rate of metabolization of selenium in mature Zea mays 2 plants supplied with selenite or selenite. Food Chemistry 182: 128-135.
Lyons GH, Genc Y, Soole K, Stangoulis J, Liu F, Graham RD (2009). Selenium increases seed production in
Brassica. Plant Soil 318: 73-80.
Mikkelsen RL, Wan HF (1990). The effect of selenium on sulfur uptake by barley and rice. Plant and Soil 121:151-153.
Miller E, Lei RX, Ullrey DE (1991). Trace elements in animal nutrition, pp. 593-662, In: Micronutrients in Agriculture, 2 Ed, (J, Mortvedt, F, R, Cox, L, M, Shuman and R, M, Welch, Eds.). SSSA Book Series No: 4, Madison, WL, USA.
Olsen SR, Sommers EL (1982). Phosphorus soluble in sodium bicarbonate, methods of soil analysis, pp. 404-430, part 2, chemical and microbiolojical properties, Edit: A, 1. page, RH, Miller, DR, Keeney. Ozbek H, Kaya Z, Gok M, Kaptan H (2001). Soil Science. Cukurova University Agriculture Faculty Publishs,
Publish No:73, Adana, s. 508.
Pezzarossa B, Piccotino C, Shennan C, Malorgio F (1999). Uptake and distribution of selenium in tomato plants as affected by genotype and sulfate supply. Journal of Plant Nutrition 22 (10):1613-1635.
Rayman MP (2008). Food-chain selenium and human health: emphasis on intake. British Journal of Nutrition 100: 254-268.
Sajedi N, Ardakani M, Madani H, Naderi A, Miransari M (2011). The effects of selenium and other
micronutrients on the antioxidant activities and yield of corn (Zea mays L.) under drought stress. Physiology and Molecular Biology of Plants 17: 215-222.
Sangbom ML, Laurence IH, Michael R, Ross MW, Leon VK, Li L (2005). Molecular and Biochemical Characterization of the Selenocysteine Se-Methyltransferase Gene and Se-Methylselenocysteine Synthesis in Broccoli. Plant Physiol 138 (1): 409-420.
Shamberger RJ (1984). Selenium. pp. 201-237, In; Friend, E, Editor, Biochemistry of the essential ultratrace elements. Plenum Press, NewYork.
306
15th Annual Biotechnolgy in the Feed Industry Symposium. pp: 205-242.
McCarty Steven L (1994). Design and Application of Dynamic Headspace Sampling System For The Study of Bioremediation of Toxic Metalloids by Bacteria. Master thesis (Science of Chemistry), 34 p, Sam Houston State University, Huntsville, Texas.
Turakainen M (2007). Selenium and its effects on growth, yield and tuber quality in patato. Doctoral thesis, Univercity of Helsinki, Finland.
Tuzuner A (1990). Soil and Water Analysis Handbook, 16 p, Ministry of Agriculture, Forestry and Rural Affairs General Directorate of Rural Services, Ankara.
Wang J, Wang Z, Mao H, Zhao H, Huang D (2013). Increasing Se concentration in maize grain with soil-or foliar-applied selenate on the Loess Plateau in Chine. Field Crops Research 150: 83-90.
White PJ, Bowen HC, Parmaguru P, Fritz M, Spracklen WP, Spidy RE, Meachamn MC,
Mead A, Harriman M, Trueman LJ, Smith BM, Thomas B, Broadley MR (2004). Interactions between selenium and sulphur nutrition in Astragalus thaliana. Journal of Experimental Botany 55: 1927-1937.
Zang L, Li Q, Yang X, Xia Z (2011). Effects of sodium selenite and germination on the sprouting of chicpeas (Cicer arientum L.) and its content of selenium, formononetin and Biochanin A in the sprouts, Biological Trace Element Research 146: 376-380.
Zhao FJ, Lopez-Bellido FJ, Gray CW, Whalley WR, Clark LJ, McGrath SP (2007). Effects of soil compaction and irrigation on the concentrations of selenium and arsenic in wheat grains. Science of the Total Environment 372: 433-439.