T.C.
ISTANBUL BILGI UNIVERSITY
INSTITUTE OF SOCIAL SCIENCE
FINANCIAL ECONOMICS
COMPARISON BETWEEN PARTICIPATION BANKS AND
CONVENTIONAL BANKS EVIDENCE FROM TURKEY
MASTER THESIS
Halim Düzenli
113620001
ADVISOR: Asst. Prof. Dr. Serda Selin Öztürk
I
Abstract
Bank comparison with financial ratios method, that is globally used several academic studies. In this study, to measure financial performance of conventional deposit bank and participation bank, profitability ratio, liquidity ratio and risk ratios are used for Turkey. According to means, results show that participation banks perform better in profitability, while conventional banks perform better in risk ratios. In liquidity ratios, we cannot say a group is better, according to results, in Liquid assets ratio conventional banks have better result however, in acid test ratio, participation banks are better. In t-test of the return on asset and acid test ratio, there are no major difference between Islamic banks and non-Islamic banks. In the other six ratios, years show different results in years.
II
Özet
Finansal rasyolarla bankaların karşılaştırılması, dünyada bir kaç akademik çalışmada kullanılmıştır. Bu çalışmada, Katılım Bankaları’nın ve Klasik Mevduat Bankaları’nın finansal performans karşılaştırılması için, karlılık, likidite ve risk rasyoları kullanılmıştır. Elde ettiğimiz sonuçlar, rasyoların ortalaması göstermektedir ki Likiditede, Klasik Bankalar ile katılım Bankaları arasında açık bir fark bulunduğunu söyleyemiyoruz. Ancak Risk rasyoları göstermektedir ki Klasik Bankaların finansal yapısı daha sağlamdır. Karlılık rasyoların da ise Katılım Bankaları ise elinde bulundurduğu varlıkları daha verimli kullandığı gözükmektedir. T-test sonuçları ise sadece iki rasyoda anlamlı derecede fark olmadığını göstermektedir. Altı rasyoda ise yıllara göre sonuçlar farklılık göstermektedir.
III ACKNOWLEDGEMENTS
I would like to thank my advisor Serda Selin Öztürk. I am thankful for having the chance of working with her.
IV TABLE OF CONTENTS
I. INTRODUCTION 1
II. BANKING SECTOR OF TURKEY 1
2.1. An Overview Banking Sector in Turkey 2
2.2. Participation Banking 3
2.3. Place of Interest in Islam 4
2.4. Methods of Islamic Finance 5
2.4.1. Murabaha 5 2.4.2. Salam 6 2.4.3. Istisna 6 2.4.4. Mudaraba 6 2.4.5. Musharaka 7 2.4.6. Ijarah 7 2.4.7. Wakala 8 III. LITERATURE 8 IV. DATA 10 V. METHODOLOGY 10
VI. EMPIRICAL RESULTS 12
4.1. Comparison of Financial Ratio 12
4.1.1. Profitability Ratio 12
4.1.1.1. Return on Assets 12
4.1.1.2. Return on Equity 13
4.1.1.3. Profit Before Tax to Total Asset 13
4.1.2. Liquidity Ratio 14
4.1.2.1. Liquid Assets Ratio 14
4.1.2.2. Acid Test Ratio 14
4.1.3. Risk Ratios 15
V
4.1.3.2 Equity to Loans Ratio 16
4.1.3.3 Capital Adequacy 17
4.2. Result of Hypothesis Test 18
VII. CONCLUSIONS 23
REFERENCES 25
VI FIGURE LIST
Figure 1: Return on Assets 12
Figure 2: Return on Equity 12
Figure 3: Profit Before Tax to Total Asset 13
Figure 4: Liquid Assets Ratio 14
Figure 5: Acid Test Ratio 15
Figure 6: Equity ratio to Total Asset Ratio 16
Figure 7: Equity to Loans Ratio 16
VII TABLE LIST
Table 1: Mean of ratios between 2014-2010 17
Table 2: Change of means between 2014-2010 18
VIII
ACRONYM
AGB: Al Baraka Group of Banking
BRSA : Banking Regulation and Supervision Agency.
TKBB : Participation Banks Association of Turkey
TCMB: Central Bank of the Republic of Turkey
etc: et cetera
CB: Conventional Bank
ROA: Return on Asset
ROE: Return on Equity
PB: Participation Bank
P: Page
1
COMPARISON BETWEEN PARTICIPATION BANKS AND
CONVENTIONAL BANKS EVIDENCE FROM TURKEY
I. INTRODUCTION
Everything is shaped in terms of human needs. More than ninety percent of our country is Muslim, Islamic Banking, conservative religious reasons to enter the sector is included in its own capital system. This closes an important aspect missing. It draws attention to the recent trend caught on Islamic Banking. In addition, the current market share is increasing rapidly with the banks and the opening of the newly opened. In many academic studies as an emerging industry it has also found its place in a global sense. The functioning of the system, working principles, other financial institutions of the differences, advantages and disadvantages from other financial institutions, has been questioned. In this context, financial circles, has revealed participation banks and academic studies evaluating the financial performance of conventional banks. Also accepted a similar work previously carried out in the world, we studied in this market for Turkey.About banks' financial performance, profitability, liquidity and risk ratios were dealt with. The data obtained are shown in this section and interpreted.
This project is in seven parts. First part is introduction.In second part, Turkey has made an overview of the banking sector. Also participation banking and its applications are discussed. In the third part, the literature reviews of this study, related and similar studies are shown in there. In fourth chapter, the number of samples are given about how to handle the issue and hypotheses. In the fifth chapter, information about financial ratios used in this study is given.In sixth, the results obtained for each ratio shown here as graphics. In last chapter, section includes the results of the study.The data obtained are shown in this section and interpreted.
2
II. BANKING SECTOR OF TURKEY
2.1. An Overview Banking Sector in Turkey
Bank word comes from Banco in Italian which means table, desk. In general, it is a matching organization between who want to borrow money and who want to lend money. Bank is intermediary foundation between them. Bank is a foundation, which collects deposit from customers then rent (gives credit) that to other customers who need.
Turkey has rooted banking tradition. Turkey, in recent years, Banks have had a leading role in the financial sector and It has also significantly improved through the Turkish finance system. When the development of the Turkish economy, the state is seen that the structure of the financial system and mainly play a leading role. After the founding of the Republic, within the framework of the creation of a national banking sector is dominated by established banks of public capital. And these banks and subsequently founded private banks formed the Turkish banking sector. Outsourcing of banking with the process beginning in the 1980s and structural changes in the whole financial system has been implemented. These structural changes have led to the banking sector and financial system development and growth. After this period, Turkey lived a few economic crisis, it has also negatively affected the banking sector. The restructuring of the banking sector and solve the problems of the financial position of the bank has become inevitable. In order to solve this problem, to restructuring and to integrate with international markets, Turkish banks have made significant changes in the organizational structure and the services.
The beginning of the period 1839, there is not much banking activities in the Ottoman Empire. In our country, the Istanbul Bank name in 1847 after the
3
proclamation of the Tanzimat first bank in the true sense, has been established.1 The banks operating in the market before the Republic, with that much by foreign capital or foreign subsidiary, was established specifically to finance foreign companies operating in Turkey. The first trade and commercial banks in the modern sense of the Ottoman Empire, the Ottoman Bank was established in 1856
by foreign capital. It said the bank, which was established in our country first
emission bank. The first national banks established in the Ottoman Empire, Memleket Sandıkları is. The first feature of agricultural credit fund corporation which was founded in 1861. In 1868, in order to save the collection Emniyet Sandığı has been established, after a while, both the bank, founded in 1888, is combined with the Ziraat Bank. In the Republican era and beyond, first established bank, İş Bank’ was founded in 1924. In 1930, TC. ‘The Central Bank’ has been established.2 After this point, it continued to set up new banks and the banking system has become today.
2.2. Participation Banking
Islamic finance has attracted attention as a rapidly growing alternative
sector in recent years. Islamic banking is working with the same logic with
conventional banks. But in their system, Islam's ban on interest adopted (riba) is
not. Instead, profit and loss sharing is concerned.All investments are formed in
this case in principle. Islamic banking does not have sufficient market share for
now, but continues its development. Participation Banks in the world and in our
country's interest in Islam forbid the execution of that interest and involvement in the financial system it has been established because of the need. The most important contribution of Islamic banks, the owners of capital into the system because of religious reasons, has been to include in the banking system. Thus, it fills an important gap in the financial sector.
1 Öztürk, F., 2013, Yeni bir sermaye piyasası aracı olarak sukuk, yüksek lisans tezi, p:14-16, 2 Yıldırım,O, Türkiye’de bankacılık sektörü, Çanakkale 18 Mart Üniversitesi, p:2-5
4
In November 2005, “Special Finance Houses” has been transformed into “Participation Banks”, gaining the “bank” statute. According to all participation banks provisions of law operating in Turkey, being a member of the Participation Bank Association of Turkey (PBAT) within one month from the date they receive permission to operate. Turkey to comply with the Statute of the provisions of Participation Banks Association and shall implement the decisions taken by the competent organs of the Union.3 The aim of the Union, in the framework of a free market economy and full competition principles, participation banks of the rights and defend the interests, growth of the banking system, the development of studies and the banking profession as well, to work in order to increase competitiveness, the creation of a competitive environment and to take the necessary decisions in order to prevent unfair competition / taken to ensure is to demand and enforce implementation.4
Albaraka Turk Participation Bank is the first participation bank in the Republic of Turkey in 1985.Albaraka Banking Group (AGB), established by the Islamic Development Bank (IDB). Asya Bank was established in 1996. After that, in 1989, Kuveyt Turk was founded. In 2005, Türkiye Finans Participation Bank was created by merger of Anadolu Finans and Family Finance. In 2015, Ziraat Participation Bank has been in operation as the fifth participation banks. Vakıf Participation Bank was established in 2016. Thus, the number of Participation Bank in Turkey has increased to six.
2.3. Place of interest in Islam
Meaning of interest is “cost of rented money, return of borrowed money.” Interest, in Islam, is called Riba.According to Islamic law, it should be shared risks and profits together, but interest is increasing as unjust property. Interest, according to Islam, usury and is considered to be unlawful because it
3 TKBB: http://www.tkbb.org.tr/tarihce 4 TKBB: http://www.tkbb.org.tr/gorevleri
5
meant that provide an unfair advantage.5 The reasons for the moral prohibition of
interest by Islam is based on the view that the damage to the social and economic life. Interest constitutes obstacles to social justice and leads to the accumulation of wealth in certain areas.
2.4. Methods of Islamic Finance
2.4.1. Murabaha
In Islamic Finance, Murabaha have common usage field and which is one of the most transaction types. Interest (Riba) is forbidden in Islam, to handle this case, Murabaha is best way in Shariah. Murabaha mean is “Sales Contract”, when a customer needs a product, capital owners buys that product behalf of the customer. The capital owner sells it to the customer in new price (mark-up trading) with deferred payment agreement. The new price of product includes capital owner’s profit.
We can see Murabaha transaction especially in Participation Banks. In order to give credit for customers Murabaha is used. Its logic is different from Classical Banks’ credit. Participation Banks do not give cash to customers in credit. Instead of this The Banks buy product who customer needs it, after that sell it the customer on new price with Murabaha agreement. For example; One customer needs a car, we assume that, cost of car is 20 000 USD on cash payment. In order to buy that car, The Customer applies to a Participation Bank, The Bank enter into Murabaha deal with the customer. After that The Bank buys that car for customer. Then The Bank sells that car the customer on new price. We assume that new price is 24 000 USD. After that all, customer pays by instalment to The Bank.
5 Öztürk,F. p:6-10.
6 2.4.2. Salam
Salam meaning is forward sale of products or goods. This transaction especially uses for agricultural products trade. Istisna method has similar logic with forward in derivative markets. One commodity’s price is paid in advance however; the buyer obtains the commodity in specific date in future. In Salam method, commodity should be delivered on decided date otherwise buyer cannot claim any penalty cost (interest) from seller. Until reach the delivery time, the buyer cannot sell the commodity to other buyer. And price of the commodity should be paid totally by the buyer. These three things are crucial for original Salam method.
2.4.3. Istisna
“İstisna” comes from the same root of industry in Arabic and Its mean is “do, build, produce.” In finance its mean is forward sale for future building. Istisna is very similar with Salam transaction however, as we understand from the means of the Istisna, Istisna especially uses for building or production transaction. This Sukuk is preferred especially big projects like highways, airport, barrage, etc.6
2.4.4. Mudaraba
Meaning of Mudaraba is “Get the Road” “Get One’s Departure” in Arabic. Mudaraba is partnership of labor and capital to making a project. Mudaraba’s mean is trust financing in finance. In this application a side gives capital, other side puts own knowledge (know how). With this way, Mudaraba is one of the most suitable application in Islamic Finance Ideology however, it is not used often. (Mudaraba application is needed more time than other application therefore capital owners get their own proceeds late and other investment tools
6 Alsaeed, K. 2012. Sukuk Issuance in Saudi Arabia: Recent Trends and Positive Expectations,
7
can be more profitable and less risky. And moral hazard problem. These all are reason of it)7
In Mudaraba application, Sides decide their own profit rate previously (Mudaraba cannot offer fixed yield. Only rate) and all loss (if it be) belongs to Capital owner (Rabbul Mal), other side do not. For Mudaraba projects should be taken Sharia Commission’s advice and Sides should act in Sharia until the project end.
2.4.5. Musharaka
Musharaka is partnership of profit/loss on a project. Meaning of Musharaka is “take a part”, “to participate” in Arabic. In Finance Musharaka is “become partnership with capital and labor for a project. Mudaraba and Musharaka have very similar structure with each other. In Mudaraba, a side puts their own capital, other side puts his own labor. In Musharaka all sides put capital and labor both of them for a project. Sides do not have to put equal resource in Musharaka, the proportion can be different, which is decided in beginning of project. Case of profit or loss, all sides responsible according to their own share rate.8 In Mudaraba application, just capital owner is responsible for loss case however, in Musharaka all sides are responsible. In Musharaka application all sides have right of management however, in Mudaraba, Mudarip only have that right.
2.4.6. Ijarah
Meaning of Ijarah is “rent, lease out, usage right” in English. Ijarah applications similar with Leasing in classical financial markets. In Ijarah applications, Clients apply a Participation Bank for needed machine, asset, property etc. Sides enter a Ijarah agreement. After that, The Bank buys that goods, then which rent it to The Client. (Participation Banks has right of make leasing
7 Alsaeed, K., 2012, p:11
8
contract, in spite of that Classical Banks do not have.) Ijarah can be thought as a credit however, the credit is not given in cash instead of this it is given as machine, assets etc. It can be an example for Ijarah application; HD Corporation needs to Cargo Ships for transportation operations, however their cost too high to buy. The Corporation applies a Participation Bank to get the ships. The Sides enter into an Ijarah Agreement. Then which buys ships and lease to HD Corporation. The Corporation pays rental of ships on instalments. End of the period, HD Corporation can purchase the ships from the Bank.
In Murabaha, Participation Bank buys needed goods for behalf their own clients, then which sells it to clients in new price (mark-up). End of the sale, The Bank do not have any responsibility on the goods. In Ijarah, Participation Banks buys goods for which client needed them. Then The Bank rent them to clients until agreement finish. The Bank just sells right of usage of the goods. Therefore, The Banks have responsibility on goods in Ijarah. The Banks, in order to decrease their own risk, use insurance (Tekaful) in Ijarah.
2.4.7. Wakala
Meaning of Wakala is agency, agency agreement in Islamic Finance, which has similar logic with conventional investment management application. Agent is called as Wakeel or Wakil, who runs fund or assets of Investors, behalf them. (In Wakala Sukuk, Wakil runs them behalf Obligator.) Wakil gets wage for it.
III. LITERATURE
In order to measure financial performance of the Conventional Deposit Bank and Participation Bank, profitability ratio, liquidity ratio and credit risk ratio are used as an independent variable. Financial performances of the related banks are dependent variable. According to value of profitability ratio,
9
liquidity ratio and credit risk ratio, financial performance of the related banks will
be observed
.
Bank comparison with financial ratios method, that is globally used several academic studies such as Muhammad Moin, (2008). He used Profitability, liquidity, risk and solvency ratio, and efficiency ratio. He found profitability and risk ratios are higher in Conventional Bank. Murugan and Entebang (2014), In their study, profitability, liquidity and credit risk ratios are used. According to their result, profitability is higher in conventional banks however, liquidity is higher and risk is lower in Participation Banks. Rashid and Nishat (2009), In this study, risk and return ratios are used, according to their result, participation banks have lower performance than conventional banks. Abdus Samad (2004), He used profitability, liquidity, and loan risk ratio to measure financial performance of Conventional and Islamic bank. He found that, Participation Banks have better position in liquidity and also they are less risky. Masruki and Wahap (2011), They measured which bank is more effective and they used liquidity, profitability and efficiency ratios. According to their result, Conventional Banks’ profitability and liquidity are higher than the participation banks. Widagdo and Ika (2008), They used liquidity, profitability, risk and efficiency ratios. In this study, They found there is no major difference between related banks. Seref Turen (1996). He used risk and profitability ratios to measure financial performance of banks. He found Islamic Banks have more profitability and lower risky.
Parlakkaya and Çürük (2011), They found for Turkey, with their empirical study, Conventional Banks and Participation Banks in Turkey were examined whether they can be distinguished from each other through financial ratios. Results for Turkey, profitability and liquidity ratios showed could be used to distinguishing between the two types of bank.9
9 Parlakkaya R. and Çürük S. (2011). Finansal Rasyoların Katılım Bankaları ve Geleneksel
Bankalar arasında bir tasnif aracı olarak kullanımı, Türkiye Örneği, Cilt:11, sayı:3, Ege
10
IV. DATA
Turkey’s Banking System has six Participation Banks in this time, in this study used three of them. Islamic Bank were represented with AlBaraka Bank, Kuveyt Turk Bank, Türkiye Finans Bank. Bank Asya was transferred to TMSF, therefore it was not chosen. Vakıf Participation Bank and Ziraat Participation Bank are very new; they do not have any data between 2010 – 2014 years.
Sixteen Deposit Banks are used in this study, Akbank, Anadolubank, Burgan Bank, Denizbank, Fiba Bank, Finans Bank, Garanti Bank, Halk Bank, HSBC Bank, ING Bank, İş Bank, Şekerbank, Türk Ekonomi Bank, Yapı ve Kredi Bank, Vakıf Bank, Ziraat Bank. These Banks have working from long time, and They are good representatives of the Turkish Banking System and They also have sufficient data for this study.
For this study, I used three Participation Banks and sixteen Deposit Banks’ annual reports, balance sheets, income statements, cash flow tables between 2010 and 2014 years. Also some information was collected from The Banks Association of Turkey (TBB) and The Participation Banks Association of Turkey (TKBB).
V.METHODOLOGY
In this study, financial ratios are used to see related banks’ financial performance. The Financial Ratios are divided three part. First is profitability ratio which consists of the return on asset ratio (ROA) (Net Profit / Total Asset), return on equity ratio (ROE) (Net Profit / Equity) and Profit Before Tax to Total Asset Second part is liquidity ratio which consist of Liquid Assets Ratio (Liquid Assets / Total Assets), Acid Test Ratio (Liquid Assets / Current Liabilities). Third and last
11
part is Credit Risk Ratio, which consist of Equity to total asset ratio (Shareholders Equity / Total Assets), Equity to loans ratio (Total Equity/Net Loans) and Capital Adequacy (equity / risk weighted assets). In order to see financial performance Participation Banks and Deposit Banks, T-test method is used. With this test, means of is profitability ratio, liquidity ratio, credit risk ratio are measured to decide is there significant difference from each other. If the probability ratio is less than 0.05, the null hypothesis will be rejected.
Profitability ratios, liquidity ratios, credit ratios are measured to decide; Is there any significant difference from each other. Our hypotheses are Ho(null) and Ha(alternative) and If the probability value (p-value) is less than 0.05, the null hypothesis will be rejected.
Ho:
There is no significant difference in the mean of related financial ratio between Participation Banks and Deposit Banks.Ha:
There is a significant difference in the mean of related financial ratio between Participation Banks and Deposit Banks.We have three ratios therefore there are three null (Ho) hypothesis:
Ho1:
There is no significant difference in the mean of profitability ratio between Participation Banks and Deposit Banks.Ho2:
There is no significant difference in the mean of liquidity ratio between Participation Banks and Deposit Banks.Ho3:
There is no significant difference in the mean of risk ratio between Participation Banks and Deposit Banks.12
VI. EMPIRICAL RESULTS
4.1. Comparison of Financial Ratio
4.1.1. Profitability Ratio
In a period of time, profitability patio is applied to see the Banks’ ability and capacity of generate earning. In profitability ratio, return on assets and return on equity are applied to calculate profitability. In this section, Turkey Banking Regulation and Supervision Agency (BRSA)’s data and method are used to measure profitability of related banks.
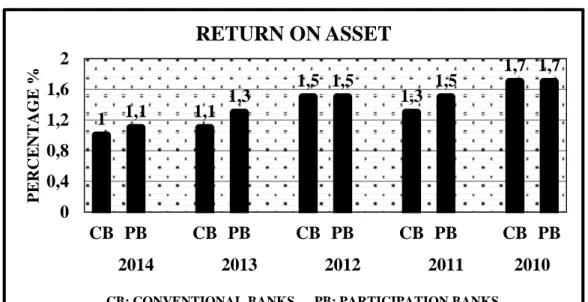
4.1.1.1. Return on Assets (ROA): Net Profit / Total Asset. This ratio shows us how profitable related banks. Higher value return of assets represents better result.
Figure 1: Return on Assets
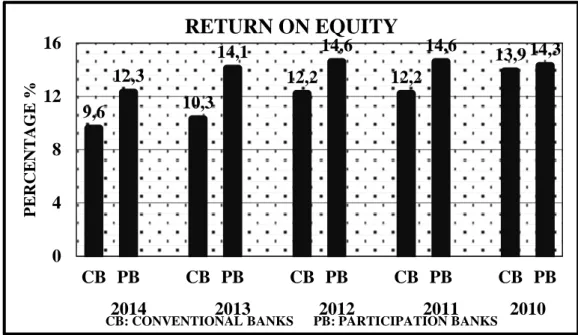
4.1.1.2. Return on Equity (ROE): Net Profit / Equity. Roe evaluates related
banks’ profitability and how much profit related banks create with shareholders’ funds. Higher value return of equity represents better result.
1 1,1 1,1 1,3 1,5 1,5 1,3 1,5 1,7 1,7 0 0,4 0,8 1,2 1,6 2 CB PB CB PB CB PB CB PB CB PB 2014 2013 2012 2011 2010 P E R C E N T A G E %
CB: CONVENTIONAL BANKS PB: PARTICIPATION BANKS
RETURN ON ASSET
13 Figure 2: Return on Equity
4.1.1.3. Profit Before Tax to Total Asset: This ratio an indicator of how bank
use its asset to generate revenue before tax payment. Higher results express more effective to generate revenue, this ratio also indicator of management efficiency.
Figure 3: Profit Before Tax to Total Asset 9,6 12,3 10,3 14,1 12,2 14,6 12,2 14,6 13,9 14,3 0 4 8 12 16 CB PB CB PB CB PB CB PB CB PB 2014 2013 2012 2011 2010 P E R C E N T A G E %
CB: CONVENTIONAL BANKS PB: PARTICIPATION BANKS
RETURN ON EQUITY
1,3 1,4 1,3 1,6 2 3,1 1,7 1,9 2,1 2,2 0 1 2 3 4 CB PB CB PB CB PB CB PB CB PB 2014 2013 2012 2011 2010 P E R C E N T A G E %CB: CONVENTIONAL BANKS PB: PARTICIPATION BANKS PROFIT BEFORE TAX TO TOTAL ASSET
14 4.1.2. Liquidity Ratio
Mean of liquidity is how short time assets or securities can be easily converted to cash without any affecting the asset's price. Liquid assets are ready to use values, which can be converted cash in short time.
In this section, Turkey Banking Regulation and Supervision Agency (BRSA)’s data and method are used to measure liquidity of related banks. In liquidity three ratios are used: Liquid Assets Ratio (Liquid Assets / Total Assets), Acid Test Ratio (Liquid Assets / Current Liabilities) and TL Liquid Assets / Total Assets.
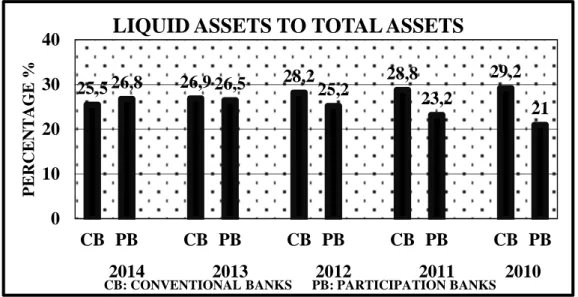
4.2.1.1. Liquid Assets Ratio: Liquid Assets / Total Assets (Cash + Cash
Equivalents + Short Term Investments + Current Receivables / Total Assets). Cash, cash equivalents, short term investments, current receivables are supposed to liquid assets. This ratio shows us, proportion of liquid assets in related banks’ total assets. Higher result expresses banks have more in liquid.
Figure 4: Liquid Assets Ratio
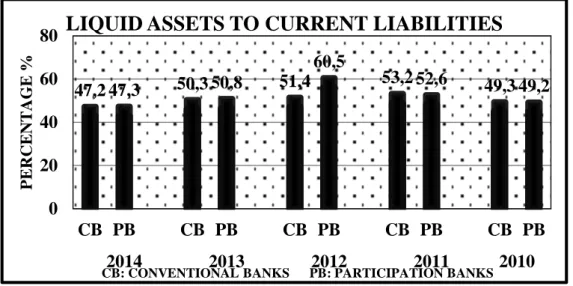
4.1.2.2. Acid Test Ratio: Liquid Assets / Current Liabilities. (Cash + Cash
Equivalents + Short Term Investments + Current Receivables / Current
25,5 26,8 26,9 26,5 28,225,2 28,8 23,2 29,2 21 0 10 20 30 40 CB PB CB PB CB PB CB PB CB PB 2014 2013 2012 2011 2010 P E R C E N T A G E %
CB: CONVENTIONAL BANKS PB: PARTICIPATION BANKS
LIQUID ASSETS TO TOTAL ASSETS
15
Liabilities). Acid ratio also known as quick ratio. This ratio represent banks have enough short term assets or not, to pay urgent liabilities. Higher result represents better liquid proportion.
Figure 5: Acid Test Ratio
4.1.3. Risk Ratios
Credit risk ratio measures how strong banks against negative conditions and it is an indicator of banks’ financial structure. In this section, Turkey Banking Regulation and Supervision Agency (BRSA)’s data and method are used to measure credit risk of related banks. In credit risk ratio, equity ratio and equity to loans ratio are applied to calculate credit risk performance.
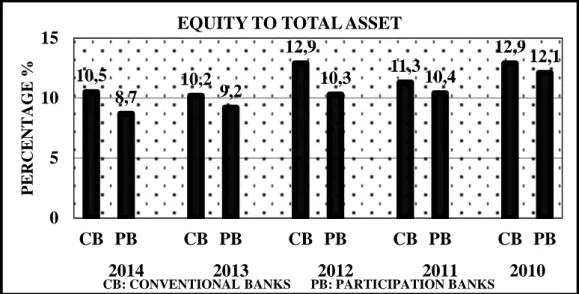
4.1.3.1. Equity to Total Asset Ratio: Shareholders Equity / Total Assets This
ratio measures amount of equity in banks’ total assets, which represents amount of assets financed by shareholders. It ratio shows us how strong financial structure of bank against asset losses. Higher result of equity ratio expresses higher capacity to maintain in negative conditions.
47,2 47,3 50,3 50,8 51,4 60,5 53,2 52,6 49,3 49,2 0 20 40 60 80 CB PB CB PB CB PB CB PB CB PB 2014 2013 2012 2011 2010 P E R C E N T A G E %
CB: CONVENTIONAL BANKS PB: PARTICIPATION BANKS
LIQUID ASSETS TO CURRENT LIABILITIES
16 Figure 6: Equity ratio to Total Asset Ratio
4.1.3.2 Equity to Loans Ratio: Net Loans / Total Equity. This ratio expresses
how much loan banks are using to finance their own assets according to shareholder equity. Also this ratio is indicator of financial risk for banks. Higher result of equity to loans ratio represents better condition.
Figure 7: Equity to Loans Ratio 10,5 8,7 10,2 9,2 12,9 10,3 11,310,4 12,9 12,1 0 5 10 15 CB PB CB PB CB PB CB PB CB PB 2014 2013 2012 2011 2010 P E R C E N T A G E %
CB: CONVENTIONAL BANKS PB: PARTICIPATION BANKS EQUITY TO TOTAL ASSET
11,5 9,4 11,1 10,2 13,5 11,5 12,0 11,7 14,1 13,8 0,0 5,0 10,0 15,0 20,0 CB PB CB PB CB PB CB PB CB PB 2014 2013 2012 2011 2010 P E R C E N T A G E %
CB: CONVENTIONAL BANKS PB: PARTICIPATION BANKS
EQUITY TO DEBT
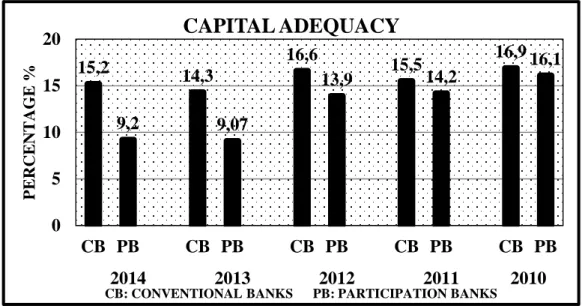
17 4.1.3.3 Capital Adequacy (equity / risk weighted assets): The ratio is used for
controlling to risk which are taken by the bank capital. This ratio also important for preventing the banking crisis, protecting customers and running the system of banking in good way. This ratio an international indicator of risk. In international banking sector, this ratio should be least 8%, higher result gives that banks are more durable against excessive loses.
Figure 8: Capital Adequacy
Table 1: Mean of ratios between 2014-2010
CB PB
RETURN ON ASSET 1,3 1,4
RETURN ON EQUITY 11,6 14,0
PROFIT BEFORE TAX TO TOTAL ASSET 1,7 2,02
LIQUID ASSETS TO TOTAL ASSETS 27,7 24,5 %
ACID TEST RATIO 50,3 52,1
EQUITY TO TOTAL ASSET 11,6 10,1
CAPITAL ADEQUACY 15,7 12,5
EQUITY TO DEBT 12,4 11,3
CB: CONVENTIONAL BANKS PB: PARTICIPATION BANKS
15,2 9,2 14,3 9,07 16,6 13,9 15,514,2 16,9 16,1 0 5 10 15 20 CB PB CB PB CB PB CB PB CB PB 2014 2013 2012 2011 2010 P E R C E N T A G E %
CB: CONVENTIONAL BANKS PB: PARTICIPATION BANKS
CAPITAL ADEQUACY
18 Table 2: Change of means between 2014-2010
2014-2013 2013-2012 2012-2011 2011-2010 FINANCIAL RATIOS CB PB CB PB CB PB CB PB RETURN ON ASSET -10% -18% -36% -15% 13% 0% -31% -13% RETURN ON EQUITY -7% -15% -18% -4% 0% 0% -14% 2%
PROFIT BEFORE TAX TO
TOTAL ASSET 0% -14% -54% -94% 15% 39% -24% -16%
LIQUID ASSETS TO
TOTAL ASSETS -5% 1% -5% 5% -2% 8% -1% 9%
ACID TEST RATIO -7% -7% -2% -19% -4% 13% 7% 6%
EQUITY TO TOTAL ASSET 3% -6% -26% -12% 12% -1% -14% -16%
EQUITY TO DEBT 3% -8% -21% -14% 11% -1% -18% -18%
CAPITAL ADEQUACY 6% 1% -16% -53% 7% -2% -9% -13%
CB: Conventional Banks PB: Participation Banks
4.2. Result of Hypothesis Test
Financial performance result and hypothesis test result of conventional deposit banks and participation will be evaluated in this section.
Profitability ratio is consisting of two ratios, they are return on asset (ROA) and return of equity (ROE). In conventional banks group and participation banks group, in 2010 mean of return on asset is 1,7% (Figure 1) These results show us conventional banks and participation banks have same performance in this year. According to t-test result, p-value of this year is 0,976 (Table 3) this expresses that there is no significant difference on financial performance. In 2011, in conventional banks group, mean of return on asset is 1,3%, mean of return on asset in participation banks 1,5%. In 2011, The participation banks have better result. P-value of this year is 0,563, there is no significant difference on financial performance. in 2012 mean of return on asset is 1,5%. This results show us conventional banks and participation banks have same performance. According to
19
t-test result, p-value of this year is 0,812, this result shows that there is no significant difference on financial performance. In 2013, the conventional banks have 1,1% and the others group is 1,3% this year participation banks have higher performance. This year’s p-value is 0,233 and it is higher than 0,05 therefore Ho not rejected. Last year, in 2014, The participation banks have 1,1% and the conventional banks have 1,0%. P-value of this year is 0,751. there is no significant difference on financial performance for 2014. In five years, in the three years the participation banks have higher result, left two years the two group have same performance in return on assets ratio. Mean of five years, in the conventional banks group is 1,3% and in the participation banks group is 1,4%. (Table1) According to this score, the participation banks have higher performance however, all means are very close each other there is not much difference. Therefore, t-test result shows, there is no significant difference on financial performance Ho Not Rejected” in every year in return on assets. (Table 3)
In return on equity ratio (ROE), in 2010 average of conventional banks is 13,9% and average of participation banks is 14,3%. (Figure 2) In this year, according to t-test result, p-value is 0,845. This result shows there is no significant difference in mean. Following year, in 2011, results are 14,6% and 12,2%. Participation banks have higher performance. P-value is 0,107 and it is higher than 0,05, therefore Ho not rejected. In 2012, the banks performance mean is same with previous year and Ho not rejected. In 2013, Participation banks have higher result with 14,1%. And this year’s p-value is 0,012. This results shows Ho rejected. There is a significant difference in the mean of profitability ratio between Participation Banks and Deposit Banks. Also 2014 year is giving same result with 0,0001 p-value. (Table 3) Mean of five years, in the conventional banks group is 11,6% and in the participation banks group is 14,0%. (Table 1)
In profit before tax to total asset ratio, in 2010, means are close each other, participation banks 2,2%, conventional banks 2,1%. Also p-value is high 0,83. (Figure 3) Ho hypothesis cannot be rejected in this year. (Table 3) Following year, we are looking similar result, participation banks are higher with 1,9%. P-value is
20
0,01 which less than 0,05 therefore Ho is rejected. In 2012, Participation banks’ mean is 3,1% and conventional banks’ mean is 2.0%. P-value is 0,04, there is significant difference on financial performance between related banks. In 2013, participation banks are higher mean 1,6%. P-value is 0,21, with this result Ho is not rejected. In following year 2014, P-value is higher than 0,05 and Ho is not rejected. The banks have close performance to each other. Mean of five years, in conventional banks have 1,7% and participation banks have 2,02%. (Table 1)
According to Abdus Samad (2009), and Ersan Özgür (2007) Participation banks investment field is limited. Participation banks’ investment must be suitable Sharia therefore these bank cannot invest each types investment tool but conventional banks can do therefore conventional banks’ investment pool is more than participation banks. However, this results expresses that Participation Bank’s performance is not weak, even many years higher than conventional banks. When we look the result of t-test, all means are very close each other there is not much difference. Therefore, t-test result shows, there is no significant difference on financial performance in many years.
Liquidity ratio is consisting of two ratios in this study, which are liquid assets to total assets ratio, and acid test ratio. In 2010, Conventional banks’ average liquid asset to total asset ratio is 29,4%, (Figure 4) participation banks liquid asset ratio is 21%. P-value of this year is 0,0001. (Table 3) That results represent that there is significant difference on financial performance and Ho is rejected. In 2011, Conventional banks’ result is 28,8% higher than participation banks. Also p-value is 0,0036, Ho is rejected. This result expresses that conventional banks have more liquid asset in their own total assets in this year. Following year, again conventional banks have higher mean, however, this year there is no significant difference, p-value is 0,378. In 2013, conventional banks’ mean is higher 0,4% than participation banks, and p-value is higher than 0,05, Ho is not rejected. In 2015, we see performance increase in participation bank group mean of this group is 26,8% and conventional banks group have 25,5%. P-value
21
of related financial ratio between Participation Banks and Deposit Banks, Ho is not rejected. Means of five years are, (Table 1), in conventional bank 27,7% and in participation bank 24,5%
When we look acid test ratio result (Figure 5), in 2010, conventional banks’ mean is 49,3% and other group have 49,2%. P-value is 0,993. (Table 3) Ho is not rejected. In following year, conventional banks’ mean is 53,2% and participation banks have 52,6%. Difference of mean is not much, also p-value is higher than 0,05 therefore there is no significant difference, Ho is not rejected. According to 2012 year’ result, participation banks’ mean is higher than conventional bank. P-value of this year is 0,943 therefore Ho is not rejected. In 2013, related banks’ mean is very close each other, 50,8% and 50,3% and p-value is 0,959. There is no significant difference in the mean of related financial ratio between Participation Banks and Deposit Banks. Last year in 2014, participation banks have 47,3% and conventional banks have 47,2%, again means are very close each other. P-value of this year is 0,989 and Ho is not rejected. Means of five years are (Table 1), in conventional bank 50,3% and in participation bank 52,1%
According to this results, each year of acid test ratio shows us there is no significant difference in the mean of related financial ratio between Participation Banks and Deposit Banks and also all means are very close each other. Other liquidity ratio, in liquid asset to total asset ratio, we can find difference between means in 2010 and 2011. In other related years, Ho is not rejected.
Credit risk ratio, credit risk ratio is consisting of equity to total asset ratio capital adequacy ratio and equity to loans ratio. In conventional banks group average equity to total asset ratio (Figure 6) is 12,9 % and in participation banks group is 12,1%, in 2010. P-value (Table 3) is 0,292. According to this results, there is no significant difference, Ho is not rejected. In 2011, conventional banks’ mean is higher 11,3% and p-value is 0,126, with this results, again Ho is
22
not rejected. In following year, conventional banks’ mean is 12,9%, participation banks have 10,3%. P-value of this year is 0,001. This results express that Ho is rejected, there is significant difference between means. This results represent conventional banks have better performance than participation banks, also which show us conventional banks are more durable against negative conditions in this year. In following years (2013-2014) we are finding similar result with 2012. Mean of The Conventional banks is higher and Ho is rejected. Means of five years are (Table 1), in conventional bank 11,6% and in participation bank 10,1%
For capital adequacy ratio, in 2010, The Conventional Banks have 16,9% mean, The Participation Banks have 16,1%. Means are close each other and p-value is 0,364. According to this result, Ho is not rejected. There is no significant difference. In following year, with 15,5% and 14,2% mean results and 0,205 p-value, we find same result, there is no significant difference (Table 3). In 2012, the Conventional Banks’ mean is higher 2,7% than the Participation Banks. P-value is 0,0001, according to this result, Ho is rejected, there is a significant difference in the mean of related financial ratio between Participation Banks and Deposit Banks. In 2013 and 2014, conventional banks’ mean is higher. P-value of this years are higher than 0,05. Therefore, we cannot say, there is no difference between means and Ho is not rejected. Means of five years are (Table 1), in conventional bank 15,7% and in participation bank 12,5%
In last ratio in this study, equity to debt ratio, conventional banks’ means are higher than participation banks in related five years, according to means, they have better position against negative conditions. In 2010, Conventional banks have 14,1% (Figure 7) and participation banks have 13,8%. P-value of this year is 0,721 and Ho is not rejected. In 2011, The Banks means are 12,1% and 11,0%. P-value is 0,673, Ho is not rejected. In 2012, Means are 13,5% and 11,5%. P-P-value of this year is 0,06, Ho is not rejected. In this three years, we cannot find significant differences between related banks’ means. In following year, in 2013, conventional banks have 11,2% and participation banks have 10,2%. P-value for this year is 0,0001. According to this result, Ho is rejected. In last year, in 2014,
23
means of the banks are 11,5% and 9,4%. In this year, P-value is 0,0001. According to this p-value, there is a significant difference in the mean of related financial ratio between Participation Banks and Deposit Banks. In equity to loan ratio, average of conventional banks is 12,4 % and average of participation banks is 11,3% (Table 1). According to result of this ratio, conventional banks have better position, their financial risk indicator is better than participation banks. This explained by market size, long term experience of conventional banks,10 we can say same things for Turkey, many of conventional banks are deep rooted and market share is much more, therefore they stronger against risk factor.
VII. CONCLUSIONS
According to means, results show that participation banks perform better in profitability, this result same with similar previous article for Turkey (Parlakkaya,2011) while conventional banks perform better in risk ratios. In liquidity ratios, we cannot say a group is better, according to results, in Liquid assets ratio conventional banks have better result however, in acid test ratio, participation banks are better. In t-test of the return on asset and acid test ratio, there are no major difference between Islamic banks and non-Islamic banks. In the other six ratios, years show different results, therefore we partially reject null hypothesis. The statistically significant difference is not shown in the any part. This results are partially rejecting null hypothesis of profitability ratio, liquidity and risk ratio.
10 Rosly,A.and Bakar,A. (2003). Performance of Islamic and Mainstream Bank in Malaysia,
24 Table 3: Result of Two Tailed T-test
T-TEST P-VALUE INFERENCE
RETURN ON ASSET 2014 0,32 0,751 Ho Not Reject 2013 -1,24 0,233 Ho Not Reject 2012 -0,23 0,812 Ho Not Reject 2011 0,59 0,563 Ho Not Reject 2010 -0,03 0,976 Ho Not Reject RETURN ON EQUITY 2014 5,38 0,0001 Ho Reject 2013 2,80 0,012 Ho Reject 2012 1,74 0,1 Ho Not Reject 2011 1,70 0,107 Ho Not Reject 2010 0,20 0,845 Ho Not Reject
PROFIT BEFORE TAX TO TOTAL ASSET
2014 -0,38 0,71 Ho Not Reject 2013 -1,29 0,21 Ho Not Reject 2012 2,28 0,04 Ho Reject 2011 -2,91 0,01 Ho Reject 2010 -0,22 0,83 Ho Not Reject
LIQUID ASSETS TO TOTAL ASSETS
2014 0,43 0,676 Ho Not Reject 2013 -0,22 0,829 Ho Not Reject 2012 -0,90 0,378 Ho Not Reject 2011 3,38 0,004 Ho Reject 2010 5,42 0,0001 Ho Reject
ACID TEST RATIO
2014 0,01 0,989 Ho Not Reject 2013 0,05 0,959 Ho Not Reject 2012 0,94 0,358 Ho Not Reject 2011 -0,10 0,925 Ho Not Reject 2010 -0,01 0,993 Ho Not Reject
EQUITY TO TOTAL ASSET
2014 -47,57 0,0001 Ho Reject 2013 -3,17 0,006 Ho Reject 2012 -3,77 0,002 Ho Reject 2011 -1,61 0,127 Ho Not Reject 2010 -1,09 0,293 Ho Not Reject CAPITAL ADEQUACY 2014 -1,28 0,213 Ho Not Reject 2013 -1,18 0,254 Ho Not Reject 2012 9,99 0,0001 Ho Reject 2011 -1,32 0,206 Ho Not Reject 2010 -0,93 0,364 Ho Not Reject EQUITY TO DEBT 2014 -5,90 0,0001 Ho Reject 2013 -5,86 0,0001 Ho Reject 2012 -2,01 0,06 Ho Not Reject 2011 -0,43 0,673 Ho Not Reject 2010 -0,36 0,721 Ho Not Reject
25 REFERENCES
Alsaeed, K.S. (2012). Sukuk Issuance in Saudi Arabia: Recent Trends and Positive Expectations. Master degree thesis. Durham University.
Berk J. and DeMarzo P. (2011). Fundamentals of corporate finance. second.edition. Cambridge: Pearson Publisher.
Boulam, H. (2015). Participation Banking in Turkey: Comparative Analysis Z/Yen reference & perspectives. Master thesis. University of Torino.
Haider, J. (2010). Sukuk and its risk management. Master thesis. Umea University.
Masruki, R. and Wahab A. (2011). Financial Performance of Malaysian Founder Islamic Banks Versus Conventional Banks. Journal of Business and Policy
Research. vol. 6. No: 2. Special Issue. p:67-79.
Moin, M. (2008), Performance of Islamic Banking and Conventional Banking in Pakistan: A Comparative Study. Master degree project. University of Skövde.
Nathan M. and Entebang H. (2014). Comparison between Islamic and
Conventional Banking: Evidence from Malaysia. International Journal of
Islamic Banking & Finance. vol. 4, Issue 1.
Özgür, E. (2007). Katılım Bankalarının Finansal Etkinliği ve Mevduat Bankaları ile rekabet edebilirliği. Doktora tezi. Afyon Kocatepe Üniversitesi.
Öztürk, F. (2013). Yeni bir sermaye piyasası aracı olarak Sukuk. Yüksek lisans tezi. Marmara Üniversitesi.
Parasız, İ. (1998). Para ve banka. İstanbul: Ezgi Yayınevi.
26
Parlakkaya R, and Çürük S. (2011). Finansal Rasyoların Katılım Bankaları ve Geleneksel Bankalar arasında bir tasnif aracı olarak kullanımı, Türkiye Örneği, Ege Akademik review, cilt:11, sayı:3.
Rashid, M.and Nishat, A. (2009). Disparity of performance indicators of Islamic banks: study in Bangladesh. International Journal of Business and
Management, Vol.4. No.8, 52-72.
Rosly, A. and Bakar, A. (2003). Performance of Islamic and Mainstream Bank in Malaysia, international journal, of Social Economics, p: 1249-1265.
Samad, A., 2004, Performance of Free Islamic Banks Vis-a-Vis Interest-Based Conventional Banks of Bahrain, Journal of Economics and
Management 12, no.2.
Turen, S. (1996). Performance and risk analysis of the Islamic Banks: The case of Bahrain Islamic bank. Islamic Economics, vol.8, p: 3-14.
Widagdo,A. and Ika,R., 2008, The interest prohibition and financial performance of Islamic Banks: Indonesian evidence. International Business Research, p:98-105.
Yıldırım,O. (2004). Türkiye’de bankacılık sektörü, Çanakkale 18 Mart Üniversitesi.
Web Resources
About Al Baraka Bank, available on:
http://www.albaraka.com.tr/albarakayi-taniyin.aspx (19.12.2015)
About Kuveyt Turk Bank, available on:
http://www.kuveytturk.com.tr/tarihce.aspx (19.12.2015)
About TKBB, available on:
http://www.tkbb.org.tr/tarihce (19.12.2015)
27 About Turkiye Finans Bank, available on:
http://www.turkiyefinans.com.tr/tr-tr/hakkimizda/turkiye-finansi-taniyin/Sayfalar/turkiye-finansi-taniyin.aspx (19.12.2015)
Annual Reports for all Banks from 2010 to 2014, available on
http://www.bddk.org.tr/BdrUyg (06.02.2016)
Database about Conventional Banks available on:
http://www.tbb.org.tr/tr/bankacilik/banka-ve-sektor-bilgileri/istatistiki-raporlar/59 (20.02.2016)
Database about Participation Banks available on:
http://www.tkbb.org.tr/veri-seti (21.02.2016)
Faiz meaning available on: