\^ r - i :· : íi* Mf e t - fiitfi·'. - : H ( r Î İ 0 6 - 5 S ^ ^ 2 : -МІЩ ♦ ‘ · * |ί^ ίΜ **■'. p.* , г ... ■ -· .. , . -βΜ!»···. **' Νβ«4'* %w’ » ■· r - i - · ί^ " ι JuJil'-'V’' ЙЯ^'·*·· " ’ ■?'4í‘4r-~«wS''Li· ■ ^ 1 ·“ :_ ■ -í '* : · ■,:;-чвИ* »
PU R CH ASING POW ER PARITY:
A N APPLICATION FOR TU R K EY
(1980-1S87)
A Thesis
Su bm itt ed to th e Departm ent of Ma n a g e m en t
AND
THE In stitu t e of management sciences
OF
B IL K E N T U N IV E R S IT Y
IN Partial Fullfillm ent of th e Req uirem ents
FOR THE Degree of
M A S T E R OF B U S IN E S S A D M IN IS T R A T IO N
BY
OEM BİLGE
Ja n u a r y,1989
Н б - ' 2 0 6 . ' В А 9 2
© Co py rig h t 1989
BY
We certify th at we have read this thesis and in our opinion it is fully adequate, in scope and in qualit}’·, as a thesis for the degree of Master of Business Administra tion.
A ssist.P ro f. Gökhan Ç A PO Ğ L U
A ssist.P rof. Ü m it EROL
A ssist.P ro f. Kür§at A Y D O Ö A N
Approved for the Institute of Management S c ie n c es
A BSTR A C T
Purchasing Pow er Pa r it y:
AN Application for Turk ey
(1980-1987)
by
CEM BİLGE
MBA Thesis
Bilkent University - Ankara January, 1989
Supervisors: Dr. GÖKHAN ÇAPOĞLU L· Dr. ÜMİT EROL
Purchasing Power Parity (PP P) is claimed to be the oldest and simplest theory in
determining the exchange rates of currencies. W ith its three versions, absolute PPP,
relative PPP, and efficient markets PPP, this theory argues that price index levels of
the countries are considered while setting the exchange rates. In this study, a general review of the theorj' and its failures are initially summarized. As the main purpose of the paper, the relative P P P has been applied for Turkey between 1980 and 1987 by taking USA as the comparision country. The application has been concentrated on both the official and black-market exchange rate determinations.
K ey w o rd s: Purchasing Power Parity, Absolute PPP, Relative PPP, Efficient Markets Version of PPP, Wholesale Price Index, Consumer Price Index, Official Exchange Rates, Black-Market Exchange Rates.
ÖZET
Satinalm a g ü c ü PaRİTESİ: TÜRKİYE İÇİN Uyarlama (1980-1987) Hazırlayan: CEM BİLGEİşletme Yüksek Lisans Tezi Bilkent Üniversitesi - Ankara
Ocak,1989
Tez Yöneticileri: Dr. GÖKHAN ÇAPOGLU & Dr. ÜMİT EROL
Saünalma Gücü ParUesi (SGP) ülke para birimleri arasındaki kurların saptanmasında
bilinen en eski ve en basit teorilerdendir. Kurların belirlenmesinin ülkelerin fiyat en deks seviyelerine göre olması gerektiğini savunan bu teoride, mutlak SGP, göreceli
SGP ve etkin piyasalar yöntemi adı altında üç farklı yaklaşım bulunmaktadır. Bu
çalışmada, SGP teorisinin genel bir tanımı ve bu teorinin pratikteki varsayım hataları anlatılmaktadır. Çalışmanın ana amacı doğrultusunda, göreceli SGP yöntemi 1980 ve 1987 yılları arasında ABD ile kıyaslanarak Türkiye için uj^gulanmaktadır. Uygulamada hem resmi hem de karaborsa döviz kurlarının belirlenmesi ayrı ayrı İncelenmektedir.
A n a h ta r K e lim ele r: Satmalına Gücü Paritesi, Mutlak SGP, Göreceli SGP, Etkin Piyasalar Yöntemi, Toptaneşya Fi}'^at Endeksi, Tüketici Fiyat Endeksi, Resmi Döviz Kuru, Karaborsa Döviz Kuru.
ACKNOW LEDGEM ENT
I would like to express my gratitude to Assist.Prof. Gökhan Çapoğlu and Assist.Prof, lim it Erol for their patient supervision. I am also grateful to Assist.Prof. Kürşat Aydoğan for his valuable suggestions.
TABLE OF CONTENTS
A B S T R A C T ... iv Ö Z E T ... V A C K N O W L E D G E M E N T ... vi T A B L E O F C O N T E N T S ... vii 1. IN T R O D U C T IO N ...1 1.1. HISTORICAL BACKGROUND... 11.2. PURPOSE OF THE STUDY... 2
2. R E L A T E D R E S E A R C H ... 3
2.1. DIFFEREN T APPROACHES IN P P P THEORY...3
2.1.1. Absolute P P P ...3
2.1.2. Relative P P P ... 4
2.1.3. Efficient Markets Version of P P P ... 4
2.2. CONCEPTUAL BACKGROUND BEHIND P P P ...6
2.2.1. Law of One-Price...6
2.2.2. Barriers to Trade... 6
2.2.3. Tradable Goods vs. Nontradable Goods... 8
2.2.4. Variations in Price Indexes... 8
2.2.5. Sticky Prices... 9 2.2.6. Money Shocks...9 2.2.7. Capital Movements...10 2.2.8. Miscellaneotis...10 2.2.9. Pitfalls in Application of P P P ... 10 2.2.9.1. Base Period... 11 2.2.9.2. Comparision Country... 11
2.3. A PREVIOUS APPLICATION FOR THE TURKISH CASE.... 11
3. E M P IR IC A L S T U D Y ... 13
3.1. HYPOTHESIS...13
3.2. DATA... 14
3.2.1. Exchange Rates... 14
3.2.1.1. Official Exchange Rates...14
3.2.1.2. Black-Market Exchange Rates...15
3.2.2. Inflation Rates... 16
3.2.3. Time Period...17
3.3. TESTS AND THE RESULTS... 17
4. C O N C L U S IO N ... 20
A P P E N D IX ... 22
B IB L IO G R A P H Y ... 39
1. INTR O DUCTIO N
Purchasing power parity (PPP) is claimed to be the oldest and the simplest the ory for determining the exchange rates. In the broader sense, P P P theory is the explanation of the exchange rates with respect to the ratio of the domestic price level to the foreign price levels.
1.1. H ISTO R IC A L B A C K G R O U N D
According to L.H. Officer the theory of P P P was mentioned in the writings of the Salamanca School in Spain during 16th and the 17th centuries. W ith the bullionist periods, at the end of 18th century and at the beginning of 19th cen tury, theorists such as Christiernin, Ricardo, Wheatley and Tharion contributed to the construction of the theory; especially with their work on the depreciation of English pound due to the high inflation after the Napoleonic wars. Untill the first World War, the P P P theory had been worked on by a very small group of economists: John Stuart Mill, Goschen, Marshall and von Mises .
After the first World War, the P P P issue reemerged due to the inflation practiced during eind right after the war. The Swedish economist Gustav Cass el received much credit as being the originator of the theory with his proposal on reestab lishing the exchange rates which had been ceased during the war. Cassel applied a similiar approacli to the modern version of P P P theory in determining the ex change rates. He proposed to calculate the value of a certain currency by relative inflation rates. In other words, he suggested to set the equilibrium exchange rates by taking into account the amount of goods and services that a unit of currency can buy in its domestic markets.
For the time being, the theory of P P P is adopted in three different versions.The most initial one,absolute PPP, is followed by the relative PPP.Finally, the most recent one is the efficient markets version of PPP which assumes that the markets are efficient enough to generate the information and respond in their behaviors ac cordingly.
1.2. P U R P O S E OF TH E S T U D Y
This study mainly aims to test the relative P P P hypothesis for Turkey. In testing process, the time period between 1980 and 1987 is covered, while taking USA as the comparision countrJ^Moreover, both official and black-market rates in Turkey, are used while deriving the exchange rate changes.On the other hand, wholesale price and consumer price indexes will be taken into account for calculating the inflation differentials. Also, there will be given a review of the P P P theory initially in the study.This part will have the definitions of three approaches in PPP.Additionallj^, points th at may fail the validity of the theory will be offered in order to make the reader to precisely asses the results.
W ithin the above frame, hopefully, some outcomes will be generated with respect to the determination of official and black market exchange rates in Turkey. Those decisions may be utilized at the macro level, whereas researchers or practitioners can have some insights about the exchange rate policies in Turkey. W ith respect to its micro implications; international traders, financial institutions, and investors or savers can benefit from the results in such a market with high inflation rates and uncertainity.
2.RELATED RESEARCH
The purchasing power theory (P P P ) attracts great attention due to its simplicity in data requirements and ease of application. The theory gathers support and counterarguments by various economists.The discussions about the relevance of the theory have been in the issue for many years.
2.1. D IF F E R E N T A P P R O A C H E S IN P P P TH EO R Y
In today’s literature, three different versions of P P P are being discussed: 1. Absolute P P P
2. Relative P P P
3. Efficient Markets Version of P P P 2.1.1. A b solu te P P P
This approach, which has been originated by Cassel, states th at the exchange rate between the two currencies must be the ratio of the price levels in the coun tries of issue. In th at sense, the absolute version of P P P theory can be formulated as further:
Et =
A
p:
where;
E: exchange rates between two currencies P: domestic price level
P*\ foreign price level
t: current period As an example:
Let 10 units of domestic currency buy a certain bundle of goods in the domes tic market at a given time period. If it takes 5 units of foreign currency to buy the same bundle in the foreign market at the same time; then the equilibrium exchange rate must be equal to 2 units of domestic currency per a unit of foreign
currencj'·.
2.1.2. R elative P P P
Relative version of P P P is based upon the price level changes affecting the ex change rates. According to this approach, the exchange rate variations must com pensate the relative increases (or decreases) of the price levels between the two countries. Relative approaclr can be formulated as:
dEt dPt dPt* ~ Pt
Et P i
where;
percentage change in exchange rate
-w'· percentage change in domestic price level
-^rpercentage change in foreign price level t: current period
As an example:
If the domestic price level is increasing by 10% (inflation) and the foreign price level is decreasing by 2% (deflation) then the exchange rate between the two cur rencies (units of domestic currency per a unit of foreign currency) must increase by 12%. In other words, the domestic currency must depreciate bj'^ 12% as a response to the inflation differential of 12%.
2.1.3. Efficient M arkets Version o f P P P
The previous versions of P P P state th at the exchange rates are a reaction to the price level changes in the sense of reflecting the equlibria. But the question is about how long it takes to reach to this equilibrium level.
Empirical studies show th at the price level changes do effect the exchange rates; however, there is a lag in the adjustment process. A good example for this case is the study of Hodgson and Phelps; they report a lag of eighteen months in Japanese Yen markets after examining the data between April 1919 and April 1925 Fatemi
refers to this result in his paper^; and he states that price level changes precede exchange rate changes, implying lack of efficiency in foreign exchange markets. The term of efficiency in foreign exchange markets assumes th at the exchange rates must immediately reflect any new information containing relative variations of price levels (inflation or deflation).
The lag question actually leads to the application of the efficient markets version of P P P theory.This approach implies th at the future exchange-adjusted difference in price levels between two countries may be estimated from the current exchange rate.
W ithin this perspective, Koveos and Seifert ‘‘summarize and formulate the con cept of efficiency theory by referring to Rolfvfho is one of the first to utilize of this approach: The present spot rate contains all information necessary to predict the future spot rate adjusted for anticipated inflation;
E x p [ / n £ < i — = I n E f —i
where;
Exprexpectations operator linformation set at time t-1
E t‘. spot exchange rate at time t. E i-i: spot exchange rate at time t-1
£)Jt:difference in the continuously compounded inflation rate or; D lf may be expressed as follows:
D It = Pt Pt* Pt-i Pt-i^
Moreover, they add that the differences between the change in spot rate and the inter-country inflation differential should be uncorrelated over time. In the sense that, current period’s deviation from P P P should not be affected from the
®see Fatemi (1985)
previous periods’ deviations.
2.2. C O N C E P T U A L B A C K G R O U N D B E H IN D P P P
Many assumptions are made in the theory of PPP. These assumptions lead to the deviations from PPP. The simplicity and the practical usefulness of the the- orj’^,however, are not invalidated by these assumptions.
2.2.1. Law o f O ne-Price
This law states that the domestic price of a certain commodity must be equal to its price in the foreign market, when the current exchange rate is used to con vert the domestic currency to the foreign currency. Law of one price is a necessary condition for the absolute PPP; but it is not sufficient by itself.®
When considering the spatial arbitrage process one may assume that this law is reliable. If there exists differences in the real prices of a commodity in two countries, then the traders will purchase that commodity in the cheaper market and will sell it in the more expensive one. This naturally will lead to an increased demand in the low-price mai’ket and a more supply in the high-price market. Con sequently, this procès will increase the price of that commodity in the cheaper market while decreasing its price in the other one. This arbitrage mechanism will continue until the prices are equalized in both markets.
On the other hand, this process does not seem to be so smooth when thinking of the factors such as non-tradable goods and barriers to trade.
2.2.2. Barriers to Tï’ade
This issue leads to trade restrictions through the use of tariffs, quotas, export controls, exchange controls, etc. Transportation costs, as the means of hindrance to perfect arbitrage, may also be considered as a barrier to trade. In that sense, the consequences of the above restrictions will lead to deviations from P P P by increasing the real prices of foreign goods^. This issue may be included in the
®see Vinals (1983)
®spatial arbitrage is the economic mechanism behind the price adjustment process of goods i different markets
^see Balassa (1973)
computation of the exchange rates from the view of absolute and relative ap proaches: Ei = Pi Pt*{l + k) and; dEt _ dPt dPt^ d(l -f- k) Et ~ Pt p ; ~ {1 + k)
where ”k” represents money cost of transportation or trade barriers per a unit of a commodity.
It should be noted that, the significance of the trade barrier issue becomes vi tal when the restriction policies (or the transportation costs) of the two countries hugely vary between them. If it is the case of similiar restrictions between the two markets, this issue will have no impact on the calculations. Nevertheless, the difficulty in computing the restriction term ”k” makes it quite a bit challenge to apply this approach.®
W ithin that view, Aizenman^ expresses that the presence of transportation costs introduces a framework which will tend to reject the P P P hj'^pothesis even if goods markets are well arbitraged^®.
Finally, it is not a sufficient solution by itself to include effect of trade barriers in the computations for the sake of ceasing deviations from PPP. Use of certain price indices containing non-tradable goods exists as a source of erroneous results as well.
®price indices used with PPP contains bundle of goods which have various means of trade barriers
®see Aizenman (1986)
2.2.3. Tradable G oods vs. N ontradable goods
It can be concluded th at commodit}'· arbitrage equalizes the prices of tradable goods. The calculations niaj'^ also be finetuned by including the trade barrier ef fects. But, the use of an index containing only the traded goods will not represent the real price levels of the countries. Keynes criticised W. Churchill that he had overvalued the pound because he took into account onl}'· the tradables while de termining the exchange rates after the first World War” .
At this point a dilemma emerges with respect to the consideration of traded and nontraded goods. Nontradables are claimed to be irrele\’ant for exchange rate de terminations since they do not enter international arbitrage. On the other hand, the price levels that are being used with the P P P theory are the general price indexes^^, they contain nontradables as well. Nevertheless, this practice is claimed to be reasonable since such general price indexes express the real value of the cur rency in terms of goods and services th at it can acquire. But such an approach leads to deviations from P P P simply because it undermines the basic assumption of the theory (i.e. law of one price).
The major reason for the deviations with respect to this issue, is the differen tiated ratios between tradables and nontradables in the price indexes of various countries. A shift in those ratios tends to cause shifts in the deviations as well. Bela Balassa points out th at poorer countries can be expected to have a ratio of prices of nontraded goods to prices of traded goods lower than richer countries^^. He reasons that issue with respect to the low productivity and low wage levels of poorer countries. In th at sense, the consumption bundles of less developed coun tries contain more labor intensive goods since the consumers in those countries substitude towards goods th at are relatively cheap in their markets.
2.2.4. V ariations in Price In dexes
The difference in the consumption basket across countries implies that changes in relative prices will result deviations from PPP^^. W ithin the content of the
pre-” see Krueger (1983) ” i.e. CPI, WPI ^quoted from Greiines ” see Aizenman (1964)
vious section, it is natural to have different consumption bundles with different weights in the ¡Drice level indexes due to the economical structure of countries. In th at sense, the relevancy of indexes becomes debatable.
Questions pertaining to what is an appropriate sample and the relative weights th at should be allocated to each commodity in the sample are open to many argu ments: ’’Should the sample represent all goods and services or only those which are traded?”; ’’Should the weights given to each item be those of importing country, the exporting country, or a third country?”^®.
In practice, several types of price indexes are being used within the P P P ap proach: i.e. consumer price index, wholesale price index, cost of living index, GDP deflator, export prices, etc. Consequently, different results are being ob tained when using various standart price indexes. Studies show that some of those price indexes favor the P P P approacli while others create larger deviations^®. For example, if W PI is being used, then the P P P theory holds better since it contain traded goods heavily^’^.
2.2.5. Sticky P rices
The deviations from P P P are partly caused by the different patterns of behav ior in goods and assets markets^®. Sticky prices, which do not instantaneously react to the economic disturbances, are claimed to be permanent in a world of uncertainity and adjustment cost. The exchange rates are said to incorporate new information arid adjust to the new conditions more rapidly than the commodity prices. This naturallj’^ results with different type of variations in those two series’® which leads to deviations from PPP.
2.2.6. M oney Shocks
A monetary disturbance whiclr affects production, consumption and the trade bal- ance,tends to create deviations from P P P through changes in the terms of trade. Also, such a disturbance may induce P P P deviations due to the different patterns
^^quoted from Rodrigues and Carter ^®see Davutyan and Pippenger (1985)
^^see Rush and Rusted (1984) and Fatemi (1985) iSsee Daniel (1986)
of goods and assets markets as it is in the case of sticky prices.
A detailed investigation of this issue has been handled by He identifies the effects of money shocks as being anticipated and unanticipated. From his point of view, unanticipated money shocks cause deviations from PP P because residents do not have full current information about the nature of underlying disturbances affecting the economy; therefore they may confuse monetery with real shocks in the observed price signals. On the other hand, anticipated monej'· shocks lead to departures from P P P since the disturbance is not a surprise for the residents and thus will not alter relative prices.
2.2.7. C apital M ovem ents
The theory of P P P ignores the consequences of international capital movements which are unrelated to inflation. The case of Switzerland^^ where the banks are at tractive for the investors who need to keep secret accounts explains this issue quite well. Appreciation of Swiss frzinc eind the depreciation of other currencies cannot be stated in terms of relative inflation rates; i.e., the relative annual differences between the GNP deflators of USA and Switzerland is 3.9 in favor of Switzerland, whereas Swiss franc appreciated against US$ by 11.3% annually (between 1973 and 1979).Moreover, this issue becomes really important because the size of capi tal flows is much larger than trade flows nowadays.
2.2.8. M iscellaneous
There exists several other factors that may cause deviations from PPP. Tech nological aspects (i.e. innovations from Japan), discoveries of natural resources (i.e. British oil in the North Sea), changes in the market structure (i.e. changes in the consumers’ tastes), or speculations in the foreign exchange markets will result with the changes in the exchange rates although they are unrelated to inflation. 2.2.9. P itfalls in A pplication o f P P P
Aj)art from the previously explained issues leading to deviations from PPP, there are also methodological constraints within the testing process that may cause er- ronous results. The problems related to the price indexes has been brought up
2°see Koh (1984)
^Hhis example is given by R.J.Gordon
in section 2.2.4.; the remaining application hindrances due to the base period and
comparision country will be discussed under this topic.
2.2.9.1. B ase P eriod
While testing the relevancy of the relative PPP, the base period should be chosen as the year when the absolute P P P holds for the determination of the exchange rates. Otherwise, changes in the exchange rates may reflect the relative changes of the price levels, although the result does not give the equilibrium exchange rate with respect to the ratio of price indexes.
2.2.9.2. C oniparision C ountry
The choice of the country which is to be compared with the given country, may affect the P P P test results either favorably or unfavorably. The empirical studies indicate th at compared countries with similiar economic policies and regulations, and with strong trade links favor the P P P approach. If it is the case of applying the P P P approach for a broad group of countries, the practice of taking USA as the reference country seems reasonable since United States is the most common market in terms of economic relations and trade.
2.3. A P R E V IO U S A P P L IC A T IO N FO R T H E T U R K ISH CASE The most recent detailed study in testing the P P P for Turkey, has been done by Zeynep Onder'^^. Hereby, a broad explanation of her study and findings will be discussed, in order to give the reader a chance of comparision between our ap proach and hers.
Önder applies the three versions of PPP^3 both for the official and black-market exchange rates.Tests are processed by comparing Turkey with USA and West Ger many seperately. The time period covered in her study is between January,1981 and November,1986. Because of similiar concerns about the black-market exchange rates of our study, she also mentions the need of testing the black-market rates in two different time intervals of 1981-1983 and 1985-1986. On the other hand, she tests the official rates between 1981-1986.
22see Önder (1987)
^^i.e.- absolute, relative, and efficient markets versions
She obtaines the ofRcial and black-market rates (after July, 1985) from Diinj'^a Newspaper and the Official Gazette of Turkey. Those are of end-of-monih rates rather than monthly averages. For the black-market rates between 1981-1983, she uses Pick’s Currency Yearbook. At this stage, it should be noted th at she takes Turkey I§ Bank’s rates applied on banknotes as the black-market rates for the first six months of 1985. Use of those banknote rates may lead to erronous results since they are not reliable substitudes for the black-market rates^^.
While deriving the inflation rates for Turkey, she uses W PI and CPI data of the State Institude of Statistics.For those of USA and West Germany, her source is International Financial Statistics.
Due to her results, she concludes that the determination of official and black- market exchange rates are not validated both with the absolute and relative ap proaches of PPP. On the other hand, she mentiones th at the black-market rates support the efficient markets version of PPP. Consequently, it is asserted that current spot exchcinge rate contains all information necessary to predict the next m onth’s spot exchange rate adjusted for the anticipated inflation. But this issue does not come out to be relevant when considering the official exchange rates.
^"^see Onder (1987); pp.9
3. EM PIRICAL STU DY
In this part of the paper the relative version of P P P is being tested for the Turk ish case between the years 1980 and 1987. W ithin the process W PI and CPI are taken into account for the inflation rates; as the exchange rates, both official and black-market rates are considered^®.The comparision country, used for the test, is USA since it is one of the main trading partners of Turkey.
3.1. H Y P O T H E S IS
The testing hypothesis is related to the relative version of PPP. The relative ap proach argues th at the difference in the price levels of two countries are to be offset by the same percentage change of the exchange rates between those two currencies^®. Previously explained relationship is to be recast in the following form, and a regression anal3'’sis is to be implemented:
j/i = a' -f S(T) -f 0(xt) +
where;
y: rate of change in the exchange rate between the two currencies x: inflation differential of the two countries
T: trend e: error term t: current period
According to the hj’’pothesis a and 6 should not be significantly different from zero, whereas /? should not be significantly different from unity^'. In that sense, PP P approach may be claimed relevant by getting a relationship such as:
yt = Xt
^®selection of the variables and the time period will be rerisoned later in the chapter ^®see section 2.1.2. for detail
^^significance will be discussed with respect to the t-Statistics test
This above relation states that, change in the inflation dilferentials between the two countries is equal to the change in the exxhange rate of the two currencies. Trend term ”T ” is included in the calculations for the first five tests. There after, the hypothesis are examined in the following form:
j/t = Q' -f- j3{xt) + et
The above mentioned properties of the coefficients are usefull in this version as well. Throughout the tests, the lag structures will be explored as well. In order to And how long it takes the exchange rates to adjust the differential inflation, the equation will be modified in the following form:
?/i = O' + P{xt-i) + et
i.e.-up in the above formula, differential inflation rates before months are being regressed against today’s exchange rates.
3.2. DATA
Gathering and the quality of data^® are being explained below. 3.2.1. Exchange R ates
Official and black-mai’ket exchange rates (TL/$) are used with the P P P approacli. Consequently, both rates are being tested seperately for the hypothesis.
3.2.1.1. Official E xchange R ates
Official rates are retrieved from the Turkish Central Bank’s monthly bulletins^®. Since the P P P is tested on the monthly-base, the official exchange rates are the monthlj^-averages. At this point, one may argue against the relevancy of the offi cial rates for the PPP. Such an argument is to be supported when considering the dirty floating-rates mechanism in Turkey since 1980.
*®i.e. WPI,CPI,Exchange rates
*®see Montlily Statistical and Evaluation Bulletin (May-June 1988); T.C. Merkez Bankasi
The daily exchange rates announced by the Central Bank, follow the government’s real exchange rate policy for the given period, and utilizing P P P principles^®. The economic policy of the government dictates the periodic (annual, semiannual) real change in the rate of exchange between the TL and a basket of currencies. This information is not publicly announced. The Central Bank takes this policy de cision and then maJces a monthly forecast for the inflation differential between Turkey and the countries whose currencies are in the fixed basket. The sum of the inflation differential and the real change is divided bj'^ the number of working days in the month; and the daily change in the TL/currency basket exchange rate is found. To determine exchange rates for the individual currencies, cross rates between basket currencies are obtained from European markets^h
3 .2 .1 .2 . Black-M arket Exchange R ates
After June,1985, black-market rates are being announced daily in the newspa pers. In th at sense, data is a^failable and reliable ®^.This point is to be supported since the black-market starts to work in a more legal mechanism after 1985^^. There emerges problem in collecting the black-market data before 1985. The only available source is P ick’s Currency Yearbook] and that source is found in O nier’s MBA thesis in METU®“* and adopted for this paper. But, the rates for 1980,1984, and 1985 do not exist whereas they are not available in Turkey or abroad^®. At that stage, it has been tried to estimate the black-market rates from the gold prices^®, but the results were not consistent. Interpolating the data for the missing years has been ignored since the use of artificial data is to result with irrelevancy. W ith respect to the above considerations, it has been decided to test the PP P approach, with the black-market rates, in two different time intervals of 1981-1984
®°as of August 1, 1988 this procedure has changed
®Hhis paragraph is quoted from Akgiray, Aydogan, Booth (1988)
“^black-market rates, used in this paper, are collected from the daily issues of Hürriyet newspa per; and their monthly averages are taken
^^that conclusion sounds concrete when comparing the behaviour of the black-market before and after 1985 (it will be discussed later in this section)
^^see Önder (1987)
^®Önder mentiones this as well
^®it has been mentioned that Tahtakale (black-market in Istanbul,Turkey) rates are determined by dividing the gold price in Turkey to the ones in the London (or Zurich) market
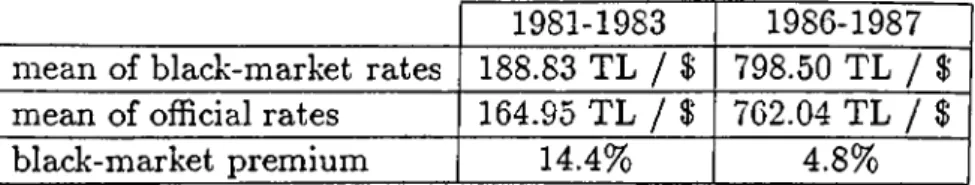
1981-1983 1986-1987 mean of black-market rates 188.83 TL / $ 798.50 TL / $ mean of oiRcial rates 164.95 TL / $ 762.04 TL / $
black-market premium 14.4% 4.8%
Table 1: Comparision of the Exchange-Rate Behaviors
and 1986-1987. Such a decision is also supported by accounting the different na tures of black-market exchange rates in those two different time intervals. This may be attributable either to change in the black-market premiums and/or to the differences in exchange rate policies after 1985. Önder expresses this situation very clearly by graphically emphasizing higher differences between the black-market and official rates before 1985 with respect to the ones after 1985. Similiar to her point, such a conclusion is reached by simply calculating the mean ratios between those two series in the two time intervals (see Table 1).^^
3.2.2. Inflation R ates
While deriving the inflation rates for Turkey, wholesale and consumer price indexes^® are used seperataly; and US producer price index^^ is taken for comparision. As it is mentioned previously, the empirical study is to be processed for both price indexes'*® in the sense of answering to which index performs better with PPP^L At this stage, it should be noted that price indexes calculated by the State Insti tute of Statistics (SIS) may be critisized as not being reliable for testing the PPP. The basket constructed in 1979, but not modified with respect to the possible changes in the consumers’ preferences, may lead to erronpus results. It is asserted th at there is a plus or minus 10% error range of the SIS indexes^^.Nev'ertheless, the other option of using Istanbul Chamber of Commerce (ICC) index is to be
ig-^’^it is concluded that black-market rate premiums are much higher (with respect to their means in the two intervals) between 1981-1983 compared to the ones between 1986-1987; black-market premiums are calculated by dividing the difference between the two rates to the official rate
^*source: State Institute of Statistics ^^source: Citibank data
'>°i.e. W Pl and CPI
^*it is argued that WPI holds better (see section 2.3.4. for detail) ■*^see Güvenen (1989)
nored since it is valid only for Istanbul and the index basket has been constructed in 1963. Within such a frame, it must be denied that the appropriateness of the P P P testing, is confined with the relevancy of the data used in the process.
3.2.3. T im e P eriod
The time period covered in the testing process is between January 1980, and December 1987. By the launch of the liberalization policies in January 2^,1980 , a new era has started in the economic life of Turkey. The liberalization and stabilization rules, implemented on a continious manner, provide a consistent base to adopt studies such as this one. Consequently, including the earlier years is to demolish the P P P testing, because of concrete differences between the policies used before and after 1980.
3.3. T E ST S A N D TH E RESU LTS
The testing results are to be evaluated by analyzing the relevance of the hypothesis'*^. During this process the following steps eire considered“*“*:
• Coefficient of the inflation differentials,”/?,·”, should not be significantly dif ferent from unity, whereas the others are not to be significantly different from zero.
t ”t-Statistics” for significance is to test ”/d,”s are equal to unity (i.e.-iio· A =
1), and ”a ” and ”^” are equal to zero (i.e.-Ho‘· a = 6 = 0). The critical
”t ” values at 95% level for certain degrees of freedom (d.f.) are given in the tables.
• The correlation c o e f f i c i e n t , s h o u l d be assesed in terms of linear rela tionship between the two series.
• ’’Durbin-Watson” statistic (D.W.) should be between 1.5 and 2.5, in order not to suspect positive or negative serial correlation between the residuals which maj'· bias the estimates of standart errors, and consequently the hy pothesis testing.
■^^see section 3.1. for detail
^“*results of the tests are available in the APPENDIX
Within the above framework, evaluation of the results are summarized below.To start with, it should be expressed that all the tests satify the Durbin-Watson con dition.
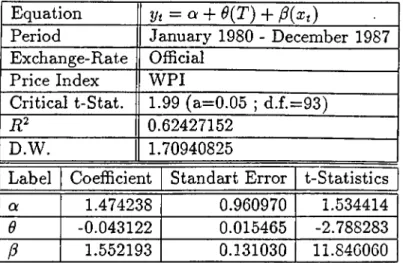
T est 1 & 2: Turkish inflation rates derived from W PI and CPI are taken into account at Test 1 and Test 2 respectively. At both tests, inflation diiferential coefficients,”^ ”, are significant and greater than unity.”^” coefficients of trend are not significantly different from zero, whereas ’’« ’’s are insignificant. It can be con cluded th at PP P does not hold for determining the official exchange rates by using W PI and CPI; i.e.- a 10% differential in inflation, results in 15% depreciation of Turkish Lira (TL), rather than 10%. W ith respect to the relevance comparision of W PI and CPI, it can be stated th at W PI holds better although there occurs no huge differences between the results of the two indexes^®.
T est 3: A lag of one month is analyzed for the official rates between 1980 and 1987'*®. The hypothesis is rejected since all the coefficients are significantly differ ent from their hypothesized values.
T est 4: Due to previously explained change in the behavior of exchange rates'*^, the hypothesis is tested between 1980-1984 for the official rates. ”ii^” is close to one, whereas " jS" is significantly larger than unity.The remaining coefficients are insignificant. This result suggests that P P P hypothesis does not hold for this test; i.e.- a 10% differential in inflation is to cause 17.5% depreciation of TL.
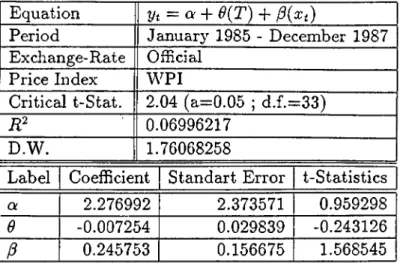
T est 5: Same above process is held between 1985-1987 for the official rates. All the coefficients are insignificant and there occurs no linear correlation between the two series. This leads to the analysis of the lag structure in the coming tests. T est 6 &: 7: In both tests, there appears a lag of two months in the adjustment of exchange rates to observed inflation differentials; i.e.- only ”/^2” is significant but less than unity. On the other hand, is relatively low. Finally, it may be stated th at PP P does not hold; i.e.- a 10% differential in inflation is to result in 6% of depreciation of TL after two months.
T est 8 i z 9 i z l 0 & ; l l : According to the issues mentioned about the black-'^^Turkish inflation rates derived from WPI will be used for the remaining tests.
^®change in the exchange rates at time ”i ” is regressed with the inflation rates at time ■’^see section 3.2.1.2. for detail
1” .
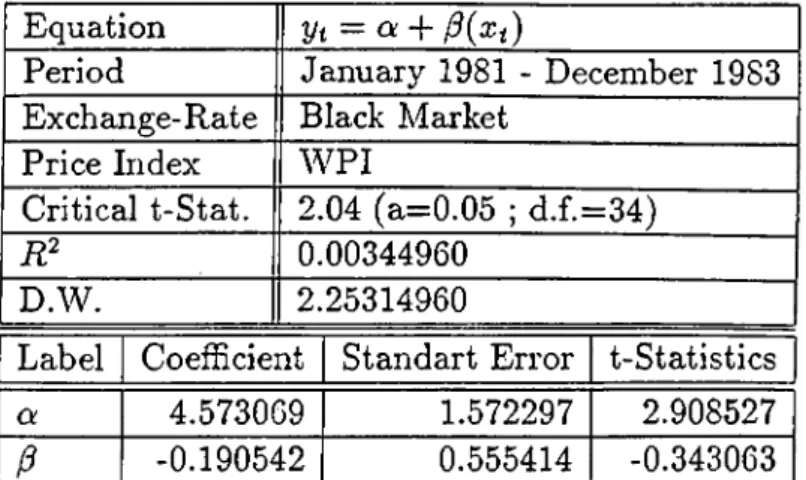
market exchange rates'^®, the hypothesis is tested for the time periods between 1981-1983 and 1986-1987.’’Test 8” analyses the relevance of PP P for the black- market rates between 1981-1983. The coefficient states that there is no correlation between the two series. ”a ” coefficient is significantlj^ different than zero, whereas ”;i9” is insignificant. Consequently, lags up to six months are ana lyzed in tests 9 to 11. But, the outcomes are not supporting the PP P again: No linear correlation between the series; ”^ ,”s are not significant; ”q”s are signifi
cantly different from zero.
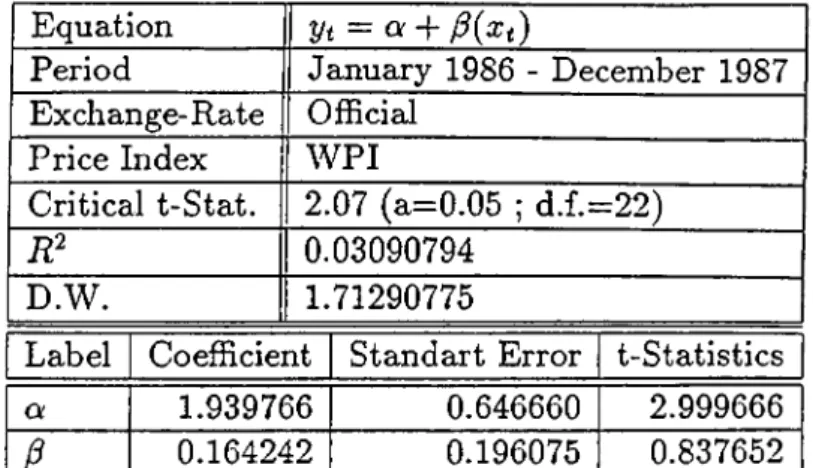
Test 12: Before testing the hypothesis for black-market rates between 1986-1987, the official rates are again tested, but for this issue of time interval®. The purpose of such an approach is to compare official and black market rates in the same time interval. The results of this test do not support the hypothesis.
Test 13: Testing results of black-market rates between 1986-1987, reject the hypothesis: ”¿5” is not significant; ’’a ” is significantly different from zero; no linear correlation between the two series.
Test 1 4 i z l 5 & : 1 6 & : 1 7 : Lags up to four months are anal3'^zed for official rates between 1986-1987. Outcomes of the tests 14 &: 16 & 17, do not support the hj'pothesis at all. On the other hand, the results in Test 15 state a lag of two months similiar to the Test 6 of 1985-1987. Moreover, it may be concluded that P P P holds in Test 15, since ’’/S2” is significantly equal to unity (i.e.- ^2 = 0.834)®° and ”a ” is not significant.
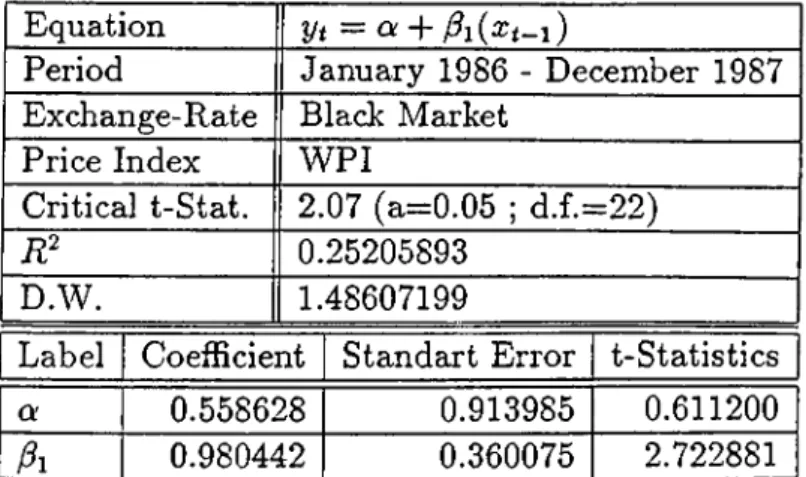
Test 18 19 &: 20 & 21: Similiar to the above process, black-market rates ,be-tween 1986-1987, are tested with lags up to four months. Results of the tests 19 to 21 reject the hji^pothesis. Although there occurs a low correlation (i.e.-R^ = 0.252), Test 18 favors the P P P by expresing a lag of one month: coefficient is signif icantly equal to unity (i.e.- ¡3i = 0.98); ’’a ” is not significant.
^®see section 3.2.1.2. for detail
‘*®the previous results for official rates were for the years between 1985-1987, and the outcomes stated a lag of two months in the adjustment of exchange rates to inflation differentials (see tests 5 to 7 for detail)
^°standart error, equal to 0.283, leads us to accept the ”/?2” coefficient between 1.283 and 0.717
4. C O N C L U SIO N
The aim of this paper is to test the relative approacli of P P P for the Turkish case. This approacli states that the exchange rate changes between the two cur rencies are directly affected by the change in the inflation differentials betAveen the countries of issue. At this stage, it must be expressed that one should keep in mind all the theoretical and empirical constraints when assesing these results. Since specifically reasoning the failures is bej'^ond the scope of this paper, those are left for further studies.
P P P approacli has been implemented both for the official and black-market ex change rates. The time period covered in this paper, is between January,19S0 and December,1987 for the official rates. On the other hand, black-market exchange rate sources, which are not available, led us to consider two different time inter vals of 1981-1983 and 1986-1987. United States has been taken as the comparision country since it is the main partner of Turkey in trade and economical relations. While deriving the inflation rates, W PI has been used since it is proved to be more appropriate for P P P theory. But in the studj^, CPI is also taken into account with the official rates testings, in order to make a comparision due to the relevance of the two indexes. The results with respect to this issue did not reflect absolute dif ferences between the use of either indexes. However, the outcomes slightly favored the use of W PI rather than CPI.
Testing findings (in tests 1 to 3) of the official rates between 1980-1987, both with W PI and CPI, reject the hypothesis. But, significant coefficient gives an idea about the relationship between the exchange rates and inflation differentials. It states that TL is underA'alued; in other words, depreciation of TL is above the level of real inflation rates. Within the same framework, the next analysis ex pressed that there is no lag structure, meaning th at exchange rates do not adjust to previous period’s inflation differential.
The further tests aimed to analyze the determination of official exchange rates between 1980-1984 and 1985-1987 seperately (in tests 4 to 8). Although the hy pothesis was again rejected, the significant outcomes asserted a more under\Tilua- tion of TL between 1980-1984 than it is between 1980-1987. This real depreciation of Turkish Lira may be attributable to the governmental policies trying to stim ulate the exports untill 1985. On the other hand, a lag of two months is seen
between 1985-1987, whereas an overvaluation of TL emerged. This result was again obtained while applying the hypothesis for the time period of 1986-1987 (in tests 14 to 17). But, hereby it is concluded that P P P holds ,since the ”/92” coefficient was significant between the limits of acceptance.
As it is mentioned previous!}', the black-market rates determination within the P P P hypothesis is tested in two seperate time intervals due to data availabil ity. The first one, between 1981-1983, neither supported the hyj^othesis nor gave satisfactory results to explain the determination of black-market exchange rates, although lags up to six months have been analyzed (in tests 8 to 11). The sec ond approach, between 1986-1987, supported the validity of P P P (in tests 18 to 21).The outcomes asserted that there is a one-month lag in the adjustment of black-market exchange rates to the inflation differentials.
To sum up the above evaluation, it may be concluded that, there is an under valuation and overvaluation of TL before and after 1985 respectively. The case after 1986 supports the relevance of the theory both with the tests of official rates and black-market rates. It may be stated th at black-markets perfectly adjust to the changes in the inflation differentials in one month. The lag of two months, which existed with the tests of official rates, can be interpreted such as The Cen tral Bank of Turkey considers the black-market rates while determining the official ones.
A P P E N D IX
Equation yt = ot + S{T) + /3(xt)
Period January 1980 - December 1987
Exchange-Rate Official
Price Index W PI
Critical t-Stat. 1.99 (a=0.05 ; d.f.=93)
B? 0.62427152
D.W. 1.70940825
Label Coefficient Standart Error t-Statistics
a 1.474238 0.960970 1.534414
d -0.043122 0.015465 -2.788283
P 1.552193 0.131030 11.846060
Table 2: TEST 1
Equation yt = a + 0{T) + ^(xt)
Period January 1980 - December 1987
Exchange-Rate Official
Price Index CPI
Critical t-Stat. 1.99 (a=0.05 ; d.f.=93)
B? 0.45254498
D.W. 1.76046123
Label Coefficient Standaxt Error t-Statistics
a 1.965437 1.179180 1.666783
e -0.056826 0.018606 -3.054109
1.571075 0.191740 8.193782
T able 3: T E S T 2
Equation yt = Oi + ^{T)
-t-Period January 1980 - December 1987
Exchange- Rate Official
Price Index W PI
Critical t-Stat. 1.99 (a=0.05 ; d.f.=93)
B? 0.00615204
D.W. 1.67865124
Label Coefficient Standart Error t-Statistics
a 0.453145 1.195908 0.378913
e -0.002396 0.018815 -0.127363
-0.120556 0.158891 -0.758736
Table 4: TEST 3
Equation yt = a + 6{T) + ^{xt)
Period January 1980 - December 1984
Exchange-Rate Official
Price Index W PI
Critical t-Stat. 2.00 (a=0.05 ; d.f.=57)
B? 0.70155864
D.W. 1.79154641
Label Coefficient Siandart Error t-Statistics
a 1.386323 1.339893 1.034652
e -0.063386 0.034770 -1.823012
/3 1.751221 0.156865 11.163850
T ab le 5: T E S T 4
Equation y^=z a-\- 9(T) -f ^(xt)
Period January 1985 - December 1987
Exchange-Rate Official
Price Index W PI
Critical t-Stat. 2.04 (a=0.05 ; d.f.=33)
B? 0.06996217
D.W. 1.76068258
Label Coefficient Standart Error t-Statistics
a 2.276992 2.373571 0.959298
9 -0.007254 0.029839 -0.243126
/? 0.245753 0.156675 1.568545
Table 6: TEST 5
Equation yt = Q + + p2{^t-2)
Period January 1985 - December 1987
Exchange-Rate Official
Price Index WPI
Critical t-Stat. 2.04 (a=0.05 ; d.f.=33)
R2 0.32043664
D.W. 1.89450537
Label Coefficient Standart Error T-Statistics
a 2.276992 2.373571 0.959298
A 0.287890 0.186240 1.545798
02 0.574083 0.184984 3.103410
T able 7: T E S T 6
E q u a tio n Vt = Oi + ) + ···· +
Period January 1985 - December 1987
Exchange-Rate Official
Price Index W PI
Critical t-Stat. 2.04 (a=0.05 ; d.f.=31) 0.35126592
D.W. 1.90028529
Label Coefficient Standart Error t-Statistics
a 0.678273 0.764241 0.887511 0.306467 0.191549 1.599940 0.630484 0.193566 3.257200 -0.224852 0.194966 -1.153287 04 -0.012145 0.191906 -0.063289 Table 8: TEST 7 26
Equation yt = a + /S(xi)
Period January 1981 - December 1983
Exchange-Rate Black Alarket
Price Index W PI
Critical t-Stat. 2.04 (a=0.05 ; d.f.=34)
B? 0.00344960
D.W. 2.25314960
Label Coefficient Standart Error t-Statistics
a 4.573069 1.572297 2.908527
/3 -0.190542 0.555414 -0.343063
Table 9: TEST 8
Equation yt = OC + -f ^2{Xt-2)
Period January 1981 - December 1983
Exchange- Rate Black Market
Price Index W PI
Critical t-Stat. 2.04 (a=0.05 ; d.f.=33)
B? 0.01060971
D.W. 2.28627014
Label Coefficient Standart Error t-Statistics
a 5.094415 1.898272 2.683711
/?! -0.200394 0.572121 -0.350266
/?2 -0.265241 0.579780 -0.457485
T able 10: T E S T 9
E q u a tio n j/t — Q.' + + ···· + ^ 4 { X t - A )
Period January 1981 - December 1983
Exchange-Rate Black Market
Price Index W PI
Critical t-Stat. 2.04 (a=0.05 ; d.f.=31) 0.05247203
D.W. 2.32586123
Label Coefficient Standart Error t-Statistics
a 4.749446 2.662149 1.784061 Pi -0.130576 0.591591 -0.220719 P2 -0.392097 0.597922 -0.655765 /^3 0.593489 0.568707 1.043576 Pa -0.363481 0.567016 -0.641042 Table 11: TEST 10 Equation -f .... -f Pe(xt-6)
Period January 1981 - December 1983
Exchange-Rate Black Market
Price Index W PI
Critical t-Stat. 2.04 (a=0.05 ; d.f.=29) 0.16329564
D.W. 2.48708697
Label Coefficient Standart Error t“Statistics
Oi 8.692969 3.549303 2.449204 Pi -0.326102 0.592434 -0.550445 i^2 -0.540183 0.587238 -0.919870 /?3 0.286288 0.579032 0.494426 Pa -0.354176 0.572670 -0.618465 /?5 -1.005947 0.554649 -1.813663 Pe -0.327637 0.556531 -0.588712 Table 12: TEST 11 28
Equation yt = a - f
Period January 1986 - December 1987
Exchange- Rate Official
Price Index W PI
Critical t-Stat. 2.07 (a=0.05 ; d.f.=22) 0.03090794
D.W. 1.71290775
Label Coefficient Standart Error t-Statistics
a 1.939766 0.646660 2.999666
0.164242 0.196075 0.837652
Table 13: TEST 12
Equation yt = Oi + ^{xt)
Period January 1986 - December 1987
Exchange- Rate Black Market
Price Index W PI
Critical t-Stat. 2.07 (a=0.05 ; d.f.=22)
B? 0.05556850
D.W. 1.51271781
Label Coefficient Standart Error t-Statistics
a 2.033910 0.794749 2.559184
0.274168 0.240977 1.137733
T able 14: T E S T 13
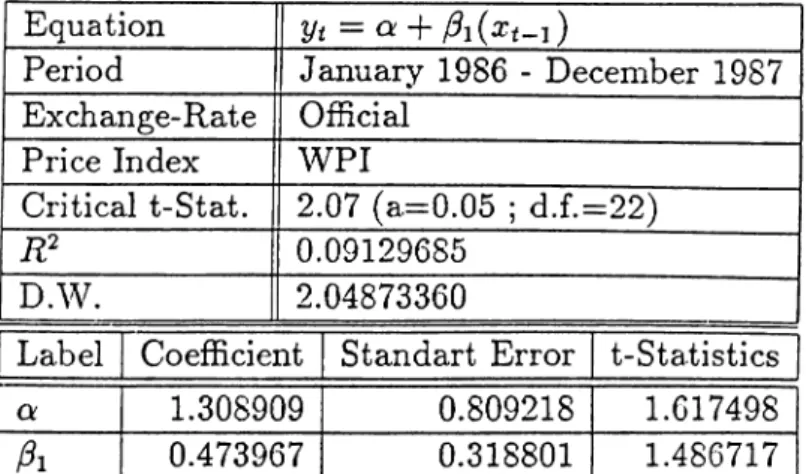
Table 15: TEST 14
Equation yt = a + /?2(Xi-2)
Period January 1986 - December 1987
Exchange-Rate Official
Price Index W PI
Critical t-Stat. 2.07 (a=0.05 ; d.f.=22)
R2 0.28310122
D.W. 1.80405217
Label Coefficient Standart Error t-Statistics
a 0.503780 0.718926 0.700740
0.834408 0.283090 2.947497
T able 16: T E S T 15
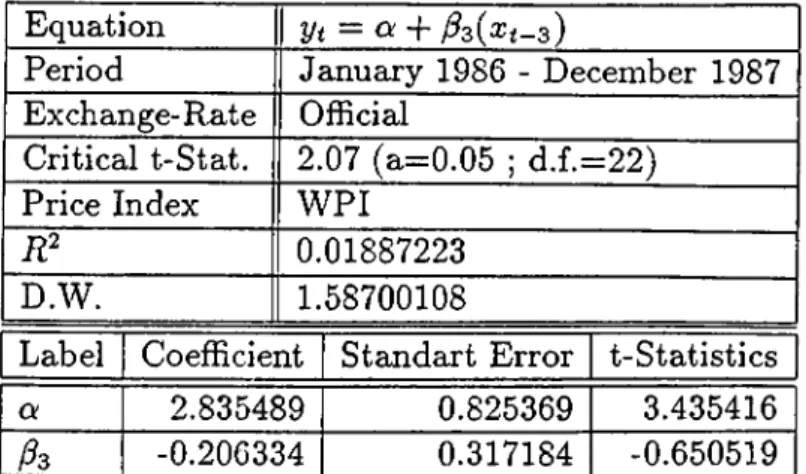
Equation y^ = a + Pz{xt-z)
Period January 1986 - December 1987
Exchange-Rate Official
Critical t-Stat. 2.07 (a=0.05 ; d.f.=22)
Price Index WPI
B? 0.01887223
D.W. 1.58700108
Label Coefficient Standart Error t-Statistics
Of 2.835489 0.825369 3.435416
/^3 -0.206334 0.317184 -0.650519
Table 17: TEST 16
Equation yt =
Oi-\-Period January 1986 - December 1987
Exchange-Rate Official
Price Index WPI
Critical t-Stat. 2.07 (a=0.05 ; d.f.=22)
B? 0.04703652
D.W. 1.61031042
Label Coefficient Standart Error t-Statistics
a 3.113979 0.819255 3.800985
/54 -0.326400 0.313227 -1.042055
T able 18: T E S T 17
Equation yt = a +
Period January 1986 - December 1987
Exchange-Rat e Black Market
Price Index WPI
Critical t-Stat. 2.07 (a=0.05 ; d.f.=22)
n? 0.25205893
D.W. 1.48607199
Label Coefficient Standart Error t-Statistics
Oi 0.558628 0.913985 0.611200
0.980442 0.360075 2.722881
Table 19: TEST 18
Equation yt = a + ^2{xt-2)
Period January 1986 - December 1987
Exchange-Rate Black Meirket
Price Index W PI
Critical t-Stat. 2.07 (a=0.05 ; d.f.=22)
B? 0.09211083
D.W. 1.48498681
Label Coefficient Standart Error t-Statistics
a 1.423245 1.007217 1.413046
0.592535 0.396610 1.493999
T able 20: T E S T 19
Equation yt = a + ^zixt-z)
Period January 1986 - December 1987
Exchange- Rate Black Market
Price Index WPI
Critical t-Stat. 2.07 (a=0.05 ; d.f.=22)
B? 0.00143442
D.W. 1.21419072
Label Coefficient Standart Error t-Statistics
a 2.906887 1.036633 2.804161
-0.070818 0.398371 -0.177771
Table 21: TEST 20
Equation yt = a + 04{xt-4)
Period January 1986 - December 1987
Exchange-Rate Black Market
Price Index W PI
Ci’itical t-Stat. 2.07 (a=0.05 ; d.f.=22) 0.00806404
D.W. 1.22909098
Label Coefficient Standart Error t-Statistics
a 3.131271 1.040577 3.009167
04 -0.168252 0.397845 -0.4229Ö8
T able 22: T E S T 21
1980 1981 1982 1983 1984 1985 1986 1987 January 9.23 4.51 3.87 9.54 3.88 4.81 4.52 3.61 February 29.28 2.21 3.72 2.41 3.38 4.72 2.15 2.20 March 4.47 -0.76 3.33 1.57 3.27 5.35 1.18 3.52 April 3.51 -0.76 1.90 1.42 8.27 2.33 1.99 2.62 May 2.95 2.09 1.30 1.65 6.90 2.16 1.59 4.76 June 2.72 6.46 1.36 1.31 4.70 -1.27 0.97 0.45 July 0.28 0.10 1.98 1.17 -0.70 0.49 1.22 1.73 August 1.53 1.11 1.94 2.07 3.18 1.76 0.17 2.80 September 3.42 3.00 1.14 2.09 2.32 2.74 2.16 2.05 October 7.15 1.65 0.75 2.75 3.27 4.98 3.90 3.48 November 3.71 1.91 1.04 4.10 3.71 3.06 1.46 2.84 December 3.10 1.69 0.59 4.38 1.74 1.89 0.92 10.77
Table 23: MONTHLY INFLATION RATES IN TURKEY
1i
all figures are to be read in percent(%)
inflation rates are derived from W PI (source SIS)
1980 1981 1982 1983 1984 1985 1986 1987 January 8.05 3.96 2.08 4.20 3.45 5.57 3.20 2.94 February 22.11 4.02 2.28 2.52 1.53 3.30 1.74 2.70 March 8.37 0.94 2.28 2.03 3.10 4.78 1.30 3.74 April 6.56 1.29 0.95 1.47 6.23 0.83 0.38 2.09 May 7.86 1.87 0.30 0.67 4.85 2.40 1.90 4.93 June 1.78 2.02 1.69 1.32 6.49 -0.76 2.39 -0.10 July 1.91 4.37 1.02 1.04 0.92 1.42 1.87 1.91 August 0.04 0.03 1.35 2.34 2.49 2.59 0.87 1.71 September 3.78 3.51 3.11 3.23 2.07 4.75 2.39 2.92 October 4.02 1.02 2.71 5.31 4.36 6.26 7.25 4.80 November 1.81 1.09 2.32 3.74 3.85 4.64 2.28 6.25 December 1.17 1.19 3.50 4.20 1.86 1.61 1.64 11.20
Table 24: MONTHLY INFLATION RATES IN TURKEY
§ all figures are to be read in percent(%)
^ inflation rates are derived from CPI (source SIS)
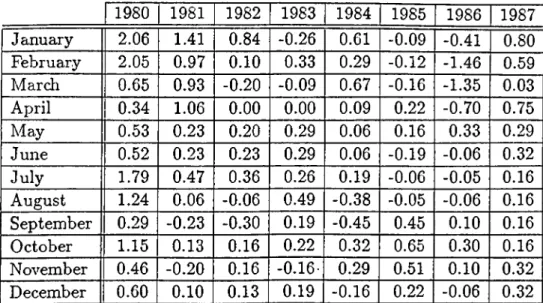
1980 1981 1982 1983 1984 1985 1986 1987 January 2.06 1.41 0.84 -0.26 0.61 -0.09 -0.41 0.80 February 2.05 0.97 0.10 0.33 0.29 -0.12 -1.46 0.59 Marcli 0.65 0.93 -0.20 -0.09 0.67 -0.16 -1.35 0.03 April 0.34 1.06 0.00 0.00 0.09 0.22 -0.70 0.75 May 0.53 0.23 0.20 0.29 0.06 0.16 0.33 0.29 June 0.52 0.23 0.23 0.29 0.06 -0.19 -0.06 0.32 July 1.79 0.47 0.36 0.26 0.19 -0.06 -0.05 0.16 August 1.24 0.06 -0.06 0.49 -0.38 -0.05 -0.06 0.16 September 0.29 -0.23 -0.30 0.19 -0.45 0.45 0.10 0.16 October 1.15 0.13 0.16 0.22 0.32 0.65 0.30 0.16 November 0.46 -0.20 0.16 -0.16· 0.29 0.51 0.10 0.32 December 0.60 0.10 0.13 0.19 -0.16 0.22 -0.06 0.32
Table 25: MONTHLY INFLATION RATES IN THE U.S.A.
all figures are to be read in percent(%)
inflation rates are derived from W PI (source CITIBANK DATA)
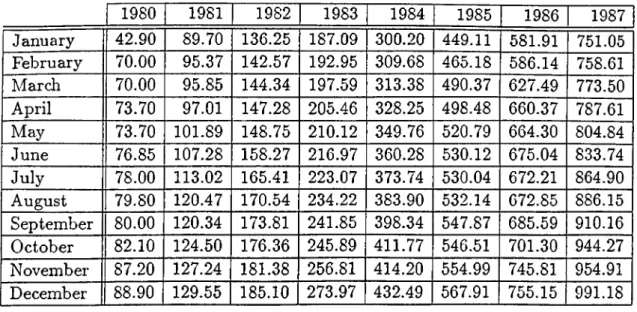
1980 1981 1982 1983 1984 1985 1986 1987 January 42.90 89.70 136.25 187.09 300.20 449.11 581.91 751.05 February 70.00 95.37 142.57 192.95 309.68 465.18 586.14 758.61 March 70.00 95.85 144.34 197.59 313.38 490.37 627.49 773.50 April 73.70 97.01 147.28 205.46 328.25 498.48 660.37 787.61 May 73.70 101.89 148.75 210.12 349.76 520.79 664.30 804.84 June 76.85 107.28 158.27 216.97 360.28 530.12 675.04 833.74 July 78.00 113.02 165.41 223.07 373.74 530.04 672.21 864.90 August 79.80 120.47 170.54 234.22 383.90 532.14 672.85 886.15 September 80.00 120.34 173.81 241.85 398.34 547.87 685.59 910.16 October 82.10 124.50 176.36 245.89 411.77 546.51 701.30 944.27 November 87.20 127.24 181.38 256.81 414.20 554.99 745.81 954.91 December 88.90 129.55 185.10 273.97 432.49 567.91 755.15 991.18
Table 26: OFFICIAL EXCHANGE RATES (TL/$)
§ all rates are monthly averages
^ source: The Central Bank of the Republic of Turkey
1981 1982 1983 1986 1987 January 102.50 160.00 217.00 604.83 787.38 February 99.75 150.00 231.00 622.55 786.91 March 95.50 165.00 239.00 662.86 785.18 April 110.00 170.00 252.00 686.83 794.78 May 115.50 172.00 259.00 696.89 814.89 June 115.50 200.00 249.00 709.35 862.56 July 121.00 185.00 247.00 705.39 881.95 August 134.00 210.00 270.00 692.29 913.41 September 158.00 190.00 269.00 712.71 964.91 October 139.00 189.00 271.00 716.85 1011.41 November 145.00 188.00 290.00 765.63 1074.86 December 159.00 215.00 315.00 775.01 1134.48
Table 27: BLACK-MARKET EXCHANGE RATES (TL/$)
§ rates after sourccT^l:
t source^2:
BIBLIO G R A PH Y
A d le r,M . an d L eh m an ,B . (1983).’’Deviations from PPP.” The Journal of Fi nance 38(5):1471-1487.
A iz e n m a n ,J . (1984).’’Modelling Deviations from PPP.” International Economic Review 25(1):175-191.
A iz e n m a n ,J . (198G).’’Testing Deviations from PP P.” Journal of International Money and Finance 5(l):25-35.
A kgiray,V . ; A y d o g a n ,K . ; B o o th ,G . (1988).”A Causel Analysis of Black and Official Exchange Rates: The Turkish Case.” Unpublished manuscript. B a la ssa,B . (1973).” Just How Misleading Are Official Exchange Rate Conversion?
A Comment.” Economic Journal 83(4):1258-1267.
B ils o n ,J.F .O . (1984).”P P P as a Trading Strategy.” Journal of Finance 39(3):715- 724.
C u lb e rts o n ,W .P .J r. (1975).”P P P and Black Market Exchange Rates.” Eco nomic Inquiry 13(2):287-296.
D a n iel,B .C . (1986).’’Optimal P P P Deviations.” International Economic Review 27(2):483-511.
D a n iel,B .C . (1986).’’Sticky Prices and PPP Deviations:Emprical Implications.” Economic Letters 20(2):187-190.
D a v u ty a n ,N . a n d P ip p e n g e r,J . (1985).”P P P Did Not Collapse During the 1970s.” American Economic Review 75(5):1151-1158.
D o rn b u sc h ,R . a n d F isch er,S . (1984).Macro-Economics. Singapore: TienWah Press Pte Ltd.
E d is o n ,H .J . (1985).”PPP: A Quantitative Reassessment of 1920s Experience.” Journal of International Money and Finance 4(3):361-372.
F a tem i,A .M . (1985).’’The Yen and The Dollar: Their Purchasing Power in Effi cient Market.” Hitotsubashi Journal of Economics 26(l):37-43.
F o rtu n e ,J .N . (1985).’’Expected P P P .” Weltwirtschaffiches Archiv 121(1):97-104. G o rd o n ,R .J . (1984).Macroeconomics. Boston: Little, Brown and Company.
G re n n e s ,T . (1984).International Economics. New Jersey: Prentice-Hall. G ü v e n e n ,O. (1989).’’Hatasız Endeks Olmaz.” Nokta 7(3):48-49.
H a k k io ,J.S . (1984).”A Re-examination of PPP: A Multi-country and Multi period Study.” Journal of International Economics 17(3-4):265-277.
H o d g so n ,J.S . an d P h e lp s,P . (1975).’’The Distributed Impact of Price Level Variaton on Floating Exchange Rates.” Review of Economics and Statistics 57(l):58-64.
H ü rriy e t N ew sp ap er. (Various issues).
J u n g e ,G . (1984).”PPP in the 1920s and the 1970s: A note.” European Economic Review 26(l-2):73-82.
K o h ,A .T . (1984).’’Money Shocks and Deviations From PPP.” Journal of Mone tary Economics 14(1): 105-122.
K oveos,P . an d S eifert,P . (1985).”PP P and Black Markets.” Financial Manage ment 14(3):40-46.
K ru e g e r,A .O . (1983).Exchange Rate Determination. London: Cambridge Uni versity Press.
M c K in n o n ,R .I. (1986).’’Monetary cind Exchange Rate Policies for International Stability: A Proposal.” Stanford Universit}^ Manuscript.
M iller,S . (1984).”P P P and Relative Price Variability: Evidence from 1970s.” European Economic Review 26(3):353-367.
M o n th ly S ta tistic a l an d E v alu atio n B u lle tin . (Various issues).Ankara: The Central Bank of The Republic of Turkey.
Ö n d e r,Z. (1987).” An Empirical Study of PPP: The Turkish Case.” Ankara: METU- MBA Thesis.
R o d rig u e s ,R .M . an d C a rte r,E .E . (1979).International Finance. New Jersey: Prentice-Hall.
R u sh ,M . an d H u ste d ,S . (1985).”PPP in the Long Run.” Canadian Journal of Economics 18(1):137-145.
S h a p iro ,A .C . (1986).Multinational Financial Management. Massachussetts: Al- lyn and Bacon,Inc.
V in a ls ,J .M . (1983)."Book rew'eiü;Officer,L.H.(1982).PPP and Exchange Rates: Theory, Evidence and Relevance. London: JAI Press.” Journal of Economic Literature 11(12):1532-1534.