Identification of relative protein bands in
Polyacrylamide Gel Electrophoresis (PAGE) using
multiresolution...
Article in BioTechniques · July 1999 DOI: 10.1109/TFSA.1998.721415 · Source: PubMed CITATIONS4
READS77
5 authors, including: Some of the authors of this publication are also working on these related projects: Theoretical Network AnalysisView project Drug Response Prediction as a Link Prediction Problem
View project Mehmet Koyutürk Case Western Reserve University 78 PUBLICATIONS 1,652 CITATIONS SEE PROFILE Rengul Cetin-Atalay Middle East Technical University 101 PUBLICATIONS 773 CITATIONS SEE PROFILE A. Enis Cetin Bilkent University 280 PUBLICATIONS 3,930 CITATIONS SEE PROFILE
All content following this page was uploaded by Rengul Cetin-Atalay on 14 December 2013.
Metin Nafi Gürcan, Mehmet Koyutürk, H.
Serkan Yildiz, Rengül Çetin-Atalay and
A. Enis Çetin
Bilkent University, Bilkent, Ankara, Turkey
ABSTRACT
In polyacrylamide gel electrophoresis (PAGE) image analysis, it is important to determine the percentage of the protein of interest of a protein mixture. This study presents reliable computer software to determine this percentage. The region of interest containing the pro-tein band is detected using the snake algorithm. The iterative snake algorithm is implemented in a multi-resolutional framework. The snake is initialized on a low-resolution image. Then, the final posi-tion of the snake at the low resoluposi-tion is used as the initial posiposi-tion in the higher-resolution image. Finally, the area of the protein is esti-mated as the area enclosed by the final position of the snake.
INTRODUCTION
Polyacrylamide gel electrophoresis (PAGE) is one of the most widely used techniques in molecular biology (1). Dena-turing sodium dodecyl sulfate PAGE (SDS-PAGE) is an im-portant method used for the separation of proteins based on the migration of negatively charged proteins, depending on their molecular weight in an electrical field. Its advantage is that proteins can be separated and visualized. The SDS-PAGE technique provides information about the degree of purity of a particular protein in a protein mixture applied on a certain lane of the PAGE during the protein purification process. Each band in the SDS-PAGE image represents a different pro-tein.
In the protein purification process, it is important to deter-mine the efficiency of each purification step in terms of per-centage of protein of interest (POI) found in the protein
mix-ture. This paper provides a rapid and reliable way to deter-mine the percentage. Generally, the percentage is deterdeter-mined by eye, and the results are quite subjective. In the currently available computer-assisted gel analysis systems, the analysis is usually based on the one-dimensional (1-D) profile of man-ually (by computer mouse) extracted lanes. The band of the POI is determined from the peak points in the horizontal pro-file, and the areas of the rectangular regions are measured. Fi-nally, these measurements are used for purification efficiency calculation. However, rectangular approximations are not ac-curate representations of the ellipse-like protein regions.
In our scheme (see Availability), the region of interest (ROI) containing the significant protein is detected using the snake algorithm (4). A “snake” is loosely placed around the protein band as an ellipse. Then, the snake shrinks itself until it closely encircles and fits around the protein band. The final position of the snake determines the extent of the protein. The iterative snake algorithm is implemented in a multi-resolu-tional framework. The snake is initialized on a low-resolution image. Then, the final position of the snake at the low resolu-tion is used as the initial posiresolu-tion in the higher-resoluresolu-tion im-age. The area of the protein is estimated as the area enclosed by the final position of the snake.
METHODS
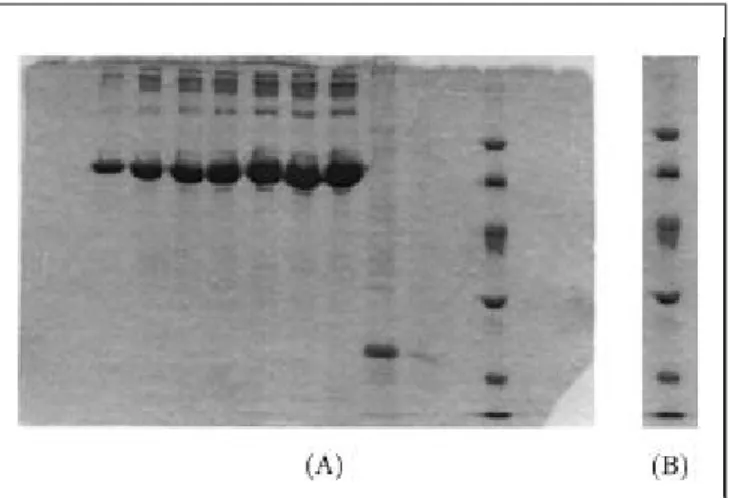
Figure 1A shows a typical SDS-PAGE gel image. The ver-tical lines containing several protein bands in this gel image are called lanes; Figure 1B shows one of them. The SDS-PAGE image is composed of three parts. (i) The background does not carry any useful information. (ii) The second part corresponding to the images of protein bands have darker ap-pearance. (iii) The proteins of interest appear as dark bands. The ratio of total area of the purified protein band region to the total area of other proteins demonstrates the efficiency of each purification step. Figure 2 shows the histograms of the three regions corresponding to the significant protein, other
Quebecor - place LHP BioComputing head
Identification of Relative Protein Bands in
Polyacrylamide Gel Electrophoresis (PAGE)
Using a Multi-Resolution Snake Algorithm
proteins and the background on a typical lane. The histograms of the regions are obtained by manually segmenting the SDS-PAGE image.
The regions containing POI are nearly ellipse-like regions, which have the smallest gray level on the image. Thus, the boundary of such a region is an ellipse-like closed contour having small total intensity and high gradient.
Snakes are deformable contour models that are increasing-ly used in image segmentation (4,6). They are planar curves. The shape and location of the curve is determined according to an objective function. Snakes are influenced by the image structure, and the ROI is enclosed by the snake by minimiz-ing an “energy’’ expression. The total energy of the snake around a closed contour, v(s), is defined in Equation 1:
E[v(s)] = $v[Eint(s) + Eext(s)] ds [Eq. 1]
where Eintand Eextrepresent the internal and external ener-gies of the snake, respectively.
The internal energy, Eint, is determined according to the length and bending of the snake and is defined by Equation 2:
Eint= αEl+ βEb [Eq. 2]
where the first term denotes the length energy, El, the second term denotes the bending energy, Eb, and the weights α and β
control the relative importance of these energy terms in the to-tal energy. In digito-tal implementation, the length energy is computed simply as the sum of the distances between snax-els, which are the control points of the snake curve. The curve is determined by the snaxel points and the pixels on the lines connecting the snaxels. In this study, the number of snaxels is experimentally determined, and a first order (linear) interpo-lation is used to draw the entire snake curve encircling regions of interest that are protein bands.
If snaxels on the image, siare located at (xi*, y
i*), for i = 1,
..., N, then the length energy, El, is computed as in Equation 3:
where x*
N+1= x*1and y*N+1= y*1, as the snake is a closed con-tour.
The bending energy, Eb, controls the smoothness of the snake curve. A suitable measure for the smoothness is the second derivative along the contour. The bending energy can be approximated in digital implementation as in Equation 4:
[Eq. 4] where x*
N+1= x*1, y*N+1= y*1, x*0= x*Nand y*0= y*N.
The external energy, Eext, represents the energy created by the image structure, depending on the location of the snake on the image; it is defined as in Equation 5:
Eext = wnEn+ weEe [Eq. 5]
where the first term, En, defines the line energy, the second term, Ee, defines the edge energy and the weights, wn, we, de-termine the contribution of line and edge energies to the total energy, respectively. The line energy is computed simply by adding pixel intensity values, I[x,y], on the snake curve, as in Equation 6:
M
En= ∑I[xj,yj] [Eq. 6]
j=1
where the index j runs over all the M pixels along the snake curve.
The second external energy component, Ee, is basically the
gradient approximation of the underlying image along the snake curve, as in Equation 7:
M
Ee= ∑
[
(I[xj+1,yj] - I[xj-1,yj])2+ (I[xj,yj+1] - I[xj,yj-1])2
]
j=1
[Eq. 7] where the index j runs over all the M pixels along the snake curve. This is not the only form of gradient approximation; however, for our purposes, it is satisfactory.
Our application is based on the fast, greedy snake algo-rithm described in Reference 8. It is an iterative algoalgo-rithm, and at each iteration, the snake curve changes in such a way that its total energy is minimized. The algorithm is adapted to our problem so that the resultant snake curve has an ellipse-like shape. This is provided by putting constraints on values of the internal angles of the snake. Initially six snaxels are placed evenly around a circle determined by the peaks of the 1-D profile. Table 1 shows the steps of this algorithm.
RESULTS
The snake algorithm is implemented in a multi-resolution framework or in the wavelet transform domain (7). The origi-nal SDS-PAGE image is first processed by the filter banks previously described (3,5), and low-resolution, quarter-size sub-images (Ill, Ilh, Ihland Ihh) are obtained. The snakes are [Eq. 3]
Figure 1. (A) Denaturing PAGE image; (B) a lane of the denaturing PAGE image.
initialized on the low-low sub-image, Ill. The initial form of the snakes are circles centered at the peak points of the 1-D profile of the lane image. Another initialization is based on the Ilh, Ihland Ihhsub-images, which contain the edge infor-mation about the original SDS-PAGE image. Therefore, the edges of the protein band region can be detected from these sub-images and used as the initial positions of the snakes.
After the initialization on the low-resolution image, the snake adapts itself to the contour around the protein band in an iterative manner, as shown in Table 1, steps 2–5. The final snake obtained on the low-resolution image is used as the ini-tial estimate on a finer-resolution SDS-PAGE image. This process is repeated until the snake has closely covered the
Quebecor - place LHP BioComputing head
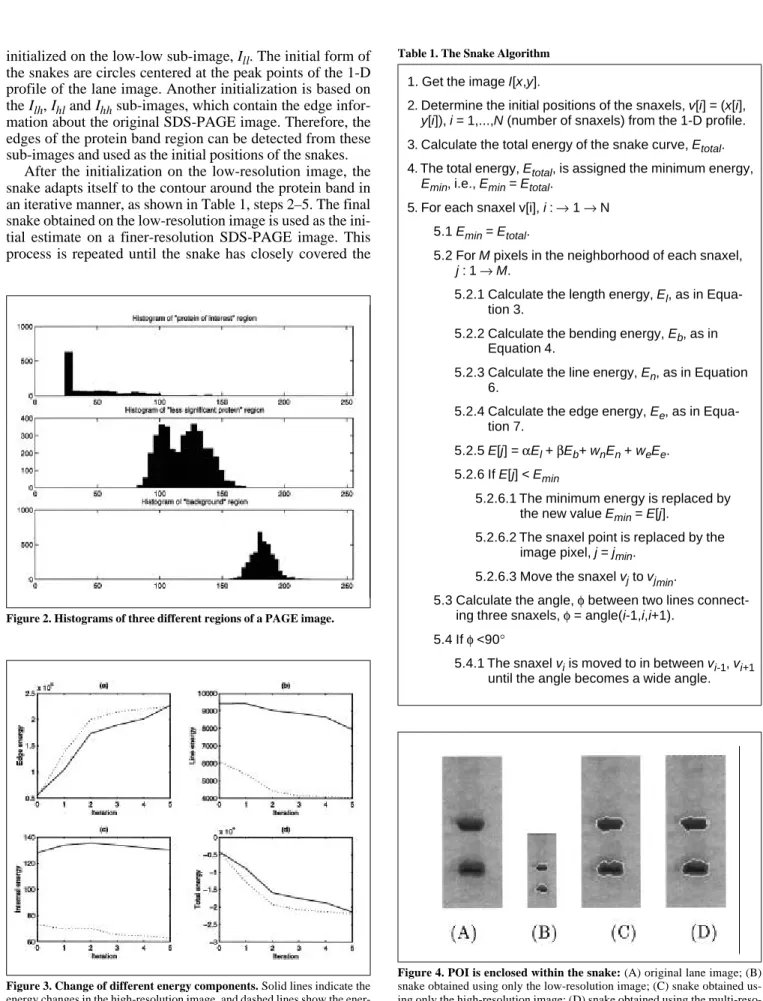
Figure 2. Histograms of three different regions of a PAGE image.
Figure 3. Change of different energy components. Solid lines indicate the
energy changes in the high-resolution image, and dashed lines show the ener-gy changes in the lower-resolution image.
1. Get the image I[x,y].
2. Determine the initial positions of the snaxels, v[i] = (x[i], y[i]), i = 1,...,N (number of snaxels) from the 1-D profile. 3. Calculate the total energy of the snake curve, Etotal. 4. The total energy, Etotal, is assigned the minimum energy,
Emin, i.e., Emin= Etotal.
5. For each snaxel v[i], i : →1 →N 5.1 Emin= Etotal.
5.2 For M pixels in the neighborhood of each snaxel, j : 1 →M.
5.2.1 Calculate the length energy, El, as in Equa-tion 3.
5.2.2 Calculate the bending energy, Eb, as in Equation 4.
5.2.3 Calculate the line energy, En, as in Equation 6.
5.2.4 Calculate the edge energy, Ee, as in Equa-tion 7.
5.2.5 E[j] = αEl+ βEb+ wnEn+ weEe. 5.2.6 If E[j] < Emin
5.2.6.1 The minimum energy is replaced by the new value Emin= E[j].
5.2.6.2 The snaxel point is replaced by the image pixel, j = jmin.
5.2.6.3 Move the snaxel vjto vjmin.
5.3 Calculate the angle, φbetween two lines connect-ing three snaxels, φ= angle(i-1,i,i+1).
5.4 If φ<90°
5.4.1 The snaxel viis moved to in between vi-1, vi+1 until the angle becomes a wide angle.
Table 1. The Snake Algorithm
Figure 4. POI is enclosed within the snake: (A) original lane image; (B)
snake obtained using only the low-resolution image; (C) snake obtained us-ing only the high-resolution image; (D) snake obtained usus-ing the multi-reso-lutional approach.
protein band region in the original full-resolution SDS-PAGE image.
The behavior of the different energy components and the total energy of a snake at several iterations at different resolu-tions are given in Figure 3 for the SDS-PAGE image shown in Figure 1. At the beginning of the convergence process, the slope of the total energy of the snake in the low-resolution im-age, Elow, is higher than that of the snake in the high-resolu-tion image, Ehigh, as shown in Figure 3D. In other words, as
shown in Equation 8:
Elow[k+1]
>
Ehigh[k+1]
[Eq. 8]Elow[k] Ehigh[k]
This means that the snake converges faster on the low-res-olution image. This observation verifies the validity of the
multi-resolutional approach. In our simulation studies, we use only one level of sub-band decomposition, but this methodol-ogy can be considered in multiple resolution levels as well.
The energy weights defined in Equations 2 and 5 (α, β, wn
Resolution Edge Line Length Bending
High 3517 3517 648 324
Low 756 756 132 66
Table 2. Number of Computations for High- and Low-Resolution
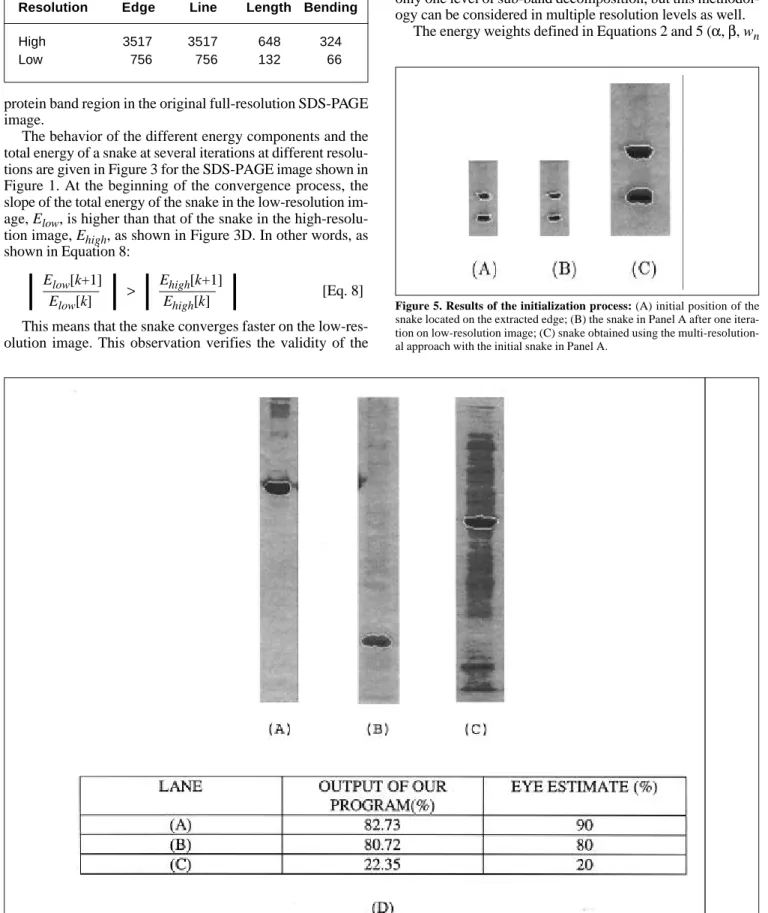
Figure 5. Results of the initialization process: (A) initial position of the
snake located on the extracted edge; (B) the snake in Panel A after one itera-tion on low-resoluitera-tion image; (C) snake obtained using the multi-resoluitera-tion- multi-resolution-al approach with the initimulti-resolution-al snake in Panel A.
Quebecor - place LHP BioComputing head
and we) must be adapted to the energy level changes in differ-ent resolutions. In the multi-resolutional scheme, at the final iteration of the low-resolution image, α, βand wnvalues are halved, and the iterations are continued in the higher-resolu-tion image. At the low resoluhigher-resolu-tion, these values are α= 4, β= 4, wn= 0.2 and we= -0.1.
Figure 4 shows an original lane of the image and the final positions of different snakes obtained using different method-ologies. The result in Figure 4C is obtained after six iterations of the snake algorithm on the original image. Figure 4D shows the result of the multi-resolutional approach. The snake obtained at the low resolution after two iterations (Fig-ure 4B) is used as the initial position of the snake in the high-resolution image. Figure 4D shows the results of another three iterations in the high-resolution image. The comparison of Figures 4C and 4D indicates that the final snake converges better to the boundary of the protein area if a multi-resolu-tional approach is used. Addimulti-resolu-tionally, the number of compu-tations required in the multi-resolutional approach is smaller. Figure 5 shows the results of the initialization procedure based on the edge information extracted from sub-images Ilh, Ihland Ihh. Figure 5A depicts the initial position of the snake
at the sub-image Ill. The six snaxels are located on the ex-tracted edges of the protein region. This snake takes the form shown in Figure 5B after only one iteration. This form is very close to the final position of the snake on the low-resolution image obtained with the other initialization procedure based on the 1-D profile of the lane image. Figure 5C shows the fi-nal position of the snake on the high-resolution image after two iterations. There is no significant difference between this result and the result shown in Figure 4D, which is obtained with the other initialization procedure. Edge information-based initialization procedures produce similar results with less number of iterations. However, this initialization proce-dure requires the extraction of edges from the sub-images.
The ratio of the amount of POI to the amount of insignifi-cant proteins is estimated by Equation 9:
100 × AS
AT [Eq. 9]
where ASis the area of the region enclosed by the snake, that is, the region of POI; ATis the total area of the protein band images. The area, AT, is estimated by counting the number of pixels representing all protein band regions, which have
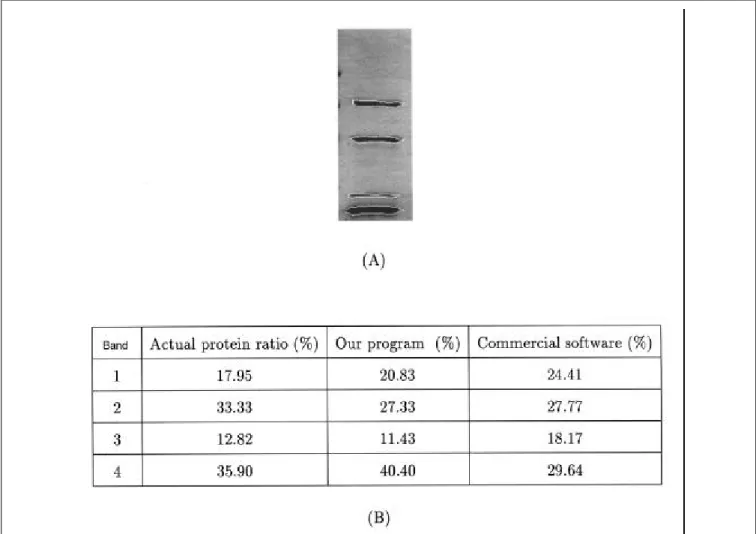
gray-Figure 7. (A) SDS-PAGE image of known amounts of protein bands; (B) actual protein amount ratios determined by Bradford protein assay and comparisons of
level values smaller than a threshold value. The threshold is calculated using the 1-D vertical profile of lanes. The profile is calculated by taking the average of pixel intensity values along the horizontal direction, and the threshold is determined according to the maximum gray level in the profile. The effect of noise in the image is reduced by the averaging operation. Once the peak values are determined according to the initial threshold, the snake algorithm determines the boundaries au-tomatically.
Using this methodology, the percentage of POI is estimat-ed in the examples shown in Figure 6, A, B and C. In all three images, the snake closely encircles the band of POI. The per-centages are found to be 82.73%, 80.72% and 22.35% for the lanes in Figure 6, A, B and C, respectively. By eye, the per-centages are estimated as 90%, 80% and 20%, respectively. These are tabulated in Figure 6D. In the first example (Figure 6A), our software provides more accurate concentration esti-mates of POI.
Our method outperforms a commercially available soft-ware program that determines the bands by thresholding and rectangular approximation. In an additional experiment, we compared the protein band ratios using our algorithm and the commercial software for known amounts of protein deter-mined by Bradford protein assay (2) for each protein band separately. Figure 7 shows the tabulated results. The actual percentages are 17.95%, 33.33%, 12.82% and 35.90%. Our software estimates them as 20.83%, 27.33%, 11.43% and 40.40%, compared with 24.41%, 27.77%, 18.17% and 29.64% as estimated by the commercial software. The squared values of the differences between the actual percent-ages and the results of our program and the commercial pro-gram are 66.47 and 140.45, respectively. This indicates that our software provides better results than the commercially available software.
DISCUSSION
In this work, we present a multi-resolution snake algo-rithm for the identification of relative protein bands in PAGE images. The algorithm is more accurate compared to usual eye exams or to some commercially available programs that utilize rectangular approximations.
The advantage of this multi-resolutional approach is three-fold: (i) the snake algorithm converges better, (ii) it brings ro-bustness to the process; i.e., it is not easily affected by the scanning artifacts in the original SDS-PAGE image and (iii) computational cost is less since smaller images are processed in lower resolutions.
For each iteration of energy calculations, the number of computations depends on the length of the snake and the ra-dius of the search window. With search rara-dius of n pixels and snake length of N pixels, the number of computations for a single iteration of energy calculations is 0(Nn2) (8). In this study, the number of snaxels and the radius of the search win-dow are halved in the lower-resolution images. Therefore, the ratio, R, of the total computational complexity in the low-res-olution image to that in the high-reslow-res-olution image is as in Equation 10:
(n+1)2
R = [Eq. 10]
2 ×(2n+1)2
where (n+1)2and (2n+1)2are areas of search windows at the high- and low-resolution images, respectively.
Table 1 shows the number of times each energy compo-nent is computed on high- and low-resolution images at the last iteration. The total number of energy-component compu-tations in the low-resolution image is reduced to approxi-mately one-fourth of that in the high-resolution image. This figure is almost equivalent to the value we get if we take n = 2 in Equation 10.
The multi-resolutional snake framework might also find applications in other electrophoretic techniques that require comparative band-image quantifications.
AVAILABILITY
The computer program described in this paper as well as some sample input and output images are freely available on our Web page: (http://www.cs.bilkent.edu.tr/~koyuturk/ PAGE.html). You can also obtain the program from the Soft-ware Library at the BioTechniques Web site (www. BioTechniques.com).
REFERENCES
1.Allen, R.C., C.A. Savaris and H.R. Marier. 1984. Gel Electrophoresis and Isoelectric Focusing of Proteins: Selected Techniques. Walter de Gry-ten, Berlin.
2.Bradford, M.M. 1976. A rapid and sensitive method for quantitation of microgram quantities of protein utilizing the principle of protein-dye binding. Anal. Biochem. 72:248-254.
3.Çetin, A.E., Ö.N. Gerek and ÔÔ. UlukuÕÕ. 1993. Block wavelet transforms for image coding. IEEE Trans. Cir. Sys. Video Tech. 6:433-435.
4.Kass, M., A. Witkin and D. Terzopoulos. 1988. Snakes: active contour models. Int. J. Computer Vision 1:321-331.
5.Kim, C.W., R. Ansari and A.E. Çetin. 1992. A class of linear-phase reg-ular biorthogonal wavelets. IEEE International Conference on Acoustics, Speech, and Signal Processing (ICASSP’92), San Francisco.
6.Leymarie, F. and M.D. Levine. 1993. Tracking deformable objects in the plane using an active contour model. IEEE Trans. Pattern Anal. Mach. In-tell. 15:617-633.
7.Vetterli, M. and J. Kovacevic. 1995. Wavelets and Subband Coding. Prentice Hall, New Jersey.
8.Williams, D.J. and M. Shah. 1990. A fast algorithm for active contours. IEEE Trans. Pattern Anal. Mach. Intell. 4:592-595.
Received 9 September 1998; accepted 24 February 1999.
Address correspondence to:
Rengül Çetin-Atalay
Department of Molecular Biology and Genetics Bilkent University
Bilkent, Ankara, TR-06533, Turkey Internet: [email protected]
V i e w p u b l i c a t i o n s t a t s V i e w p u b l i c a t i o n s t a t s