Full Terms & Conditions of access and use can be found at
http://www.tandfonline.com/action/journalInformation?journalCode=cira20
Download by: [Bilkent University] Date: 12 November 2017, At: 23:54
ISSN: 0269-2171 (Print) 1465-3486 (Online) Journal homepage: http://www.tandfonline.com/loi/cira20
Patterns of Productivity Growth and the Wage
Cycle in Turkish Manufacturing
Ebru Voyvoda & A. Erinc Yeldan
To cite this article: Ebru Voyvoda & A. Erinc Yeldan (2001) Patterns of Productivity Growth and the Wage Cycle in Turkish Manufacturing, International Review of Applied Economics, 15:4, 375-396, DOI: 10.1080/02692170110081921
To link to this article: http://dx.doi.org/10.1080/02692170110081921
Published online: 21 Jul 2010.
Submit your article to this journal
Article views: 68
View related articles
ISSN 0269-2171 print/ISSN 1465-3486 online/01/040375-22 2001 Taylor & Francis Ltd
DOI: 10.1080/02692170110081921
Ebru Voyvoda & A. Erin‡ Yeldan, Department of Economics, Bilkent University, 06533 Ankara, Turkey. E-mails: [email protected], [email protected]
Patterns of Productivity Growth and the Wage Cycle
in Turkish Manufacturing
EBRU VOYVODA & A. ERIN YELDAN
ABSTRACT In this paper we investigate the distributional consequences of the post-1980 accumulation patterns and technological change in the Turkish manufacturing industries. We utilise two quantitative techniques. First, we make use of the Hodrick± Prescott filter to disintegrate the cyclical variations in productivity growth and wage rates from their respective historical trends, and study the evolution of the wage cycle against the long term productivity patterns in the sector. Next, we decompose the fundamental characteristics of the contributions of productivity growth of the manufacturing sub-sectors to the overall total. Our results suggest very little structural change in the sectoral composition and nature of productivity advances under the post-1980 structural adjustment reforms and outward-orientation, and underscore that the gains in productivity in this period did not materialise as gains in remunerations of wage labour. Contrary to the prognostications of the orthodox theory, the post-1980 export orientation of Turkish manufacturing was not found to lend itself to productivity contributions, and could not be sustained as a viable strategy of `export-led industrialisation’ .
1. Introduction
In this paper we investigate the distributional consequences of the post-1980 accumulation patterns and technological change in Turkish manufacturing indus-tries. The period under analysis is known to span the overall transformation of the Turkish economy from domestic demand-oriented import-substitutionist indus-trialisation to one with export-orientation and integration with the global commodity and financial markets. During this period, the manufacturing industry has evolved as the main sector in both leading the export-orientation of the economy, and also as a focal sector wherein the distribution patterns between wage-labour and capital have been re-shaped.
Existing independent studies1 and rudimentary data from official agencies
suggest anecdotal evidence that one of the major structural deficiencies of the sector reveals itself in the rather loose association between the gains in labour productivity on the one hand, and the dismal patterns of employment, accumulation, and of
remunerations of wage labour, on the other. This deformation is, in fact, observed to be a perennial feature of the post-1980 structural adjustment era. Indeed, data from the State Institute of Statistics (SIS) suggest that while the average real value added per worker employed has increased by 160% between 1980 ± 96, real wage earnings barely reach the 1980 level as of 1996.2 Furthermore, formal labour
employment has increased by only 31.8% over the same period, leading many independent researchers to characterise the overall performance of the sector as an `enigma’ (see, for example, Yeldan & KÈose, 1999; Ercan, 1999; Yent Èurk, 1997; Kepenek, 1996; ,Senses, 1996; and Maraslioglu & Tiktik, 1991).
What was theoretically expected from the process of outward orientation, however, was that as the sector was exposed to more competition and technological know-how in the global markets, rapid gains in productivity would be converted into gains in both wage earnings and employment. Consequently, the manufactur-ing industry would also serve as the engine of growth for the rest of the economy. Yet the fact that this expectation did not materialise throughout the decade has also precipitated the political conditions leading to the demise of the manufacturing export-led growth strategy by 1989.
It is the purpose of this paper to analytically depict and decompose the fundamental characteristics of accumulation, technological change and distribution in the Turkish manufacturing sector. To this end, we employ two quantitative techniques: first, we follow on the advances of the recent business-cycle literature and decompose the variations in labour productivity and the real wage rate to obtain their long term underlying trends for the period 1950± 96. Here, we make use of the so-called Hodrick± Prescott (1997) filter to disintegrate the cyclical variations in productivity growth and wage rates from their respective historical trends. This exercise enables us to isolate the underlying trend paths of the two series, and to make inferences about the evolution of the wage cycle against the long term productivity patterns in Turkish manufacturing. Then, on a second level of analysis, we aim at a more detailed decomposition exercise on the nature and sources of productivity growth within the sub-sectors of the manufacturing industry. Here, we build upon the now seminal works of Syrquin (1986), Chenery et al. (1986) and one of its recent applications due to Pieper (1998), and decompose the contributions of productivity growth of the manufacturing sub-sectors to the overall total. In so doing, we categorise the sectors as `leaders’ versus `followers’ given the extent and nature of their contributions to overall labour productivity growth in aggregate manufacturing. Our results suggest very little, if any, structural change in the sectoral composition and nature of productivity advances under the post-1980 structural adjustment reforms and outward-orientation of the economy, and underscore that the rapid gains in productivity in this period did not materialise as gains in remunerations of wage labour.
The paper is organised in four parts. In the next section we present an overview of the growth-crisis and the post-crisis adjustment cycles of the Turkish economy from the viewpoints of accumulation, productivity and distribution. In Section 3 we study the historical trends of labour productivity and real wage movements using filtering techniques. We investigate the nature of such productivity gains in aggregate manufacturing by decomposing its sources into its sub-sectors in Section 4. With this approach we make comparisons between the patterns of productivity of the import substitutionist phase of the 1970s versus the outward orientation and financial liberalisation of the 1980s and 1990s. Finally, Section 5 summarises and concludes.
2. Phases of Macroeconomic Adjustment in Turkey
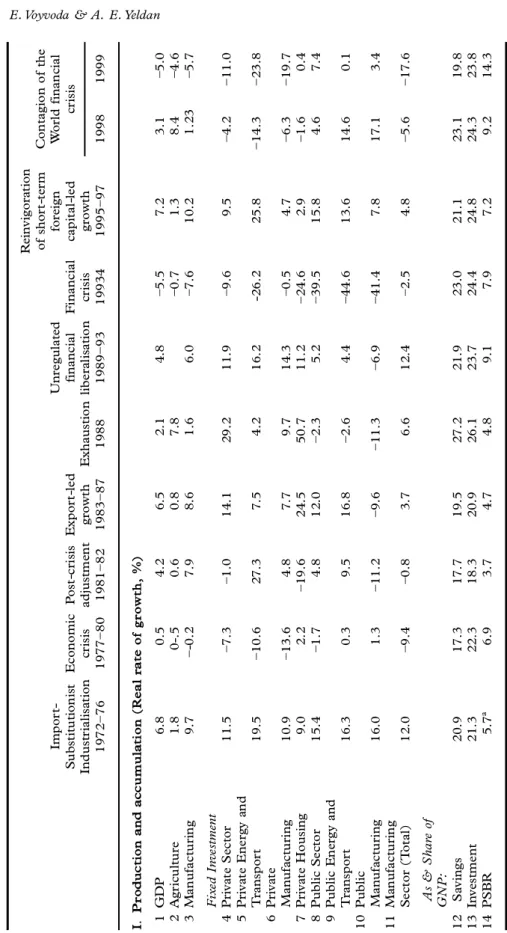
We provide a general overview of the recent macroeconomic history of Turkey in Table 1. Overall, it is seen that the Turkish economy has experienced three distinct cycles of growth-crisis-and-adjustment during the last three decades. The first covers broadly the period 1972± 79, with its main attribute being the deepening of the import substitutionist industrialisation strategy. This period, often called the
second phase of import substitution, is characterised by the implementation of a
vigorous public investment programme that is aimed at expanding the domestic production capacity in heavy manufacturing and capital goods, such as machinery, petrochemicals, and basic intermediates. The foreign trade regime was under heavy protection via quantitative restrictions, along with a fixed exchange rate regime which, on average, was overvalued given purchasing parity terms. The state was both an investing and a producing agent with state economic enterprises (SEEs) serving as the major tools for fostering the industrialisation targets.
During 1927± 79, the underlying political economy basis of the ISI strategy was one of a grand, yet delicate, alliance between the bureaucratic elites, industrial capitalists, industrial workers, and the peasantry (Boratav, 1983; Boratav et al. 1984). Accordingly, private industrial profits were supported from two sources. First, the protectionist trade regime, often implemented through strong non-tariff barriers, enabled industrialists to capture oligopolistic profits and rents originating from a readily available, protected domestic market. Second, the existence of a public enterprise system with the strategic role of producing cheap intermediates through artificially low, administered prices enabled the private industrial enter-prises (and the rural economy) to minimise material input costs. Industrialists, in turn, have `accepted’ the conditions of a general rise in manufacturing wages, and an agricultural support programme, which induced the domestic terms of trade to favour agriculture.
The import substitutionist development strategy was observed to reach its limits beginning in 1976 when the financing of the balance of payments and industrial investments became increasingly difficult. The foreign exchange crisis of 1977± 80 brought together the cessation of the civilian democracy and imposition of a new constitution and labour codes regulating the industrial relations under a military regime.
Growth was re-invigorated following the introduction of a structural adjust-ment programme in January 1980, under the auspices of the international centres such as the World Bank and the IMF. The period 1981± 87 was marked with commodity trade liberalisation and export promotion along with a price reform aimed at reducing the state’s role in the economic affairs. The existing system of fixed exchange rate administration was replaced by a flexible regime of crawling-peg and, together with the introduction of a complex system of direct export subsidisation, acted as the main instrument for the promotion of exports and pursuit of macroeconomic stability.3
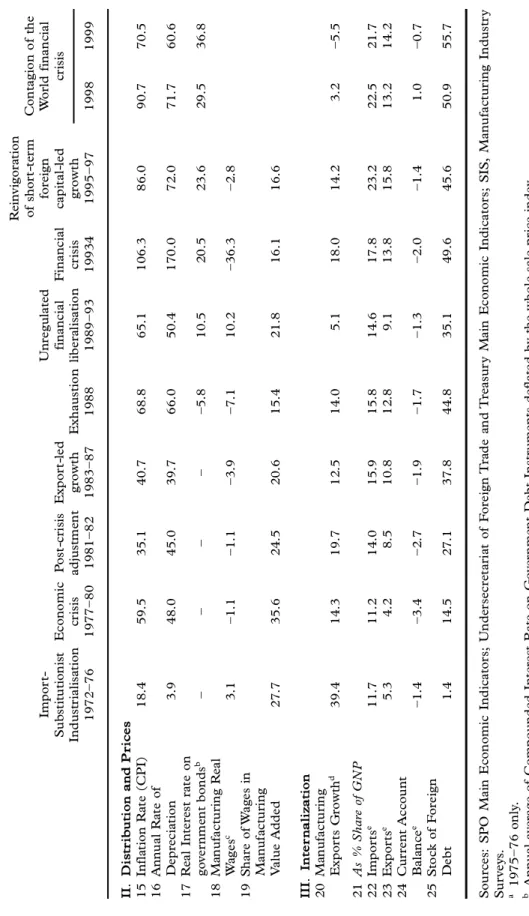
During the period 1983± 87, export revenues increased at an annual rate of 10.8% and gross domestic product rose at an annual rate of 6.5%. The period was also characterised by severe erosion of wage incomes via hostile measures against organised labour. The suppression of wages was instrumental both in lowering production costs and also in the squeezing of the domestic absorption capacity. The share of wage-labour in manufacturing value added receded from its average of 35.6% in 1977± 80, to 20.6% in 1988 (Table 1, row 19, columns 2 and 5). In this
T a b le 1 . P h as es o f m ac ro ec o n o m ic a d ju st m en t in T u rk ey , 1 9 7 2 ± 9 9 Im p o rt -S u b st it u ti o n is t In d u st ri al is at io n 1 9 7 2 ± 7 6 E co n o m ic cr is is 1 9 7 7 ± 8 0 P o st -c ri si s ad ju st m en t 1 9 8 1 ± 8 2 E xp o rt -l ed gr o w th 1 9 8 3 ± 8 7 E xh au st io n 1 9 8 8 U n re gu la te d fi n an ci al li b er al is at io n 1 9 8 9 ± 9 3 F in an ci al cr is is 1 9 9 3 4 R ei n vi go ra ti o n o f sh o rt -t er m fo re ig n ca p it al -l ed gr o w th 1 9 9 5 ± 9 7 C o n ta gi o n o f th e W o rl d f in an ci al cr is is 1 9 9 8 1 9 9 9 I. P ro d u c ti o n a n d a c c u m u la ti o n ( R e a l ra te o f g ro w th , % ) 1 G D P 6 .8 0 .5 4 .2 6 .5 2 .1 4 .8 ±5.5 7 .2 3 .1 ±5.0 2 A gr ic u lt u re 1 .8 0 -. 5 0 .6 0 .8 7 .8 ±0.7 1 .3 8 .4 ±4.6 3 M an u fa ct u ri n g 9 .7 ±-0 .2 7 .9 8 .6 1 .6 6 .0 ±7.6 1 0 .2 1 .2 3 ±5.7 F ix ed I n ve st m en t 4 P ri va te S ec to r 1 1 .5 ±7.3 ±1.0 1 4 .1 29 .2 1 1 .9 ±9.6 9 .5 ±4.2 ±11 .0 5 P ri va te E n er gy a n d T ra n sp o rt 1 9 .5 ±10 .6 27 .3 7 .5 4 .2 1 6 .2 -2 6 .2 2 5 .8 ±14 .3 ±23 .8 6 P ri va te M an u fa ct u ri n g 1 0 .9 ±13 .6 4 .8 7 .7 9 .7 1 4 .3 ±0.5 4 .7 ±6.3 ±19 .7 7 P ri va te H o u si n g 9 .0 2 .2 ±1 9 .6 2 4 .5 5 0 .7 1 1 .2 ± 24 .6 2. 9 ±1 .6 0 .4 8 P u b li c S ec to r 1 5 .4 ±1.7 4 .8 1 2. 0 ±2.3 5 .2 ±39 .5 1 5 .8 4 .6 7 .4 9 P u b li c E n er gy a n d T ra n sp o rt 1 6 .3 0 .3 9 .5 1 6 .8 ±2 .6 4 .4 ±4 4 .6 1 3 .6 1 4 .6 0 .1 1 0 P u b li c M an u fa ct u ri n g 1 6 .0 1 .3 ±1 1 .2 ±9 .6 ±1 1 .3 ±6 .9 ±4 1 .4 7 .8 1 7 .1 3 .4 1 1 M an u fa ct u ri n g S ec to r (T o ta l) 1 2. 0 ±9 .4 ±0 .8 3 .7 6 .6 1 2. 4 ±2 .5 4 .8 ±5 .6 ±1 7 .6 A s & S h a re o f G N P : 1 2 S av in gs 2 0 .9 1 7 .3 1 7 .7 1 9 .5 27 .2 2 1 .9 23 .0 2 1 .1 23 .1 1 9 .8 1 3 In ve st m en t 2 1 .3 2 2 .3 1 8 .3 2 0 .9 26 .1 2 3 .7 24 .4 2 4 .8 24 .3 23 .8 1 4 P S B R 5 .7 a 6 .9 3 .7 4 .7 4 .8 9 .1 7 .9 7 .2 9 .2 1 4 .3
T a b le 1 . (C o n ti n u ed ) Im p o rt -S u b st it u ti o n is t In d u st ri al is at io n 1 9 7 2 ±7 6 E co n o m ic cr is is 1 9 7 7 ±8 0 P o st -c ri si s ad ju st m en t 1 9 8 1 ±8 2 E xp o rt -l ed gr o w th 1 9 8 3 ±87 E xh au st io n 1 9 8 8 U n re gu la te d fi n an ci al li b er al is at io n 1 9 8 9 ±9 3 F in an ci al cr is is 1 9 9 3 4 R ei n vi go ra ti o n o f sh o rt -t er m fo re ig n ca p it al -l ed gr o w th 1 9 9 5 ±9 7 C o n ta gi o n o f th e W o rl d f in an ci al cr is is 1 9 9 8 1 9 9 9 II . D is tr ib u ti o n a n d P ri c e s 1 5 In fl at io n R at e (C P I) 1 8 .4 5 9 .5 3 5 .1 4 0 .7 6 8 .8 6 5 .1 1 0 6 .3 8 6 .0 9 0 .7 7 0 .5 1 6 A n n u al R at e o f D ep re ci at io n 3 .9 4 8 .0 4 5 .0 3 9 .7 6 6 .0 5 0 .4 1 7 0 .0 7 2. 0 7 1 .7 6 0 .6 1 7 R ea l In te re st r at e o n go ve rn m en t b o n d s b ± ± ± ± ±5.8 1 0 .5 20 .5 2 3 .6 2 9 .5 3 6 .8 1 8 M an u fa ct u ri n g R ea l W ag es c 3 .1 ±1 .1 ±1 .1 ±3 .9 ±7 .1 1 0 .2 ±3 6 .3 ± 2. 8 1 9 S h ar e o f W ag es i n M an u fa ct u ri n g V al u e A d d ed 2 7 .7 3 5 .6 2 4 .5 2 0 .6 1 5 .4 2 1 .8 1 6 .1 1 6 .6 II I. In te r n a li z a ti o n 2 0 M an u fa ct u ri n g E xp o rt s G ro w th d 3 9 .4 1 4 .3 1 9 .7 1 2. 5 1 4 .0 5 .1 1 8 .0 1 4 .2 3 .2 ±5.5 2 1 A s % S h a re o f G N P 2 2 Im p o rt s e 1 1 .7 1 1 .2 1 4 .0 1 5 .9 1 5 .8 1 4 .6 1 7 .8 2 3 .2 2 2. 5 2 1 .7 2 3 E xp o rt s e 5 .3 4 .2 8 .5 1 0 .8 1 2. 8 9 .1 1 3 .8 1 5 .8 1 3 .2 1 4 .2 2 4 C u rr en t A cc o u n t B al an ce e ±1.4 ±3.4 ±2. 7 ±1.9 ±1.7 ±1.3 ±2.0 ±1.4 1 .0 ±0.7 2 5 S to ck o f F o re ig n D eb t 1 .4 1 4 .5 2 7 .1 3 7 .8 4 4 .8 3 5 .1 4 9 .6 4 5 .6 5 0 .9 5 5 .7 S o u rc es : S P O M ai n E co n o m ic I n d ic at o rs ; U n d er se cr et ar ia t o f F o re ig n T ra d e an d T re as u ry M ai n E co n o m ic I n d ic at o rs ; S IS , M an u fa ct u ri n g In d u st ry S u rv ey s. a 1 9 7 5 ±76 o n ly . b A n n u al a ve ra ge o f C o m p o u n d ed I n te re st R at e o n G o ve rn m en t D eb t In st ru m en ts d ef la te d b y th e w h o le s al e p ri ce i n d ex . c W ag e ea rn in gs o f w o rk er s en ga ge d i n p ro d u ct io n . P ri va te m an u fa ct u ri n g la b o r d at a co ve r en te rp ri se s em p lo yi n g 1 0 + w o rk er ss . d A n n u al g ro w th r at e in m an u fa ct u ri n g ex p o rt s (i n m il li o n U S $ ). e In cl u d in g lu gg ag e tr ad e af te r 1 9 9 6 .
process, the average mark up rate (profit margins) in private manufacturing has increased from 31% to 38%.
During the 1980s, public sector balances were, in general, maintained and the public sector borrowing requirement (PSBR) has been of the order of 4.7% of the gross domestic product (GDP). Domestic saving rate reached 20% and the share of investments increased to 21% of the aggregate GDP (Table 1, rows 12, 13, 14). However, the composition of total fixed investments displayed quite adverse trends at the sectoral level from the point of view of strategic targets. In fact, as gross fixed investments of the private sector increased by 14.1% during 1983± 87, only a small portion of this amount was directed to manufacturing. The rate of growth of private manufacturing investments has been of the order of half of this figure, at a rate of only 7.7% per annum, and could not reach its pre± 1980 levels in real terms until the end of 1989. As data in rows 4± 7 in Table 1 attest, much of the expansion in private manufacturing investments originated from the pull from housing investments, which expanded, by an annual average rate of 24.5% during 1983± 87. This resulted in a significant anomaly as far as the official stance towards industrialisation was concerned: in a period where outward orientation was supposedly directed to increased manufacturing exports through significant price and subsidy incentives, distribution of investments revealed a declining trend for the sector. The implications of this non-conformity between the stated foreign trade objectives towards manufacturing exports and the realised patterns of accumulation away from
manufacturing constituted one of the main structural deficiencies of the export
oriented growth strategy of the 1980s and, according to our view, played a crucial role in the failure of maintaining the export promotion programme as a sustainable strategy of development.
As this unbalanced structure failed to generate the necessary accumulation patterns, the artificial growth path generated by way of wage suppression and price subsidies was observed to reach its economic and political limits by 1988. As summarised in Table 1, row 18, all economic indicators of 1988 signal a stagflationary macro environment. Commensurate with these facts, we observe real wage earnings enter a period of recovery following the gains of union movement, and also of the new wave of populist pressures. As can be seen from data tabulated in Table 1, real wages in manufacturing increased at an annual rate of 10.2% consecutively, from 1989 to 1993. In retrospect, it can be argued that the post-1988 populism could evidently be financed by expanding the tax base over the so-called `unrecorded private commercial transactions’ , and by moving towards a `fair’ tax system. Yet, the strategic preference of the government was the maintenance of its current stance towards erosion of taxable capital incomes and absorption of all costs of adjustment in favour of profit incomes against the culminating wage pressures (Boratav et al., 2000; Cizre-Sakallõ oÆglu & Yeldan, 2000; T Èurel, 1999). As one of the major indicators of the (functional) distribution of income, we observe that the profit margins in fact followed a rising trend, and reached 47% in 1994, from its average of 33.5% in 1989.4In the meantime, the fiscal gap widened abruptly, and
the public sector borrowing requirement (PSBR) as a ratio of the GDP rose to 10.1% in 1991, and to 12.1% in 1993.
Given these broad shifts in the macroeconomic environment, the 1989 policy manoeuvre of capital account liberalisation served as one of the major policy initiatives in order to sustain the culminating fiscal deficits of the 1990s. This policy manoeuvre paved the way for injection of liquidity to the domestic economy in terms of short-term foreign capital (flows of `hot money’). Such inflows enabled, on
the one hand, financing of the accelerated public sector expenditures, and also provided relief of the increased pressures of aggregate demand on the domestic markets by way of cheapening costs of imports.5
Erratic movements in the current account, a rising trade deficit (from 3.5% of GNP in 1985 ± 88 to 6% in 1990± 93) and a drastic deterioration of fiscal balances disclose the unsustainable character of the post-1989 populism financed by foreign capital inflows. This prolonged instability reached its climax during the fourth quarter of 1993, when the currency appreciation and the consequent current account deficits rose to unprecedented levels. With the sudden drainage of short-term funds in the beginning of January 1994, imports dwindled by 15%, GDP fell by 5.5%, and the inflation rate soared to 106% per annum. Together with this contraction, the post-1994 crisis management gave rise to significant shifts in income distribution, and real wages in manufacturing declined by 36.3% (Table 1, row 18, column 7). Likewise, dollar-denominated wage costs decreased sub-stantially and enabled export earnings to rise. In this manner, Turkey has, once again, switched back to its classic mode of surplus extraction whereby export performance of industrial sectors depended on savings on wage costs. In fact, the disequilibrium could have only been accommodated by the massive (downward) flexibility displayed by real remunerations of wage-labour. Finally, the global deceleration following the contagion of the Asian financial crisis hit the Turkish economy starting August of 1998 under the already adverse conditions of severe macroeconomic disequilibria with accelerating fiscal and current account deficits, high inflation and unemployment, and increased social unrest.
Clearly, the inherent characteristics of the growth-crisis-adjustment cycles identified thus far have had quite different macroeconomic dynamics in operation. While the import substitutionist (1972± 76) legacy was based on the protectionist rents of a closed economy with an overvalued exchange rate, the export orientation phase (1980 ± 88) was driven by commodity trade liberalisation and real deprecia-tion under condideprecia-tions of wage suppression. The post-1989 financial liberalisadeprecia-tion completed the integration of the domestic economy with the global commodity and financial markets, and initiated a process of short-term foreign capital-led growth with abrupt mini cycles of boom and crisis throughout the 1990s.
In the next section, we turn to an analytical investigation of these dynamics from the viewpoints of growth, accumulation, and distribution. We first provide a formal presentation of our methodology.
3. Historical Trends of Labour Productivity Growth and Real Wages in Turkish Manufacturing
We now turn to a quantitative investigation of the dynamics of productivity and the wage movements over a long time horizon spanning 1950± 96. We decompose the historically realised rates into a trend component and into, what we will term as, cyclical deviations. Such a decomposition will enable us to study the underlying characteristics of the long run movements of the manufacturing wages against the productivity trend and to investigate properties of the deviations in response to policy shifts and other macroeconomic aggregates.
One of the most widely used decomposition filters in the literature is that of Hodrick & Prescott.6The Hodrick± Prescott filter decomposes the time series of a
given variable into the trend {t t}Tt = 1 and cyclical components, {yt ± t t}Tt = 1. It is
expected that this method would satisfy the following two criteria: (i) the deviations
of the analysed variable from the attributed trend should be `minimal’; and (ii) the trend components should follow a uniform path as much as possible; in other words, it should not display large variations along its historical path over time.
Under these criteria, one can find a path for the trend by solving this minimisation program for each variable concerned:
min {t}tt = 1 ST t = 1[yt± t t] 2 +l ST ± 1 t = 2[(t t + 1± t t) ± (t t± t t ± 1)] 2 (1)
In this function, the first term gives the sum of the squared deviations ((S T t = 1
(y1± t t)2) and thus reflects the adjustment of the deviations to the trend path over
time. The second term, on the other hand, is the multiple l of the sum of the squares of the trend component’s second differences. This second term penalises variations in the growth rate of the trend component with the penalty being correspondingly larger if l is larger. The first-order conditions of this minimisation program can then be solved for the trend path, t t.
As suggested by Hodrick & Prescott (1997, p. 4) we hypothesise in this study that a deviation of 5% of the annual value of the cyclical component from its trend, and a 0.25% deviation within the trend are to be regarded as `large’ deviations from the point of view of the above program. Consequently, the value of l in the above equation is taken as the ratio of these two variances, (5/0.25)2, or in other words,
400.7
Data for our analysis come from the Manufacturing Industry Annual Surveys reported by the State Institute of Statistics (see endnote 2). For the `wage rate’ series we have used `total wage earnings’ divided by `total workers engaged in production’ . Average labour product is derived by dividing `total value added’ by the same labour employment magnitude. Both series are deflated by the whole sale price index and are filtered in logarithmic form.
The results of the filter are portrayed in Figs 1(a) and (b). The units on the
y-axis are in real 1963 Turkish Lira prices in log scale. In Fig. 1(a), we observe the
historical long time trend of the real average labour product in Turkish manufacturing. The trend has a secular upward slope with an average rate of annual growth of 3.8% for the whole time horizon (1950± 96). This is to be contrasted with the trend of the real wage rate portrayed in Fig. 1(b). The trend in real wages fluctuates with an increasing path until the mid-1970s, enters a deceleration between 1980 and 1988, and recovers following 1989. The observed recovery in real wage is clearly the end result of the post-1989 populism that enabled sharp increases in real wages between 1989 and 1993 as explained in Section 2 above. On this record of events, it seems plausible to argue that the post-1989 upswing in manufacturing real wages was in fact, in line, with the real average product of labour as far as the long trends of the two series are concerned.8
The fluctuations of the real wage trend consequently document the period-isation of the overall political cycle in the Turkish labour markets. The fundamental characteristic of this cycle is that it discloses a relatively weak connection between wage remunerations and labour productivity in manufacturing industries. The trend path of real wages clearly signals a break following 1979/80 in the sense that the average rate of trend growth of real wages is found to be 2.9% for 1950 ± 79, but sharply falls to 0.05% for the period 1980± 96. This is the era when the domestic economy is subjected to a new transformation towards foreign competition and integration with the global commodity and asset markets. The ongoing wage
suppression as manifested by the downswing in the wage cycle indicates that the adjustments in the labour markets had served as one of the main mechanisms in bringing forth this transformation. Implemented under a military rule with severe restrictions in the Labor Code against collective bargaining and unionisation, the cost savings on wage labour were instrumental in the extraction of an economic surplus which was, in turn, oriented to export markets via a generous export subsidisation programme.
The post-1980 patterns of real wages (both in terms of `earnings’ and also `wage-costs’ ) and average labour productivity can also be contrasted directly using raw data. In Fig. 2 we contrast the historically realised growth paths of real wage
Fig. 1. (a) Real average labour productivity in Turkish manufacturing: H-P filtered trend.
Fig. 1. (b) Real wages in Turkish manufacturing: H-P filtered trend.
earnings, real wage costs, and the real average product of labour. The indices of wage earnings/costs and of productivity diverge instantly and display a gap of almost 150% on earnings, and 100% on costs.
From a distributional perspective, the behaviour of productivity indexes after 1989 is striking. The upswing in the manufacturing wage costs led to a rise of almost 149.1 index points between 1988 and 1993. This corresponds to a cumulative rise of 162.3% in real prices over the stated period. The average product of labour, APL,
follows this cycle quite closely, and the sudden swing in the wage cycle does not seem to have altered the long run rising trend of labour productivity, which had been incepted as early as 1984. The cumulative rise of the APLover the period 1984
through 1993 records a gain of 183.6%. Such gains on APL were clearly the
end-result of two counteracting mechanisms that were invigorated to rationalise the increase in wage costs from the point of view of private industrial capital: the first was based on direct labour shedding. In fact, one of the major characteristics of the labour market adjustments throughout the 1990s has been widespread layoffs and an overall intensification of marginalised labour employment. Quarterly data on private manufacturing reveal that formal employment in medium to large enterprises employing 10 + workers fell by 25 percentage points between the first quarter of 1988 and the last quarter of 1992. The outbreak of the 1994 crisis has taken an additional toll on formal employment in the sector, bringing the index of private manufacturing employment to 30 points lower than its 1988 level (State Planning Organization, 1998).
The second mechanism that enabled the private industrial capital to absorb the wage increases of the aforementioned period was the pricing policy of the public sector. We calculate that the ratio of intermediate costs to wage costs declined from 11.8 in 1988, to 7.8 in 1990, and to 6.5 in 1991. This was mostly achieved with delayed restructuring of the public prices against an inflationary background, and maintained a surplus for the private sector.
Fig. 2. Real wage costs, wage earnings and real labour productivity in Turkish
manufacturing.
We observe that these structural traits were not limited to a periodical characteristic of aggregate manufacturing alone, but disclosed itself under the sub-sectoral patterns of production and employment within the industry as well. Our findings on the decomposition of the sources of labour productivity gains across manufacturing sub-sectors will be the subject matter of the next section.
4. Decomposition Analysis
Now we turn our attention to a direct comparison of the labour productivity and employment patterns across two distinct phases: 1969 ± 76 versus post-1980. As indicated in Section 2 above, the first phase is characterised by the so-called `planned’ or `import substitutionist’ industrialisation period, implemented with a vivid domestic-orientation. The post-1980 era, in contrast, spans the period of structural adjustment reforms towards `integration with the world markets’, to be implemented under the unfettered market signals. Our task here is to reveal whether the post-1980 period has actually brought a structural-technological change for the Turkish manufacturing industry with positive effects on employment trends and the accumulation patterns of the aggregate economy at large.
At this point it would be proper to place our analytical approach in the context of the existing stock of research addressing similar sets of issues for the Turkish economy. For our working hypotheses we have taken the productivity growth as measured by annual rates of change in the average labour product as a proxy for measuring advances in accumulation and technological change in the Turkish manufacturing industry. The now seminal work by Celasun (1983) provides a first extensive attempt in categorising and measuring the sources of industrial growth and structural change in Turkey for the period of 1953 ± 73. ÈOzmucur (1992) follows a similar path and provides an extensive database on the total factor productivity (TFP) growth rates for the period 1968± 88, albeit without further periodic analysis.
Filiztekin (1999) makes a direct attempt at analysing sources of productivity growth in the manufacturing industries in relation to phases of trade liberalisation. He distinguishes two phases of the post-1980 Turkish trade integration era: commodity trade liberalisation of 1980± 88 (Phase I) and post-1989 financial liberalisation (Phase II). In his TFP decomposition exercise, Filiztekin finds evidence that in the first phase of trade liberalisation, factor accumulation has been the dominant feature in Turkish manufacturing. With the second phase, however, TFP growth became the dominant source of growth. Analysing the 1971± 88 period, Aydogus (1993) also arrives at a similar verdict, and finds very limited evidence, if any, between export expansion or import substitution over TFP growth.
Uygur (1996), on the other hand, analysed the effect of export orientation on growth and argued that reductions in domestic demand via declines in wages, increases in the real exchange rate, and the newly introduced export promotion schemes were the most important elements of export policy. However, in the longer run, exports were constrained by the level of investment and the deteriorating macroeconomic management.
The intrinsic nature of the growth path of manufacturing industry was extensively analysed in Yent Èurk & Onaran (1999). Using econometric methods within panel data analysis, they found evidence about the existence of a stagnationist pattern of accumulation and a wage-led growth regime in the Turkish manufacturing industries. The characteristic nature of growth and the ongoing crisis have been analysed from classical and Marxian perspectives recently by Altõ ok
(1998) who argues that the faster rise of the organic composition of capital over 1963± 1994 resulted in a decline in the sectoral profit rates, leading to an overall crisis of capital accumulation.9
Finally, Pamukcu & de Boer (1999) examined the rate and direction of the process of widening and deepening of inter-industry relations. Utilising this process as a proxy for technological change in their analysis, Pamukcu & de Boer found that growth in manufacturing benefited mostly from the change in intermediate demand structure of the economy in the 1980s. However, they report evidence that this process occurred mainly by increasing intermediate flows within the sectors rather than creating new sectoral linkages across other sectors of the economy.
Our analytical approach differs from these studies in that we utilise a direct decomposition methodology over the time path of average labour product based on the technological leadership attributes of the manufacturing sub-sectors. We decompose the overall labour productivity growth experienced in the aggregate manufacturing industry, and achieve a categorisation based on whether the sub-sector acted as a `leader’ or a `follower’ along the productivity ladder. Our empirical investigations attempt to trace the dynamic adjustments of the sub-sectors in relation to overall structural changes that the Turkish economy has experienced.
Formally, `labour productivity’ is defined as the ratio of total value-added (X) to total employment (L). This ratio will tend to increase under two circumstances: (i) as labour employment stays constant, the level of production may increase, and (ii) the employment level may decline so that per capita value-added increases. Labour productivity technically originates out of these two effects, and decomposi-tion of the overall productivity growth into changes of the sectoral growth of output and employment over time provide clues on the internal dynamics of the manufacturing industry.10
Let overall labour productivity be Q = X/L, where X is total output and L is total employment. For each sector, we have the sectoral productivity identity, q =
x/L where i represents an index of the sub-sectors of manufacturing industry. Then Q is the sum of the sectoral labour productivity ratios:
Q = X L = S ixi S ili , and qi = xi li (2)
Taking the first-differences with respect to time (t = 0), we get:
D Q Q = Q1± Q0 Q0 = S i
3
1
xi1 ± xi0 xi02 1
xi0 X02
Q1 Qi01
Li0± Li0 Li02 1
Li0 Li02
4
(3) Defining: xi1± xi0 xi0= gi (sectoral output growth rate)
li1± li0
li0
= ni (sectoral employment growth rate)
xi0
X0
= u i (sectoral output share)
li0
L0
= l i0 (sectoral labour share)
the following identity appears: D Q
Q = Si
3
giu i± Q1
Q0
l i0ni
4
(4)A re-statement of the above equation enables the decomposition of total productivity into dynamics of: (i) changes in net productivity, and (ii) changes in the structure of output and employment:
D Q
Q = Si
3
u i0(gi± ni) + (u i0±Q1
Q0
l i0)ni
4
(5)The first term in the outside parenthesis is the difference between the growth rate of output and the growth rate of employment. We denote this term as the `net productivity’ , indicating a net positive contribution to the overall labour industrial productivity when the rate of growth of output is greater than the rate of growth of employment in a particular sector. The second term of the right-hand side of Equation (4) represents the effect of sectoral employment reallocation on the overall productivity change. Here, the interaction term, Q1/Q2 is weighted by sectoral
labour share and is subtracted from the output share of that particular sector. By multiplying this magnitude with the sectoral employment growth rate, we obtain an indicator for the productivity effects of the reallocation of employment among the sub-sectors of the manufacturing industry. The `reallocation weight’ [u i0± (Q1/Q0)
l i0], i.e. the difference between the output and the labour share of sector i, reflects
differences in productivity levels across the sub-sectors of the domestic industrial economy, and allows us to detect the leading and the following sectors of the overall productivity change.
In terms of our accounting procedure, a leading sector is identified with a high value of its reallocation weight due to a relatively small labour share and a relatively high output share. As the second term of equation (4) represents the effect of sectoral employment reallocation on overall productivity change, the transfer of labour from a sector with a low output/labour ratio to a sector that admits high-productivity will have a positive contribution to total productivity. Thus, the leading sectors of the economy are expected to show a close relation with changes in the overall productivity due to their higher reallocation weight, irrespective of their relative size (just measured in terms of its labour or output share) in the economy.
In the following, we decompose the effects of the two terms of equation (4) on the total labour productivity of the Turkish manufacturing industry, covering the periods 1970± 76 and 1981± 96. Under the framework described above, we find that the overall productivity has increased by 15.7% during the 1970± 76 period, and by 111.2% in the 1981± 96 period.11
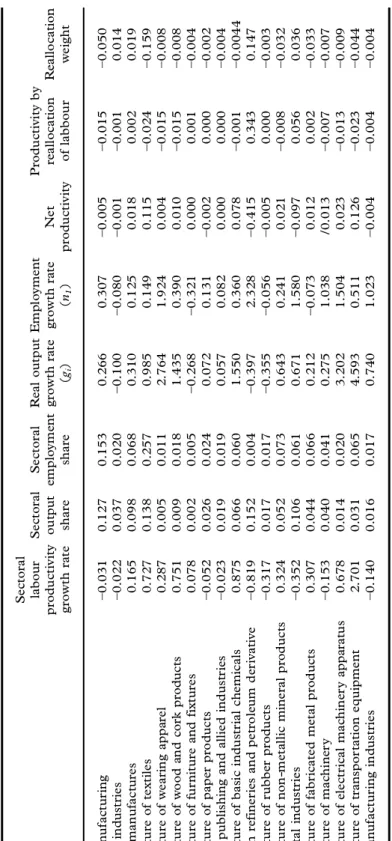
Table 2 documents the relevant measures of our exercise in decomposition of total labour productivity growth into its sub-sectoral components. The first column in the table gives the total productivity rise in a particular sub-sector of aggregate manufacturing. A close investigation of the results of this decomposition exercise reveals the following observations.
We identify the following four sectors with positive reallocation weights ± indicating a relatively high share of output compared with the share of employment ± as the `leading sectors’ for the stated period.
(1) Petroleum refineries and manufacture of petroleum derivatives. (2) Basic metals
(3) Tobacco manufactures (4) Beverage industries
As can be seen in Table 2 ± with the exception of the beverage industry ± all of these sectors determined as `leaders’ have negative productivity growth rates over 1970± 76. For instance, the petroleum industry, which has the highest reallocation weight and the highest output share (15.2%) among the leading sectors, achieved a 232.8% rise in employment, while the output of this sector had actually fallen by 39.7%. As a result, the petroleum industry shows a productivity decrease of 81.9%. Similarly, the rate of growth of labour employment of the basic metal industries is 158.0% which, together with a 67.1% rise in the sectoral output, causes the labour productivity to decrease by 35.2%.
Thus, one conclusion to be reached for the 1970 ± 76 period in terms of the labour productivity analysis is that the `leading sectors’ of the manufacturing industry did not show productivity increases that would cause the economy to sustain rapid growth. Boratav (1983) explains the rather dismal performance of the productivity patterns of this period from a political perspective, and underlines unproductive over-employment as one of the key structural attributes of both the public and the private manufacturing sectors during this period. Yet, a period that displays a 53.2% expansion in total employment along with a cumulative rise of only 15.7% in total labour productivity could endure its balances only under a rapid growth programme. According to Boratav, the economic bases of the inward-looking, import-substitutionist growth model necessitated a rapid expansion of capital investment and labour employment along with a sustained increase in wage remunerations. The state-led investment programme emphasising heavy industrial projects and intermediate producer goods served as the strategic complements of the warranted rate of capital accumulation.
Under this model of growth, since the rise in wages was also part of the expansion of the domestic demand, the continuous increase in real wages and employment could be regarded as `sustainable’ as far as the private sector profitability was concerned. In an era of domestic demand-oriented industrialisa-tion, the rise in wage earnings displayed a strategic complementarity with the sources of demand and eventually with the profitability of private industrial capital. As such, output growth of the period has been solely due to `level’ effects of increased input use, rather than `rate’ effects of productivity gains. However, this `populist’ strategy of the investment-employment-waging episode could have kept each social group in the domestic economy satisfied for only a brief period of time and, as it was ultimately not supported by productivity increases, it came to an abrupt halt on both social and economic grounds starting in 1977.
T a b le 2 . T o ta l m an u fa ct u ri n g in d u st ry l ab o u r p ro d u ct iv it y d ec o m p o si ti o n , 1 9 7 0 ± 7 6 S ec to ra l la b o u r p ro d u ct iv it y gr o w th r at e S ec to ra l o u tp u t sh ar e S ec to ra l em p lo ym en t sh ar e R ea l o u tp u t gr o w th r at e (gi ) E m p lo ym en t gr o w th r at e (n1 ) N et p ro d u ct iv it y P ro d u ct iv it y b y re al lo ca ti o n o f la b b o u r R ea ll o ca ti o n w ei gh t F o o d m an u fa ct u ri n g ±0.0 3 1 0 .1 2 7 0 .1 5 3 0 .2 6 6 0 .3 0 7 ±0.0 0 5 ±0.0 1 5 ±0.0 5 0 B ev er ag e in d u st ri es ±0.0 2 2 0 .0 3 7 0 .0 2 0 ±0.1 0 0 ±0.0 8 0 ±0.0 0 1 ±0.0 0 1 0 .0 1 4 T o b ac co m an u fa ct u re s 0 .1 6 5 0 .0 9 8 0 .0 6 8 0 .3 1 0 0 .1 25 0 .0 1 8 0 .0 0 2 0 .0 1 9 M an u fa ct u re o f te xt il es 0 .7 27 0 .1 3 8 0 .2 5 7 0 .9 8 5 0 .1 4 9 0 .1 1 5 ±0.0 24 ±0.1 5 9 M an u fa ct u re o f w ea ri n g ap p ar el 0 .2 8 7 0 .0 0 5 0 .0 1 1 2. 7 6 4 1 .9 24 0 .0 0 4 ±0 .0 1 5 ±0 .0 0 8 M an u fa ct u re o f w o o d a n d c o rk p ro d u ct s 0 .7 5 1 0 .0 0 9 0 .0 1 8 1 .4 3 5 0 .3 9 0 0 .0 1 0 ±0.0 1 5 ±0.0 0 8 M an u fa ct u re o f fu rn it u re a n d f ix tu re s 0 .0 7 8 0 .0 0 2 0 .0 0 5 ±0 .2 6 8 ±0 .3 21 0 .0 0 0 0 .0 0 1 ±0 .0 0 4 M an u fa ct u re o f p ap er p ro d u ct s ±0 .0 5 2 0 .0 2 6 0 .0 2 4 0 .0 7 2 0 .1 3 1 ±0 .0 0 2 0 .0 0 0 ±0 .0 0 2 P ri n ti n g, p u b li sh in g an d a ll ie d i n d u st ri es ±0.0 23 0 .0 1 9 0 .0 1 9 0 .0 5 7 0 .0 8 2 0 .0 0 0 0 .0 0 0 ±0.0 0 4 M an u fa ct u re o f b as ic i n d u st ri al c h em ic al s 0 .8 7 5 0 .0 6 6 0 .0 6 0 1 .5 5 0 0 .3 6 0 0 .0 7 8 ±0 .0 0 1 ±0 .0 0 4 4 P et ro le u m r ef in er ie s an d p et ro le u m d er iv at iv e ±0.8 1 9 0 .1 5 2 0 .0 0 4 ±0.3 9 7 2. 3 28 ±0.4 1 5 0 .3 4 3 0 .1 4 7 M an u fa ct u re o f ru b b er p ro d u ct s ±0.3 1 7 0 .0 1 7 0 .0 1 7 ±0.3 5 5 ±0.0 5 6 ±0.0 0 5 0 .0 0 0 ±0.0 0 3 M an u fa ct u re o f n o n -m et al li c m in er al p ro d u ct s 0 .3 24 0 .0 5 2 0 .0 7 3 0 .6 4 3 0 .2 4 1 0 .0 21 ±0.0 0 8 ±0.0 3 2 B as ic m et al i n d u st ri es ±0.3 5 2 0 .1 0 6 0 .0 6 1 0 .6 7 1 1 .5 8 0 ±0.0 9 7 0 .0 5 6 0 .0 3 6 M an u fa ct u re o f fa b ri ca te d m et al p ro d u ct s 0 .3 0 7 0 .0 4 4 0 .0 6 6 0 .2 1 2 ±0.0 7 3 0 .0 1 2 0 .0 0 2 ±0.0 3 3 M an u fa ct u re o f m ac h in er y ±0.1 5 3 0 .0 4 0 0 .0 4 1 0 .2 7 5 1 .0 3 8 /0 .0 1 3 ±0.0 0 7 ±0.0 0 7 M an u fa ct u re o f el ec tr ic al m ac h in er y ap p ar at u s 0 .6 7 8 0 .0 1 4 0 .0 2 0 3 .2 0 2 1 .5 0 4 0 .0 23 ±0.0 1 3 ±0.0 0 9 M an u fa ct u re o f tr an sp o rt at io n e q u ip m en t 2. 7 0 1 0 .0 3 1 0 .0 6 5 4 .5 9 3 0 .5 1 1 0 .1 26 ±0 .0 23 ±0 .0 4 4 O th er m an u fa ct u ri n g in d u st ri es ±0.1 4 0 0 .0 1 6 0 .0 1 7 0 .7 4 0 1 .0 23 ±0.0 0 4 ±0.0 0 4 ±0.0 0 4
The most productive five sub-sectors of the 1970 ± 76 episode are observed to be the following (ranked along their productivity rates):
(1) Manufacture of transportation equipment (270.1%) (2) Manufacture of industrial chemicals (87.5%)
(3) Manufacture of wood and cork products (except furniture) (75.1%) (4) Manufacture of textiles (72.7%)
(5) Manufacture of electrical machinery apparatus (67.8%)
The most important feature of these sectors is their small output and employment shares. The transportation equipment industry, for instance, which experienced a productivity growth of 270.1%, constitutes only 3.1% of total manufacturing output. The output and labour shares of the wood and cork products industry are 0.9% and 1.8%, respectively. The chemical and electrical industries exhibit similar behaviour, whereas the textile industry stands as an exception to this group with an output share of 13.8% and a labour share of 25.7%. The relatively lower output shares of the sectors in the most-productive group lead the second term, which indicates the productivity growth implied by reallocation of labour to be negative. Therefore, these sectors fail to be the leading sectors of the manufacturing industry for 1970 ± 76.
Next, we apply the same methodology for the 1981± 96 period in order to trace the dynamics of the structural changes that the Turkish economy has gone through under outward-orientation.1 2This investigation tries to identify the reflections of a
`truly open economy’ system on the structure of employment, productivity, and the leading-lagging relations among the sub-sectors of the manufacturing industry. Table 3 illustrates the sectoral output/labour shares, their growth rates, and the productivities of 19 sub-sectors for the state period.
From Table 3 we identify the following sectors with the highest productivity gains:
(1) Manufacture of wooden furniture and fixtures (546.0%) (2) Tobacco manufactures (300.7%)
(3) Other manufacturing industries13(238.2%)
(4) Manufacture of transport equipment (216.2%) (5) Printing, publishing and allied industries (207.4%)
The productivity values here reflect net direct changes in both employment and output levels at the sub-sectoral level. We find that the furniture industry, which experienced a 546.0% increase in productivity, exhibits an output growth of 1763.9%, accompanied by an employment growth of 188.5%. However, the output share of the sector is virtually very small (0.2%) to provide any significant impetus to the rest of the industry. The tobacco industry achieves a cumulative 300.7% of productivity growth via direct labour shedding: while it experiences an output growth of 93.9%, it decreases its employment by 51.6%. Similar observations are valid for the remaining most productive sectors as they point to slightly positive or outright negative reallocation weights (the second term in Equation (4)), indicating that these sub-sectors show almost no strength in productivity leadership. The output/labour shares, together with negative second terms in the productivity expression, prevent these sectors from being the `leading’ sectors of the Turkish manufacturing industry for the 1981± 96 period.
T a b le 2 . M an u fa ct u ri n g in d u st ry l ab o u r p ro d u ct iv it y d ec o m p o si ti o n , 1 9 8 1 ± 9 6 S ec to ra l la b o u r p ro d u ct iv it y gr o w th r at e S ec to ra l o u tp u t sh ar e S ec to ra l em p lo ym en t sh ar e R ea l o u tp u t gr o w th r at e (gi ) E m p lo ym en t gr o w th r at e (n1 ) N et p ro d u ct iv it y P ro d u ct iv it y b y re al lo ca ti o n o f la b b o u r R ea ll o ca ti o n w ei gh t F o o d m an u fa ct u ri n g 1 .3 1 4 0 .1 Á 04 0 .1 4 7 1 .7 0 4 0 .1 6 8 0 .1 6 0 ±0.0 3 5 ±0.2 0 6 B ev er ag e in d u st ri es 0 .7 9 4 0 .0 2 9 0 .0 1 4 0 .7 1 2 ±0.0 4 6 0 .0 2 2 0 .0 0 0 ±0.0 0 2 T o b ac co m an u fa ct u re s 3 .0 0 7 0 .0 4 2 0 .0 5 8 0 .9 3 9 ±0.5 1 6 0 .0 6 1 0 .0 4 2 ±0.0 8 1 M an u fa ct u re o f te xt il es 1 .1 4 2 0 .1 1 2 0 .2 0 9 1 .8 5 1 0 .3 3 1 0 .1 7 0 ±0.1 0 9 ±0.3 3 0 -M an u fa ct u re o f w ea ri n g ap p ar el 1 .6 9 0 0 .0 1 3 0 .0 3 1 1 3 .0 26 4 .2 1 4 0 .1 1 7 ±0 .2 1 7 ±0 .0 5 2 M an u fa ct u re o f w o o d a n d c o rk p ro d u ct s 1 .6 0 7 0 .0 0 7 0 .0 1 6 1 .5 29 ±0.0 3 0 0 .0 1 0 0 .0 0 1 ±0.0 27 M an u fa ct u re o f fu rn it u re a n d f ix tu re s 5 .4 6 0 0 .0 0 2 0 .0 0 5 1 7 .6 3 9 1 .8 8 5 0 .0 3 8 ±0 .0 1 4 ±0 .0 0 7 M an u fa ct u re o f p ap er p ro d u ct s 1 .9 0 4 0 .0 1 4 0 .0 2 3 1 .9 9 7 0 .0 3 2 0 .0 2 7 ±0 .0 0 1 ±0 .0 3 5 P ri n ti n g, p u b li sh in g an d a ll ie d i n d u st ri es 2 .0 7 4 0 .0 1 1 0 .0 1 3 3 .7 4 3 0 .5 4 3 0 .0 3 5 ±0.0 0 9 ±0.0 1 7 M an u fa ct u re o f b as ic i n d u st ri al c h em ic al s 1 .9 6 4 0 .0 7 8 0 .0 5 5 2. 5 4 5 0 .1 9 6 0 .1 8 3 ±0 .0 0 8 ±0 .0 3 9 P et ro le u m r ef in er ie s an d p et ro le u m d er iv at iv e 0 .5 4 6 0 .2 7 1 0 .0 1 3 0 .4 6 6 ±0.0 5 2 0 .1 4 0 ±0.0 1 3 0 .2 4 3 M an u fa ct u re o f ru b b er p ro d u ct s 1 .6 1 2 0 .0 1 5 0 .0 1 3 2. 0 25 0 .1 5 8 0 .0 2 8 ±0.0 0 2 ±0.0 1 4 M an u fa ct u re o f n o n -m et al li c m in er al p ro d u ct s 1 .3 7 0 0 .0 6 6 0 .0 7 4 1 .7 0 5 0 .1 4 1 0 .1 0 3 ±-. 0 1 3 ±0.0 9 1 B as ic m et al i n d u st ri es 1 .1 8 2 0 .0 7 5 0 .0 9 3 0 .6 8 7 ±0.2 27 0 .0 6 9 0 .0 28 ±0.1 2 2 M an u fa ct u re o f fa b ri ca te d m et al p ro d u ct s 1 .5 2 4 0 .0 2 9 0 .0 4 9 2. 0 7 0 0 .2 1 6 0 .0 5 4 ±0.0 1 6 ±0.0 7 4 M an u fa ct u re o f m ac h in er y 1 .8 1 0 0 .0 4 2 0 .0 6 2 1 .7 8 4 ±0.0 0 9 0 .0 7 6 0 .0 0 1 ±0.0 8 8 M an u fa ct u re o f el ec tr ic al m ac h in er y ap p ar at u s 1 .8 0 4 0 .0 3 4 0 .0 3 9 3 .0 4 3 0 .4 4 2 0 .0 8 9 ±0.0 21 ±0.0 4 8 M an u fa ct u re o f tr an sp o rt at io n e q u ip m en t 2 .1 6 2 0 .0 4 4 0 .0 6 2 3 .4 5 6 0 .4 0 9 0 .1 3 3 ±0 .0 3 6 ±0 .0 8 7 O th er m an u fa ct u ri n g in d u st ri es 2 .3 8 2 0 .0 1 2 0 .0 2 3 5 .4 3 6 0 .9 0 3 0 .0 5 3 ±0.0 3 3 ±0.0 3 7
We observe that 15 out of 19 sub-sectors under consideration display negative productivity gains from labour reallocation. This reveals that productivity contribu-tions originating from reallocation of labour from the sectors that have low output/ labour ratios to those sectors that have higher rates of productivity have been limited. Furthermore, one-third of the sectors have negative employment growth rates. Here, it is also interesting to note that none of the fast exporters of the post-1980 export boom reveal themselves in the leading category. In particular, the most important export sector, textiles, is observed to generate a negative rate of productivity contribution from labour re-allocation (with ± 10.9%), suggesting that the sector should more appropriately be characterized as lagging, rather than serving as a productivity leader.
In this vein, the only sub-sector that can be characterised as a `leader’ in Turkish manufacturing over the 1981± 96 period is found to be the `petroleum refineries and petroleum derivatives’ industry with a reallocation weight of 0.243. This sector displays an output share of 27.1% and an employment share of 1.3%. However, with an employment growth rate of ± 5.2%, the productivity by reallocation of labour term of this sector is found to be negative, causing the sector to display a cumulative productivity growth of 54.6%, which is quite below the average for the period at hand.
Concluding, we find that it is not possible to identify any viable `leading’ or `strong’ sub-sectors within the so-called `outward-oriented, competitive manu-facturing’ industry that would be able to generate effective leadership for the domestic economy over the 1981± 96 period.
5. Concluding Comments
In this paper, we investigated the distributional impact of the post-1970 accumulation patterns and technological change in the Turkish manufacturing industries. Our quantitative investigation of the long run dynamics through the Hodrick± Prescott filter revealed a fluctuating trend for manufacturing wages against a secular rising trend for labour productivity. The trend of the real wage rate, in particular, admitted an increasing path under the import substitutionist industrialisation period of the 1970s, and portrayed a deceleration for the outward-oriented, post-structural adjustment phase. We find that labour productivity growth indeed accelerated after the 1980 structural adjustment reforms. Average real product of labour in manufacturing, as measured by total manufacturing value added divided by the number of workers engaged in production, has increased by 110% over 1981± 96. However, real wages did not reveal a comparable increase and, as of 1996, earnings of wage-labour barely reach their 1980 level in real terms. This finding is in stark contrast with prognostications of the standard theory arguing that the expected productivity gains associated with increased competition in global commodity markets would translate into increased wage remunerations in the labour intensive sectors over which Turkey was claimed to hold comparative advantage. Our findings thus underscore that, given the poor vertical interlinkages of the industrial sectors under the historical conditions of peripheral capitalism, the vigorous export promotion polices and the state-led price incentives led to sporadic increases in productivity in the 1980s; yet, failed to generate a sustained increase in economic growth and accumulation.
Our further analysis on the decomposition of labour productivity in manufactur-ing revealed that, since the inception of the structural adjustment reforms and
outward-orientation, the underlying sources of productivity gains were not significantly altered; and that none of the leading export sectors of the 1980s could have generated sufficiently strong productivity contributions, nor admitted strong inter-industry linkages to serve as the leading sectors propelling the rest of the economy. With a meagre investment performance in manufacturing, the so-called export-led growth episode seems to have generated sizeable cost savings and surplus transfer to the recipient sectors, and could not generate sufficient contributions in productivity and employment. As such, the post-1980 export orientation could not support itself into productivity gains in the leading exporting sectors and could not be sustained as a viable strategy of `export-led industrialisation’. Lacking the necessary productivity investments in export manufacturing, the export gains based only on price incentives and subsidies have exhausted their impetus by the end of the decade. In conclusion, the Turkish adjustment experience throughout the post-1980 period reveals a process in which in a developing market economy trapped within the needs of integration with the world markets and the distributional requirements warranted by such re-orientation, the state apparatus became the bastion of privilege, regulating the mode of income redistribution within the society. The elements of this redistribution involved both direct mechanisms toward attaining favourable production and export subsidies, currency depreciation and wage suppression; as well as indirect mechanisms such as tax evasion on capital incomes, and conduct of a financial market development strategy that enabled massive income transfers to the rentier class. In the words of Pamukcu & Boer (1999, p. 21), `(all of these) point to the possible existence of a process of ª growth without transformationº occurring in Turkey, and this is certainly not what has been expected by ending the industrialization strategy based on (domestic demand-oriented) import-substitution which prevailed since the early sixties’.
Notes
A previous version of the paper was presented at the Third METU International Conference on Economics held in Ankara, September 1999. The authors’ names are in alphabetical order and do not necessarily imply authorship seniority. We are grateful to an anonymous referee of this Journal, Refet G Èurkaynak, Ute Pieper, Alpay Filiztekin, Oktar T Èurel, Korkut Boratav, Ahmet K Èose, and to the Conference participants for their encouragement and valuable comments; and to Selmin Altin for invaluable supplies of the database.
1. See, for example, Boratav et al. (2000); Onaran (2000); K Èose & Yeldan (1998a, 1998b); Yent Èurk (1997); Bulutay (1995), Maraslioglu & Tiktik (1991), Kepenek (1996), and ,Senses (1996); Kepenek and Yent Èurk (1996).
2. See SIS Manufacturing Annual Industry Surveys. 1996 was the most recent available data point at the time of writing. Wage earnings include all payments in the form of wages and salaries and per diems, gross income tax, social security, and pension fund premiums. It excludes social security, pension, contributions, and the like payable by the employer. It also includes overtime payments, bonuses, indemnities and payments in kind. Annual wages and salaries paid are compiled for production workers and other staff. Nominal values are deflated by the wholesale product index.
3. See Boratav & T Èurel (1993), ,Senses (1994), Celasun & Rodrik (1989), Uygur (1993), Yeldan (1995), and Celasun (1994) for a thorough overview of the post-1980 Turkish structural adjustment reforms. For a quantitative assessment of the export subsidisation programme, see Milanovic (1986) and Togan (1996).
4. State Institute of Statistics, Manufacturing Industry Surveys. See also K Èose & Yeldan (1998b), YentÈurk (1997), Yeldan (1999), and Sahinkaya (1993) on the behaviour of the profit margins (mark-ups) under the Turkish structural adjustment episode.
5. See ÈOzatay (1999); Balkan & Yeldan (1998); Sel‡uk (1997); Boratav et al. (1996); Ekinci (1998); Rittenberg (1991) and Yent Èurk (1999) for an extensive discussion of the post-financial liberalization macroeconomic adjustments in Turkey.
6. See, for example, Hodrick & Prescott (1997) and Kydland & Prescott (1990).
7. For a further test of robustness, we have also experimented with various values for l such as 100, 200, 800, 3200, 6400 and 12800 to filter the data. We observed that the time paths of both the trend and cyclical components are quite stable under the relatively wide spectrum of l and match each other uniformly. Thus, we rely on our initial choice of l . Further elaborations using the Hodrick± Prescott-based business cycle approach for the Turkish economy can be found in Metin-Ozcan et al. (1999) and Alper (1998) where the authors have also relied on l = 400 for annual data.
8. See Boratav (1991) for a narrative support of this claim.
9. Altiok (1998) further provides an excellent source of manufacturing sector data with relevant parameters in a tabular form.
10. For a similar application of the methodology used here, refer to Syrquin (1986) and Pieper (1998).
11. The wholesale price index is used in converting the nominal magnitudes to real terms for both periods.
12. We omit the period of 1977± 80, as these years were characterised by a severe balance of payments crisis, and productivity changes displayed mostly erratic tendencies given abrupt policy interventions.
13. Includes manufacture of plastic products, manufacture of professional and scientific and measuring and controlling equipment, and other manufacturing industries, not elsewhere classified.
References
Alper, E. (1998) Nominal stylized facts of Turkish business cycles, METU Studies in Development, 25(2), pp. 233± 244.
Altõ ok, M. (1998) 1980 sonrasi T Èurkiye’de sermaye birikimi ve kriz, METU Studies in Development, 25(2), pp. 245± 276.
Aydogus, O. (1993) T Èurkiye imalat sanayiinde ithal ikamesi, ihracat artisi ve toplam faktÈor verimliligi iliskileri: 1971± 88, METU Studies in Development, 20(4), pp. 453± 474.
Balkan, E. & Yeldan, E. (1998) Financial liberalization in developing countries: the Turkish experience, in: R. Medhora & J. Fanelli (Eds) Financial Liberalization in Developing Countries (Macmillan Press). Boratav, K. (1983) T Èurkiye’de pop Èulizm: 1963± 1976, Yapit, Kasim.
Boratav, K. (1991) T Èurkiye’de sosyal siniflar ve bÈolÈus Èum (Istanbul, Ger‡ek).
Boratav, K. & T Èurel, O. (1993) Turkey, in: L. Taylor (Ed.) The Rocky Road to Reform, (Cambridge, MA & London, MIT Press).
Boratav, K., Keyder, . & Pamuk, S. (1984) Krizin dinamikleri ve TÈurkiye’nin alternatif sorunu. Boratav, K., T Èurel, O. & Yeldan, E. (1996) Dilemmas of structural adjustment and environmental
policies under instability: post-1980 Turkey, World Development, 24(2), pp. 373± 393.
Boratav, K., Yeldan, E. & K Èose, A. (2000) Globalization, distribution and social policy: Turkey: 1980± 1998, CEPA and The New School for Social Research, Working Paper Series, No 20, February. Bulutay, T. (1995) Employment, Unemployment and Wages in Turkey, (ILO/SIS, Ankara).
Celasun, M. (1983) Sources of industrial growth and structural change: the case of Turkey, World Bank
Staff Working Paper, No. 614.
Celasun, M. (1994) Trade and industrialization in Turkey: initial conditions, policy and performance in the 1980s, in: G. K. Helleiner (Ed.) Trade Policy and Industrialization in Turbulent Times, (London, Routledge).
Celasun, M. & Rodrik, D. (1989) Debt, adjustment and growth: Turkey, in: J. Sachs and S. M. Collins (Eds) Developing Country Debt and Economic Performance, Country Studies, Book IV (The University of Chicago Press).
Chenery, H., Robinson, S. & Syrquin, M. (Eds.) (1986) Industrialization and Growth: A Comparative
Study (London, Oxford University Press).
Cizre-Sakallõ oÆglu, ÈU. & Yeldan E. (2000) Politics, society and financial liberalization: Turkey in the 1990s, Development and Change, 31(1), pp. 481± 508.
Ekinci, N. (1998) T Èurkiye ekonomisinde b Èuy Èume ve kriz dinamikleri, Toplum ve Bilim, No. 77, pp. 7± 27.
Ercan, H. (1999) Non-wage labor cost in Turkish manufacturing industry: an international comparison, in: T. Bulutay (Ed.) The Burdens Related with Turkish Labor Markets and Policies (Ankara, State Institute of Statistics).