NOVEL HYBRID PEROVSKITE CATALYSTS
FOR DE-NO
XAPPLICATIONS
A THESIS SUBMITTED TO
THE GRADUATE SCHOOL OF ENGINEERING AND SCIENCE
OF BILKENT UNIVERSITY
IN PARTIAL FULFILLMENT OF THE REQUIREMENTS FOR
THE DEGREE OF
MASTER OF SCIENCE
IN
CHEMISTRY
By
Kerem Emre Ercan
ii
NOVEL HYBRID PEROVSKITE CATALYSTS FOR DE-NOX APPLICATIONS
By Kerem Emre Ercan September, 2015
We certify that we have read this thesis and that in our opinion it is fully adequate, in scope and in quality, as a thesis for the degree of Master of Science.
_______________________ Assoc. Prof. Dr. Emrah Özensoy (Advisor)
_______________________ Assist. Prof. Dr. Bilge Baytekin
_______________________ Assoc. Prof. Dr. Okan Esentürk
Approved for the Graduate School of Engineering and Science:
_______________________ Prof. Dr. Levent Onural Director of the Graduate School
iii
ABSTRACT
NOVEL HYBRID PEROVSKITE CATALYSTS
FOR DE-NO
XAPPLICATIONS
Kerem Emre Ercan M.S. in Chemistry
Advisor: Assoc. Prof. Dr. Emrah Özensoy September, 2015
The main purpose of this study is to identify the nature of hybrid perovskites in the form of LaCoxMn1-xO3 (x=0.0-1.0) for catalytic De-NOx applications.
Characteristic structure, thermal stability and NOx/SOx adsorption/release properties
of perovskites were studied by XRD, BET, XPS, in-situ FTIR, ex-situ FTIR, TEM, BET, TPD and TPR. LaCo0.8Mn0.2 and LaCo0.7Mn0.3O3 were found to yield the
highest NOx storage Capacity (NSC) among other investigated perovskites due to
their optimized B-site composition. NOx and SOx adsorption experiments pointed out
that B-site substitution did not have a significant alteration on adsorption geometries of corresponding adsorbates. NOx uptakes of the investigated perovskites were
observed to be enhanced via H2 reduction as verified by IR results. Furthermore, N2
(28 a.m.u) release monitored by QMS during NOx TPD revealed direct N-O bond
activation and complete reduction of NOx species under certain conditions. SOx
adsorption and reduction experiments suggested that SOx reduction via H2 is more
effective for Mn-enrich perovskites, since Co-enriched materials formed irreversible sulfate species. It was observed that adsorbed NOx species can be readily replaced by
SOx species in the co-presence of NOx and SOx. It was also demonstrated that the
iv
can be modified by fine-tuning the substitution at the B-site. Based on ex-situ FTIR results, it was established that Co-O linkages could be gradually replaced with Mn-O linkages by increasing the Mn loading in the perovskite composition. Furthermore, specific surface areas (SSA) of hybrid perovskites were found to be enhanced by increasing the Mn loading. Current results suggest that hybrid perovskites are promising novel catalytic architectures for De-NOx applications due to their high
NSC and versatile chemical structure which can be fine-tuned to enhance SOx
tolerance, redox properties and thermal stability.
v
ÖZET
De-NO
xUYGULAMALARI İÇİN YENİ NESİL HİBRİT
PEROVSKİTLER
Kerem Emre Ercan Kimya, Yüksek LisansTez Danışmanı: Doç. Dr. Emrah Özensoy Eylül, 2015
Bu çalışmanın temel amacı, katalitik De-NOx uygulamalarına yönelik,
LaCoxMn1-xO3 tipi hibrit perovskit malzemelerinin, yapısal ve işlevsel özelliklerinin
incelenmesidir. Perovskitlerin karakteristik yapısı, termal dayanıklılıkları ve NOx/SOx adsrobsiyon/salınım özellikleri XRD, BET, XPS, in-situ FTIR, ex-situ
FTIR, TEM, BET, TPD ve TPR teknikleri kullanılarak çalışılmıştır. Diğerlerine kıyasla, LaCo0.8Mn0.2veLaCo0.7Mn0.3O3 perovskitlerinin optimize edilmiş yüzeyleri
sayesinde (yani özel B-noktası kompozisyonu nedeniyle),en yüksek NOx depolama
kapasitesine sahip malzemeler oldukları belirlenmiştir. NOx ve SOx deneyleri, B
noktalarına ait kompozisyonun, katalizör yüzeyine bağlanan türlerin adsorpsiyon geometrisi üzerinde önemli bir değişikliğe yol açmadığını göstermiştir. Diğer taraftan, NOx emiliminin H2 indirgenmesi sonrasında arttığı, IR deneyleriyle
gösterilmiştir. Ayrıca, QMS deneylerinde ölçülen N2, özel koşullar altında, hibrit
katalizörlerin N-O bağ aktivasyonunu başarıyla gerçekleştirebildiğini ve NOx
türlerinin tamamen indirgenebildiğini göstermektedir. Mn’ce zengin perovskitler üzerindeki SOx türleri, H2 ile oldukça etkin bir şekilde indirgenerek, bertaraf
vi
nedeniyle kükürt giderim sürecinin daha verimsiz olduğu gözlenmiştir. SOx türleri ve
NOx türlerinin aynı anda var olduğu durumda, katalizör yüzeyindeki aktif bağlanma
noktalarına dair rekabeti, SOx türlerinin belirgin bir üstünlükle kazandığı
saptanmıştır. Perovskitlerin kristal örgülerindeki oksijen miktarı, oksijen boşlukları ve indirgenme profilleri; B-bölgesindeki kompozisyona bağlı olarak farklılıklar göstermektedir. Perovskit kristal örgüsündeki, Co-O bağlarının, yapıdaki artan Mn yüklemesiyle birlikte, Mn-O bağlalarıya yer değiştirdiği, ex-situ FTIR deneyleriyle gösterilmiştir. Hibrit perovskitlerin spesifik yüzey alanları, yapıdaki Mn yüklemesinin artırılmasına bağlı olarak artmaktadır. Mevcut çalışmalar çerçevesinde elde edilen deneysel sonuçlar; hibrit perovskitlerin yüksek NOx depolama kapasitesi
ve yüksek SOx toleranslarına sahip olduklarını ve yapılarının sentetik olarak kontrol
edilmesiyle, yüzey kimyasal özelliklerinin, redox davranışlarının, NOx/SOx türleriyle
etkileşimlerinin değiştirilerek, yüksek performansa sahip, özgün De-NOx
katalizörlerinin tasarımına olanak verdiğini göstermektedir.
vii
Acknowledgement
First, I would like to thank Assoc. Prof. Dr. Emrah Özensoy for his continuous support of my Ms. study and related research, for his motivation and great knowledge. His guidance motivated me to be a part of his research group and write this thesis. It has been a great pleasure working with him.
I would like to thank Zafer Say for his contributions about spending his valuable time with me during my graduate research.
I also send my thanks to Giuseppe Pantaleo , Anna Maria and Nadia Fichera (CNR- ISMN, Italy) for their collaboration.
I also would like to thank Zehra Aybegüm Samast , Merve Tohumeken, Merve Doğaç Kurt , Mustafa Karatok , Deniz Altunöz Erdoğan, Evgeny Vovk for their scientific contributions and companionship.
I would like to thank Asst. Prof. Dr. Bilge Baytekin and Assoc. Prof. Dr. Okan Esentürk for their important contributions to evaluation process of this study.
I want to thank to TUBİTAK for their financial Support (project code: 213M585). I also would like to pronounce my sincere feelings to Ahmet Uçar, Sinem Gürbüz, Emre Köken, Pelin Altay, Aydın Kahriman, İdris Tuncer Yıldız, Emre Turna, Ali Murat Ünsal, Ezgi Yılmaz, Cansu Kaya, Esra Deniz Soner and Taha Yıldırım for their great support and friendship.
Lastly, I wish to announce my deep gratitude’s to my parents; my father Adem Ercan, my mother Meryem Ercan and my sisters Beyza Nur Ercan and Melike Nur Ercan. There are not enough words to express my deep loyalty to them. I could not imagine a life without their existence. I wish them to have long and peaceful life.
viii
“Dedicated
ix
Contents
Chapter 1 ... 1
Introduction ... 1
1.1. Air Pollution and NSR Technologies ... 1
1.1.1. Air Pollution ... 1
1.1.2. NOx Storage Reduction (NSR) Technology ... 1
1.2. Properties of Perovskites in Relevance to De-NOx Catalysis ... 2
1.2.1. Characteristics of Perovskites ... 2
1.2.2. Redox Properties of Perovskites... 5
1.2.3. Oxygen Mobility of Perovskites... 7
1.2.4. Surface Acidity of Perovskites ... 9
1.2.5. General View of Oxidation Reactions on Perovskites ... 10
1.2.6. NOx Decomposition on Perovskites ... 12
1.2.7. NSR Systems Utilizing Perovskites ... 15
Chapter 2 ... 17
Experimental ... 17
2.1. Sample Preparation ... 17
2.1.1. Synthesis of Simple LaMnO3 and LaCoO3 Perovskites ... 17
2.1.2. Synthesis of LaCoxMn1-xO3 Type Hybrid Perovskites ... 18
x
2.2.1. XRD Patterns ... 20
2.2.2. BET Measurements ... 20
2.2.3. TEM Imaging and EDX Mapping ... 20
2.2.4. XPS Measurements ... 21
2.2.5. Ex-situ Infrared Measurements ... 21
2.2.6. In-situ Infrared Measurements ... 22
2.2.7. TPD Experiments ... 25
2.2.8. O2 TPD Experiments over Perovskites ... 27
2.2.9. H2 TPR Experiments over Perovskites ... 27
Chapter 3 ... 28
Results and Discussion ... 28
3.1. Structural Characterization of Perovskites ... 28
3.1.1. XRD Analysis of Simple and Hybrid Perovskites ... 28
3.1.2. BET Analysis of Hybrid and Simple Perovskites ... 31
3.1.3. TEM Imaging and EDX Analysis ... 33
3.1.4. XPS Analysis of Simple and Hybrid Perovskites ... 35
3.1.5. Ex-situ Infrared Analysis... 38
3.1.6. NOx Adsorption on Fresh and Reduced Perovskites ... 40
3.1.7. NOx TPD of Fresh and Reduced Perovskites ... 49
xi
3.1.9. SOx and NOx co-Adsorption on Perovskites ... 62
3.1.10. O2 TPD of Perovskites ... 67
3.1.11. H2 TPR Experiments of Perovskites ... 69
Chapter 5 ... 71
Conclusion ... 71
xii
List of Figures
Figure 1. Schematic representation of the cubic perovskite crystal structure [11]. .... 4 Figure 2. a) Rhombohedral and b) orthorhombic crystal structure of perovskites [12].
... 5
Figure 3. Catalytic oxidation process of H2, CO and CH4 upon LaMnO3 and LaCO3
[38]. ... 11
Figure 4. Crystal structure of perovskites in the form A2BO4 with active sites for NO
decomposition (T′, T, and T*) and possible routes (a,b) [51]. ... 14
Figure 5. Schematic representation of the compositional variation of ... 18 Figure 6. Schematic example of in-situ FTIR and TPD system[78]... 23 Figure 7. XRD patterns of LaCoxMn1-XO3 type perovskites x= 0.0-0.5 calcined at
973 K... 29
Figure 8. XRD patterns of LaCoxMn1-XO3 type perovskites x= 1.0-0.5 calcined at
973 K... 30
Figure 9. Specific surface area measurements of LaCoxMn1-XO3 type perovskites
(after calcination at 973 K) where x= 0.0-1.0. ... 32
Figure 10. TEM images and EDX spectra for a1, a2, a3 and a4) LaCo0.8Mn0.2O3, b1,
b2, b3 and b4)LaCo0.5Mn0.5O3 and c1,c2,c3 and c4) LaCo0.2Mn0.8O3 ... 34 Figure 11. Quantitative analysis of surface atomic ratios via XPS for LaCo0.xMn 1-xO3 type perovskites (x=0.0-1.0) calcined at 973 K. ... 35
xiii
Figure 12. Relative Co surface atomic ratio with respect to the total Co and Mn
surface atomic ratios (i.e. relative Co content present in all of the B sites comprised of Co and Mn species) for hybrid perovskites LaCo0.xMn1-xO3 (x=0.0-1.0). ... 36 Figure 13. a) 3D-representation of the ex-situ FTIR spectra of the fresh LaCo0.xMn 1-xO3 perovskites (x=0.0-1.0) after calcination at 973 K, b) 2D-representation of the
ex-situ FTIR spectra of the fresh LaCo0.xMn1-xO3 perovskites (x=0.0-1.0) after
calcination at 973 K. ... 39
Figure 14. In-situ FTIR specta corresponding to the stepwise NO2 adsorption and
saturation of fresh LaCo0.5Mn0.5O3 catalyst at 323 K. ... 41 Figure 15. Stepwise NO2 adsorption on LaCoxMn1-xO3 hybrid perovskites where
(0≤x≤0.3) at 323 K. ... 43
Figure 16.Stepwise NO2 adsorption on LaCoxMn1-xO3 hybrid perovskites where
(0.4≤x≤0.7) at 323 K. ... 44
Figure 17. Stepwise NOx adsorption of LaCoxMn1-xO3 type perovskites (0.8≤x≤1.0)
at 323 K. ... 45
Figure 18. NOx adsorption (5 Torr NO2) spectra of reduced and fresh
LaCo0.5Mn0.5O3 at 323 K ... 46 Figure 19. In-situ FTIR spectra for NO2 adsorption on reduced and fresh LaCoxMn 1-xO3(0≤x≤0.5)at 323 K ... 47 Figure 20. NOx adsorption spectra of reduced and fresh LaCoxMn1-xO3 (0.6≤x≤1) at
323 K... 48
Figure 21. N2O and N2 TPD signals of pre-reduced and fresh LaCoxMn1-xO3 (0≤x≤1)
xiv
Figure 22. O2 TPD signals of pre-reduced and fresh LaCoxMn1-xO3 (0≤x≤1) catalysts
obtained after saturation with NO2 at 323 K... 51 Figure 23. NO and NO2 TPD signals of pre-reduced and fresh LaCoxMn1-xO3
(0≤x≤1) catalysts obtained after saturation with NO2 at 323 K. ... 53 Figure 24. Total relative NOx storage capacities of reduced and fresh catalysts in the
form of LaCoxMn1-xO3 (0≤x≤1) obtained after saturation with NO2 at 323 K.. ... 54 Figure 25. In-situ FTIR spectra for SOx adsorption and subsequent reduction with
hydrogen for LaCo0.5Mn0.5O3 ... 58 Figure 26. In-situ FTIR spectra for SOx adsorption and subsequent reduction with
hydrogen for LaCoxMn1-xO3 (0.0≤x≤0.5) ... 59 Figure 27 . In-situ FTIR spectra for SOx adsorption and subsequent reduction with
hydrogen for LaCoxMn1-xO3 (0.6≤x≤1.0) ... 60 Figure 28. In-situ FTIR spectra for SOx and NOx co-adsorption IR on
LaCo0.5Mn0.5O3. ... 62 Figure 29. In-sıtu FTIR SOx and NOx co-adsorption IR spectra for LaCoxMn 1-xO3(x=0.0-0.5) ... 64 Figure 30. In-sıtu FTIR SOx and NOx co-adsorption IR spectra for LaCoxMn1-xO3 65
Figure 31. Oxygen TPD profiles for LaCoO3, LaCo0.5Mn0.5O3and LaMnO3
samples………67
xv
List of Tables
Table 1.Amount of precursors used in the synthesis of simple perovskites ... 18 Table 2.Amounts of materials used in the synthesis of hybrid perovskites. ... 19 Table 3.Average Particle Size Calculation of LaCoxMn1-XO3 perovskites by using
Scherrer equation via XRD data………... 28
Table 4.SSA values of LaCoxMn1-xO3 type hybrid perovskites obtained via BET
measurements... 33
Table 5.Co/La and Mn/La surface atomic ratios (i.e. relative surface composition of
B sites with respect to that of A sites) for LaCo0.xMn1-xO3 type hybrid perovskites
(x=0.0-1.0) obtained via XPS ... 37
Table 6.Surface atomic ratios of all surface atoms (C,O,La,Co,Mn) of LaCo0.xMn 1-xO3 type perovskites (x=0.0-1.0) obtained via XPS. ... 37 Table 7.Integrated TPD desorption signals and total relative NOx storage values for
reduced perovskite catalysts LaCoxMn1-xO3 (0≤x≤1)………55
Table 8.Integrated TPD desorption signals and total relative NOx storage values for
fresh perovskite catalysts LaCoxMn1-xO3 (0≤x≤1). ... 56 Table 9.Integrated oxygen desorption signals obtained in O2-TPD experiments over
xvi
List of Abbreviations
BET: Brunauer-Emmett-Teller
EDX: Energy-Dispersive X-ray spectroscopy FTIR: Fourier Transform Infrared Spectroscopy ICDD: International Center for Diffraction Database IR: Infrared
JCPDS: Joint Committee on Powder Diffraction Standards NIST: National Institute of Standards and Technology NOx: N2O, NO, NO2
NSR: NOx Storage and Reduction
NSC: NOx Storage Capacity
PGM: Platinum Group Metal
PID: Proportional Integral Derivative RT: Room Temperature
QMS: Quadruple Mass Spectrometer SCR: Selective Catalytic Reduction SOx: SO2+O2
TCD: Thermal Conductivity Detector TEM: Tunneling Electron Microscopy TPD: Temperature Programmed Desorption TPR: Temperature Programmed Reduction XPS: X-ray Photoelectron Spectroscopy XRD: X-Ray Diffraction
Chapter 1
Introduction
1.1.Air Pollution and NSR Technologies
1.1.1. Air Pollution
Air pollution level is one of the leading global problems [1]. In the last decades, environment agencies constantly reduced the toxic gas levels allowed in the atmosphere such as NOx, SOx and CO by applying very strict emission
regulations. Principally, NOx emission originates mostly from mobile sources
(such as trucks, automobiles etc…), and also contributes to the greenhouse effect [2], [3]. Thus, significant scientific and engineering efforts are currently being conducted in order to design new catalysts that can meet challenging emission regulations.
1.1.2. NOx Storage Reduction (NSR) Technology
Classical three way catalysts are not efficient in the removal of NOx under
lean burn (i.e. oxidizing) conditions. Hence, alternative technologies have been designed to decontaminate NOx species under lean-burn conditions. Direct
(homogeneous) thermal decomposition of NO (i.e. NO 1/2N2 + 1/2O2) without
a catalyst is feasible, however this process requires relatively high activation energy limiting the reaction kinetics significantly. Selective catalytic reduction
2
(SCR) is a promising technology to reduce NOx with hydrocarbons (HC), NH3 and
H2 under oxidizing conditions. On the other hand, there are certain drawbacks of
SCR catalysts associated with the narrow operational temperature range, low structural durability and insufficient activity [4],[5]. Hence, NSR technologies have been developed as a contender technology to meet NOx emission regulations.
NSR systems store NOx species selectively on the catalyst and subsequently
reduce the stored NOx with the help of excess fuel. NSR systems operate in the
exhaust systems in two successive cycles. In the first cycle, engine works under lean (excess oxygen) conditions and NSR catalyst stores NOx in the solid state.
Then, the engine switches temporarily to the rich (leading to reducing agents like HC, H2, CO) cycle in order to reduce trapped NOx to N2 [3]. NSR systems do not
require any external reducing agent such as NH3 (i.e. urea) as in the case of SCR
systems. However NSR catalysts reveal various challenges associated with limited sulfur tolerance, high cost for Platinum Group Metals (PGM) and extra fuel penalty originating from rich cycles. Thus, NSR systems need to be optimized by designing catalytic architectures with low cost, high NOx storage capacity (NSC),
high thermal stability and enhanced sulfur tolerance.
1.2.Properties of Perovskites in Relevance to De-NOx Catalysis
1.2.1. Characteristics of Perovskites
Perovskites have been studied intensely in the heterogeneous catalysis literature since 1970’s. Initials studies in the literature showed that perovskites have a significant potential to be used as reduction and oxidation (redox)catalysts
3
with a potential to replace precious PGM [6]–[9]. More recent studies also showed that perovskites may also be optimized to be utilized in modern NSR systems [10].
Perovskite-based catalysts exist (ideally) in the form of ABO3 where A and
B are metal cations and O is the oxide anion. A is the larger cation which can be an alkaline, alkaline earth or lanthanide cation while B is a transition or post-transition metal cation. In the crystal structure, A and B are found in 12-fold and 6- fold coordination; respectively. Moreover, in the unit cell of perovskites, A cations are positioned in the center, B cations are located on the corners and O 2-anions are positioned on the edge-centers (Figure 1) [11].An important aspect of perovskite formulations is the fact that, A and B sites can be filled with hetero-atoms leading to complex formulations such as AxA'1-xByB'1-yO3±α . These
compositional lattice modifications of the perovskites lead to a rich variety of electronic, chemical, optical and thermal alterations not only in their bulk properties but also in their surface characteristics.
4
Figure 2. Schematic representation of the cubic perovskite crystal structure [11].
Moreover, stability of the crystal structure is another important issue for the perovskite systems. A-O and B-O bond distances in the unit cell dictate an important factor “t” which is given by:
t = rA + rO/ √2 (rB + rO) (1)
rA ,rB and rO correspond to the ionic radii of A/B cations and O2- anions in the
crystal structure; respectively. “t” is a term called the “tolerance factor”. Cubic crystal structure is preferred for 0.75 < t <1.0. To have an ideal cubic perovskite structure, t value should be close to 1, which typically requires high synthesis temperature [11]. On the other hand, insertion of A site cations into the crystal structure may commonly distort the BO6 octahedron leading to different
crystalline phases such as rhombohedral or orthorhombic structures (Figure 2) [12].
5
Figure 3. a) Rhombohedral and b) orthorhombic crystal structure of perovskites
[12].
1.2.2. Redox Properties of Perovskites
Redox properties of perovskites systems are critical for the catalytic processes. Oxidation states of A and B site can be manipulated by loading different cations. Substitution of the B site have a direct impact on the catalytic properties of perovskites where the effect of A site elements are rather indirect [13]. A-Site cations are surrounded by BO6 octahedra providing a more stable
oxidation state and a relatively weaker redox activity. Catalytic activities of LnBO3 (Ln = rare earth elements) are mostly dictated by the redox properties of B
site cations[14], [15]. Futai et al. [16] studied the reduction profiles of LnCoO3
6
peaks were observed at 400 oC and 625 oC. Low temperature reduction peak was associated with Co3+ → Co2++ e- while the second reduction peak was attributed to Co2+ → Co0+ 2e- (i.e. metallic cobalt formation). A Similar work was carried out also by Crespin et al. [17] who reported the reduction of perovskites process in the following steps;
2LnCoO3+ H2→ 2LnCoO2.5 + H2O (1)
2LnCoO2.5+ 2H2→ Ln2O3+ 2Co + 2H2O (2)
As mentioned before, reaction (2) represents low temperature partial reduction whereas reaction (3) corresponds to the irreversible reduction of Co2+ to metallic cobalt. Reduction temperatures of such perovskites were found to be strongly influenced by the calcination temperature used in the perovskite synthesis. Irusta et al.[18] reported that as the calcination temperature increases, reduction temperatures of Co-based perovskites shifted towards higher temperatures for both of the reduction steps. It was argued that as the calcination temperature increases, mean size of crystallite size increases while the specific surface area of the perovskites decreases. These large crystals were suggested to yield higher diffusion barriers for H2 and thus higher reduction temperatures [19].
Modification (partial substitution or complete substitution) of A site alters the reducibility of the perovskite structure. Using larger ions in the A site of the perovskite systems yields less-reducible structures. In particular, reduction temperature of the Co-based (ACoO3) perovskites with different A site cations
7
more stable structures [20]. Furthermore, binding energy of the core level electrons of the atoms constituting the perovskite lattice is another parameter relevant to the relative redox properties. According to Futai et al, maximum reduction temperature of the Co-based perovskites increases as the O1s binding energy of the surface oxygen species increases. However, there is no direct relation with the size of the A site cation and the binding energy of the surface O1s species where a complex ranking is obtained for the O1s states as a function of perovskite composition : LaCoO3< PrCoO3< NdCoO3< SmCoO3< EuCoO3>
GdCoO3> TbCoO3 < DyCoO3 [16]. Partial substitution of A site changes the
reduction pattern of perovskites. For instance, incorporation of Sr in La1−xSrxCoO3
systems favors the formation of Co4+ species as well as oxygen vacancies which in turn, lead to a more reducible structure. Similar work has been done for Mn based (AMnO3) perovskite systems. Sr2+ loading in the La1−xSrxMnO3 systems also
favors the formation of Mn+4 [21].
1.2.3. Oxygen Mobility of Perovskites
Oxygen mobility and the vacancy diffusion in perovskites are crucial in their catalytic redox properties. TPD is one of the most common techniques to investigate the oxygen release patterns of perovskites. Perovskites are comprised of numerous different types of oxygen species with various oxidation states, coordination configurations and locations in the unit cell. However, oxygen release from perovskite structures are observed through only two discernible desorption states namely, α-O2 or β-O2 states. α-state is associated with surface
8
bound oxygen states desorb from the surface at relatively low temperatures (i.e. α-oxygen). On the other hand, β-oxygen is released from bulk at higher temperatures. TPD experiments on La0.99Co0.86Fe0.15O3−o indicate that increasing
calcination temperature monotonically shifts the α-O2 peak to higher temperatures
while the total amount surface oxygen reveals a non-monotonic trend where the oxygen release form α-O2 peak first increases then decreases [23]. In contrast,
amount of desorbing β-O2 species continuously increases with increasing
calcination temperature [23] and desorption of β-O2 is not only desrobed from
monolayer (in lattice) but also multiple layers may contribute β-O2 desroption
[19].Teraoka et al. reported that desorption patterns of α-O2 and β-O2 states are
interconnected to the defect properties of perovskites [24].Furthermore, partial substitution of Sr2+ was found to enhance the desorption of α-O2 released from
Co-based perovskites. Desorption of β-O2 leads to the reduction of the transition
metals (i.e. B-site cations) to lower oxidation states [24]–[26].Furthermore, α-O2
desorption in La1−xSrxCoO3 was observed to closely depend on the oxygen
vacancy density which can be modified by varying Sr loading as x=0.4, 0.6 [27], [28].Isotopic exchange using 16O/18O is also another important technique to study oxygen mobility. La1−xSrxCoO3 type perovskites were found to accept gaseous 18O
into the lattice. Low loadings of Sr2+ does not affect the exchange rate of 16O/18O at low temperatures such 150 0C; however exchange rate drastically increases at higher temperatures (e.g. 300 0C) [28]. Excessive Sr2+ substitution of La1−xSrxCoO3 such as x=0.6 enhances the exchange rate even at low temperatures
(i.e. 150 0C) [28]. Nakamura et al. concluded that Sr2+ substitution resulted in the enhancement of oxygen vacancies and raised the oxygen mobility from surface to
9
bulk [28]. Nitadori et al. indicated that oxygen adsorption capacity depended on the oxygen vacancy, oxidation states of A and B sites, revealing a strong influence on catalytic reactivity [29]. Royer et al. showed that morphological structure of the perovskites could be important for oxygen mobility. They demonstrated that materials with comparable chemical compositions may show different oxygen mobility due to unlike crystallite size [30]. Yang et al. reported that there are dissociation and adsorption of gas phase oxygen and diffusion may follow two major pathways namely, (i) direct diffusion to the bulk or (ii) diffusion into the grain boundaries [31].
1.2.4. Surface Acidity of Perovskites
Surface Acidity is a key parameter to identify interaction between NOx
species and perovskite surfaces. NOx species are acidic species therefore;
decreasing surface acidity of perovskites strengthens the NOx adsorption under
operational conditions. However, extremely high surface acidity weakens the NOx
adsorption strength and thus the NSC. Therefore, an optimum surface acidity is needed to enhance the NOx storage and reduction properties of perovskites. CO
adsorption performed under ambient conditions revealed a vibrational feature at around 2058 cm-1 which is independent of the La/Co ratio [32]. Centers of Lewis Acid sites with CO interaction which are detected by IR signals as carbonate species assigned in between 1250-1750 cm−1 [33]–[35] are distributed on the surface of perovskites and this interaction disappears at higher temperatures hence spectral bands shift to higher wave numbers 2280-2400 cm-1 which are related CO2 species where the temperature higher than 150 OC [32]. Kuhn and
10
Ozkan et al. studied the surface properties of cobaltites in the form of La0.6Sr0.4CoyFe1−yO3−δ with y=0.1, 0.2 and 0.3. Their results suggested that
amount of basic sites were proportional to the Co content. Substitution of La3+ with Sr2+ altered the charge balance in the lattice and produce acidic sites [36]. However, Natile et al. confirmed that the acidic character of LaCoO3 is promoted
by La3+ as well as Co3+ [32]. Besides, Kuhn and Ozkan et al. also reported that it is difficult to oxidize surface Co ions as compared to Fe ions leads to the (Co enrich surface) formation of intense oxygen vacancies and allows rapid diffusion of oxygen into the lattice , means that based on number of oxygen defect sites Co ions are increasing the surface acidity [36]. LaMnO3+y type perovskites were
suggested to be basic perovskites [37]. Density functional theory calculations and CO2 adsorption were used to identify the surface basicity of LaMnO3+y.These
former experiments demonstrated that CO2 adsorption was weak on the MnO
2-terminated surface. The strongest adsorption on La cations was correlated with the presence of Fs-centers. As a result, adsorptions on cationic sites resulted by weak
basic sites [37].
1.2.5. General View of Oxidation Reactions on Perovskites
In the perovskite structure (ABO3), B site cations, which are the
catalytically active sites, typically come along with two different oxidation states (i.e. +2 and +3). LnBO3 perovskites where Ln corresponds to lanthanum and B
corresponds to Mn, Ni, Fe, or Co are known to be some of the most active perovskites for CO oxidation reactions [11]. However, H2 bond activation or CH4
11
oxidation (Figure 3) is not effective at low temperatures on such perovskites as compared to noble metals (e.g. Pd) dispersed on conventional metal oxides.[38].
Figure 4. Catalytic oxidation process of H2, CO and CH4 upon LaMnO3
and LaCO3 [38].
There are two different mechanism defined for the oxidation reactions over perovskites. Suprafacial mechanism is considered for low temperature oxidation reactions which involves the utilization of exclusively surface oxygen species. In contrast, the so called intrafacial mechanism is typically valid for high temperatures and includes the migration of oxygen ions that migrate from bulk to surface. This latter process resembles to the Mars van Krevelen mechanism [39]. Furthermore, in the methane oxidation process over the La1−xMxMnO3+δ catalyst,
where M can be either Sr or Ce, catalytic activity of oxidation was found to be closely correlated with the number of Mn4+ ions, more specifically to the number
12
of –O-Mn3+-O-Mn4+ linkages [40]. A related study also suggested that addition of Sr2+ ions enhanced the oxidation Mn3+ to Mn4+and increased the catalytic activity for methane oxidation [41]. In addition Oliva et al. [40] reported that Mn4+ population and the oxygen mobility in the perovskite structure can increase due to the reduction of Mn3+ sites into Mn2+ which can strongly alter the reactivity.
1.2.6. NOx Decomposition on Perovskites
Numerous studies have been carried out on the NOx abatement in
automotive applications with perovskites [10]. In the forth coming section, catalytic decomposition of various NOx species such as N2O and NO in relevance
to exhaust emission catalysis will be discussed in detail.
1.2.6.1 N2O Decomposition
One of the commonly proposed mechanism in the literature suggests that N2O decomposition has closely related to the oxygen mobility as shown in
equations(4-6) given below[42].
N2O + * ↔ N2O* (3)
N2O* → N2 + O* (4)
2O* ↔ O2+ 2* (5)
In the N2O decomposition mechanism shown above, asterisk “*” represents
the active site for N2O adsorption. N2O decomposition starts with N2O
13
showed that the N2O decomposition activity of La1−xSrxMnO3 (where x was
varied between 0≤x≤0.7) [43], [44] increased with oxygen mobility characteristics. Oxygen desorption was reported to be the rate determining step for N2O decomposition which also strongly depended on the surface O1s
binding energy of oxygen [45]–[47]. On the other hand, oxygen mobility is not the only parameter for N2O decomposition; synthesis routes leading to
higher SSA for LaCoO3 and Pd impregnation to LaCO3 also increase the N2O
decomposition activity of perovskites [48], [49].
1.2.6.2 NO Decomposition
Direct NO decomposition is another important process to remove NOx
species as it does not require an additional reducing agent. B site coordination with oxygen species result in (Figure 4) B-O (T') square, B-O (T*) pyramidal and/or B-O (T) octahedral coordination. Oxygen vacancies in B-O pyramids favor the oxygen mobility and former reports confirm that active sites for NO decomposition is comprised of two adjacent oxygen vacancy sites (i.e. Route
a) or one lattice oxygen in between two transition metal sites (Route b) [50],
14
Figure 5.Crystal structure of perovskites in the form A2BO4 with active sites
for NO decomposition (T′, T, and T*) and possible routes (a,b) [51].
La0.4Sr0.6Mn0.8Ni0.2O3 type of perovskite was studied to elucidate the kinetics and
mechanism of NO decomposition [52]. It was stated that N2 formation is
monotonically proportional to the NO partial pressure, however oxygen partial pressure revealed a negative order where increasing oxygen partial pressure decreased the rate of NO decomposition [53]–[55]. Furthermore, Tofan et al. indicated that oxygen inhibition alters accordingly temperature and material composition since oxygen blocks regeneration of active sites [56]. To illustrate the material composition effect, Ishihara et al. studied LaBO3 materials where B was
chosen as Mn, Co, Cu, Fe and Cr [57]. It was identified that the direct NO decomposition activity increased in the following order: Mn>Co>Cu>Fe >> Cr. On the other hand, Iwakuniet al. reported the effect of material composition by using BaMnO3 perovskites and results showed that direct NO decomposition
decreased in the following order: Mg >Zr> Fe > Ni > Sn > Ta when these species substituted with Mn in the perovskite structure [54].
15
1.2.7. NSR Systems Utilizing Perovskites
As mentioned above, NSR systems have been widely studied since 1990s [58]– [62]. NOx trap catalysts usually include a noble metal (Pt), providing NO
oxidation and H2 bond activation. Additionally, they contain a storage component
such as barium oxide and a support material such as alumina [2]. However, high cost of precious metals and sulfur sensitivity of storage component [63], [64] are critical drawbacks of NOx trap catalysts. On the other hand, perovskites are
promising candidates for NSR catalysis due to their reasonable NOx storage
efficiency and low cost.
Kiennemann et al. studied a series of perovskites by using a complex gas mixture (NO, NO2, CO, O2, H2O) and pointed out that BaSnO3 was the most
promising catalyst for NO2 oxidation and storage [65]. However, this particular
material was not efficient for NO oxidation and addition of Pt led to only a minor improvement. Although the presence of CO2 strongly influenced the NSC of
Pt/Ba/Al2O3 benchmark catalyst [66], [67], BaSnO3[65] was not affected by CO2.
SO2 exposure over the catalysts results in the formation of irreversible bulk
sulfates, decreasing the NSC of BaSnO3 [68]. Furthermore, NOx storage properties
of BaFeO3 and BaCeO3 were also studied which showed higher NOx storage
capacity as compared to BaSnO3 [69]. To increase the NOx storage capacity of
BaCeO3, Pt and Rh addition was investigated [70], however it was found that NSC
values decreased upon PGM addition. On the other hand, BaCeO3 and BaFeO3
show resistance for sulfur poisoning and NSC of BaCeO3 is not affected from
16
formation [71]. On the other hand, it is reported that SOx and NOx removal
efficiency (dosed at the same time) is %90 and %98 for NO and SO2 respectively
indicate that LaCoO3 has inherent resistance for SOx [72]. High sulfur tolerance
and high NOx storage capacity were observed for BaCo0.6Fe0.4O3−x perovskites
which exceeded that of the Pt/BaO/Al2O3 benchmark catalyst [73]. Furthermore,
La0.9K0.1Co1−xFexO3−ywas the subject for another study and results showed that
high catalytic activity was connected to the Fe4+ species and the amount of surface oxygen [74]. Besides that Sr-substituted La1−xSrxCoO3 type perovskites were
found to reveal promising activity in the oxidation of NO to NO2 [10].
NOx oxidation and reduction cycles are considerably important for
perovskites as the perovskite structure should not be reduced irreversibly while NOx is reduced to N2. There are multiple reports indicating that perovskite
structure can be maintained after reduction of nitrate species under lean conditions at ca.400 oC [75]. Moreover, La1−xSrxCoO3 type perovskites reveal performances
close to commercial platinum-based DOC catalysts in terms of NOx storage and
reduction capacity and they can even yield better performance in the presence of sulfur [10].
17
Chapter 2
Experimental
2.1.Sample Preparation2.1.1. Synthesis of Simple LaMnO3 and LaCoO3 Perovskites
The citrate method has been used to synthesize simple LaCoO3 and
LaMnO3 perovskites based on the synthesis route described in a patent of General
Motors Company [76]. First, amount of precursors were determined for the synthesis of a 1 g perovskite sample (Table 1). Citric acid amount was determined by multiplying molecular weight of citric acid and total mole number of La, Mn or/and Co with %10 mass percent citric acid excess then it was dissolved in deionized water. After addition of citric acid, nitrate based precursors of La, Mn or Co were added into the solution. Solution was stirred for 1 hr under ambient conditions. Then, the solution was heated up to 353 K during constant stirring. Heating process was continued until the gel formation was obtained. This is followed by the drying process. The gel was dried at 363 K under ambient conditions for 24 hr. After the drying process solid particles were ground to obtain a fine powder. Finally, powder sample was calcined at 973 K in air for 5 hr.
18
2.1.2. Synthesis of LaCoxMn1-xO3 Type Hybrid Perovskites
Synthesis of LaCoxMn1-xO3 hybrid perovskites were performed using a
similar method as described in section 2.1.1 with the exception that Co and Mn precursors were added to the solution simultaneously by using “x” values varying within 0.1≤x≤0.9 (Figure 5). The precursor amounts used in the synthesis are listed in Table 2.
Figure 6. Schematic representation of the compositional variation of
hybrid perovskites.
Table 1.Amount of precursors used in the synthesis of simple perovskites
Precursors LaMnO3 LaCoO3
La(NO3)3.6H2O 1.7905g 1.7613g Mn(NO3)3.4H2O 1.0379g - Co(NO3)2.6H2O - 1.1838g Citric acid 1.9116g 1.8805g Distilled water 82.7ml 81.3ml Calcination Temperature 973 K 973 K
19
Table 2.Amounts of materials used in the synthesis of hybrid perovskites.
Precursors LaCo0.1Mn0.9O3 LaCo0.2Mn0.8O3 LaCo0.3Mn0.7O3 LaCo0.4Mn0.6O3 LaCo0.5Mn0.5O3
La (NO3)3.6H2O 1.7875 g 1.7846 g 1.7816 g 1.7787 g 1.7758 g Mn(NO3)2.4H2O 0.9326 g 0.8276 g 0.7229 g 0.61866 g 0.5147 g Co(NO3)2.6H2O 0.1201 g 0.2398 g 0.3592 g 0.47819 g 0.5967 g Citric Acid 1.9085 g 1.9022 g 1.9022 g 1.8990 g 1.8959 g Distilled Wa ter 82.5833 ml 82.4485 ml 82.236 ml 82.1759 ml 82.0422 ml Calcination Temperature 973K 973K 973K 973K 973K
Precursors LaCo0.6Mn0.4O3 LaCo0.7Mn0.3O3 LaCo0.8Mn0.2O3 LaCo0.9Mn0.1O3
----La (NO3)3.6H2O 1.7729 g 1.7700 g 1.7671 g 1.7639 g ----Mn(NO3)2.4H2O 0.4110 g 0.3078 g 0.2049 g 0.10225 g ----Co(NO3)2.6H2O 0.7149 g 0.8328 g 0.9502 g 1.0669 g ----Citric Acid 1.8929 g 1.8898 g 1.8867 g 1.88325 g ----Distilled Wa ter 81.9078 ml 81.7748 ml 81.6407 ml 81.4918 ml ----Calcination Temperature 973K 973K 973K 973K
----20
2.2.Instrumentations
2.2.1. XRD Patterns
Perovskite XRD patterns were recorded from the powder samples by using a Rigaku diffractometer equipped with a Miniflex goniometer. Standard X-Ray source has been used with a Cu Kα radiation at λ=1.5418 Å kV and 15 mA. Powder samples were placed on quartz slides and pressed. Perovskite samples were scanned in the 2θ range of 10-80o with a scan rate 0.01 deg.s-1. Assignment of diffraction patterns were executed by using Joint Committee on Powder Diffraction Standards (JCPDS) cards provided by the International Centre for Diffraction Database (ICDD).
2.2.2. BET Measurements
The specific surface area measurements were performed by using the five-point Brunauer-Emmett-Teller (BET) method [77]. The samples were initially evacuated under vacuum for 1hr at RT. Evacuated samples were then heated for 2 hr at 573 K to evacuate the pores of the catalysts. Micromeritics ASAP 2000 gas sorption and porosimetry system was used for performing the BET measurements.
2.2.3. TEM Imaging and EDX Mapping
For the TEM-EDX sample preparation, ground powder samples were spread over a lacey-type carbon film on a copper TEM grid using ethanol as the suspension medium. TEM measurements were performed in the bright-field mode
21
using a FEI Tecnai G2 F30 microscope with a resolution of 0.17 nm, a Gatan slow-scan CCD camera, and a Gatan serial energy loss spectrometer. 300 keV e-beam acceleration voltage was used for imaging. For elemental analysis of the imaged samples, EDX was performed with 100 keV incident electron energy. EDX acquisition time was around 15-20 s.
2.2.4. XPS Measurements
A SPECS XPS spectrometer was used to collect photo emission data of the perovskites samples. This spectrometer was equipped with a monochromatic Al, Kα, X-Ray irradiation with hν = 1486.74 eV, 400 W and PHOIBOS-DLD energy analyzer. Powder samples were placed on a conducting copper sticky tape for measurement. An electron flood gun was used to prevent surface charging.
2.2.5. Ex-situ Infrared Measurements
Ex-situ infrared measurement data were collected by using a Bruker Tensor 27 infrared spectrometer. Experiments were carried out in transmission mode with a resolution of 4 cm-1 and 64 scans/spectrum. Before the ex-situ IR measurements catalyst samples were mixed with KBr using a mass ratio 200 mg /2 mg.
22
2.2.6. In-situ Infrared Measurements
In-situ experiments have been carried out using an FTIR (Bruker Tensor 27) spectrometer coupled to a quadruple mass spectrometer (QMS, Stanford Research Systems, SRS RGA200) and a custom-made spectroscopic transmission FTIR cell. All in-situ FTIR spectra were collected at 323 K. Catalysts placed in the spectroscopic cell were heated using a linear heating system including an adjustable power supply and a computer-controlled PID controller (Gefran 600- DRRR). Linear heating was applied between 323-1023 K with a heating rate of 12 K/min. A liquid nitrogen-cooled MCT (Hg-Cd-Te) mid-IR detector was used for collecting FTIR data. Pressures of dosed gases were controlled by MKS Baratron Pressure Transducer Type 626 and a wide range pressure gauge (EDVAC WRG-S-NW35) comprised of Piranyi and cold-cathode gauges. FTIR spectra were acquired with a resolution of 4 cm-1. 128 scans were used for each spectrum. Vacuum inside the spectroscopic reactor, gas manifold and dosing lines were obtained via rotary and turbomolecular pumps. Lithographically etched, high purity and high conductivity tungsten grid (TechEtch, USA, P/N PW10379-003) has been used to mount the powder catalyst samples in a self-supported manner which can be heated via resistive heating. For the spectroscopic experiments, samples were prepared within a weight range of 20-45 mg. The sample holder also included a ceramic vacuum feed through with copper legs which is spot-welded to the tungsten. A home-made K-type thermocouple (chromel and alumel with 0.015'' radius from Omega Engineering, Inc) was used for temperature measurements where the temperature of the sample could be increased up to 1173
23
K via the PID controller and DC power supply. Before all experiments, samples were baked out at 403 K for 12 hr in order to remove water and other contaminations from the catalyst surface and eliminate the water from the spectroscopic reactor walls. Also before all experiments, baked catalyst surfaces were exposed to 0.5 Torr NO2 for 5 min followed by evacuation and vacuum
annealing using a linear heating ramp (12/K) up to 973 K.
Figure 7.Schematic example of in-situ FTIR and TPD system[78].
2.2.6.1. Stepwise NO2 Adsorption Experiments
Before NO2 adsorption experiments, fresh catalyst surfaces were
24
manifold then released over the sample for 1 min during which the gas pressure of the catalyst sample was observed to be 0.1 Torr due to the expansion of the gas. Before taking IR spectra, chamber was evacuated to10-3 Torr. This procedure was repeated 10 times for all stepwise NOx adsorption experiments. After stepwise
adsorption, surface was saturated with 5 Torr NO2 for 10 minutes. During all of
these treatments, sample temperature was held constant at 323 K. NO2 preparation
has been carried out by mixing NO (g) (Air Products, 99.9%) and O2(g) (Linde
GmbH, Germany, 99.999%). Prepared gas mixture was further purified by freeze-pump-thaw cycles using liquid nitrogen.
2.2.6.1. NO2 Adsorption Experiments over Reduced
Perovskite Surfaces
NO2 adsorption over reduced surfaces was performed by heating the
catalysts to 623 K in the presence of 5 Torr H2(g) for 10 min. After evacuation at
623 K, samples were cooled to 323 K then catalyst surfaces were saturated with 5 Torr NO2 for 10 min followed by evacuation and FTIR spectrum acquisition.
2.2.6.2. SOx Adsorption and Reduction via H2
SOx adsorption experiments were performed on hybrid and simple
perovskites using a SO2(g)+O2(g) gas mixture with a partial pressure ratio of 1/10,
respectively. In these experiments, after the initial catalyst pretreatment as described in earlier sections, 2 Torr SOx was dosed over the sample for 10 min
and the spectrum was recorded at 323 K. After taking the first spectrum, the sample was heated up to 373-673 K with 100K increments and after each temperature increment; the sample is kept at this temperature 10 min in the
25
presence of SOx followed by cooling the sample to 323 K for spectral acquisition.
SOx regeneration process via hydrogen was performed after the evacuation of SOx
gas and subsequent dose of 2.5 Torr H2(g) into the manifold followed by
expansion over the catalyst sample, resulting in a final pressure of 0.5 Torr. After 10 min of hydrogen exposure at 373 K, FTIR spectrum was acquired in the presence of H2. Then, IR spectra were recorded by heating the sample to various
temperatures and cooling back to 323 K in the presence of H2.
2.2.6.3. SOx and NOx co-Adsorption over Perovskites
Pretreated catalyst surface was saturated with 5 Torr NO2at 323 K for
10 min and the spectrum was recorded. After saturation with NO2, sample was
linearly heated in vacuum to 973 K to remove all of the NOx species on the
surface. Then a SO2+NO2 mixture with a SO2:NO2 partial pressure ratio of 1:5
(SO2:O2:NO2= 1:10:55) was prepared by pre-mixing the gases for 10 min in the
gas manifold. After dosing the gas mixture, catalyst was allowed to equilibrate with the gas for 10 min at 323 K and the spectra were at 323 K in the presence of the gas mixture. Additional spectra were also obtained by heating the catalyst in the gas mixture at 373, 473, 573 and 673 K and then cooling to 323 K in the gas mixture.
2.2.7. TPD Experiments
A Quadruple Mass Spectrometer (QMS) was used to follow desorption patterns of adsorbates on perovskites with a computer controlled linear heating
26
rate of 12K/min. Before each TPD experiment, QMS filament (made of thoria-coated iridium) was outgassed for 40 min. Up to 11 different desorption channels (i.e. different m/z values) were monitored for different type of experiments. Vacuum level of the TPD reactor was followed by a Bayard-Alpert type ionization gauge with a NEW Granville Phillips 350 UHV Ultra High Vacuum Hot Cathode Ion Gauge Controller. The maximum temperature that could be obtained via the current TPD heating setup was ca. 1073 K.
2.2.7.1. NOx TPD Experiments over Fresh Perovskites
NOx TPD experiments were performed after stepwise NOx adsorption
experiments. TPD desorption patterns were recorded after completely opening the that gate valve in between IR and TPD systems in order to allow a direct line-of sight access of desorbing molecules to the QMS ionizer. Then the sample was outgassed for 40 min using the differential pumping provided by the turbomolecular pump located in the QMS vacuum chamber. During the NOx TPD
experiments following m/z desorption channels were recorded: 28 (N2 or CO), 14
(N), 16 (O), 32 (O2), 18 (H2O), 30 (NO), 44 (N2O), 46 (NO2).
2.2.7.2. NOx TPD Experiments over Reduced Perovskites
NOx TPD experiments for reduced samples were performed after NOx
adsorption experiments over reduced perovskite samples. The procedure that was employed in these experiments was similar to the one described in section 2.2.7.1 with the exception that the catalysts were initially reduced with hydrogen before NOx saturation.
27
2.2.8. O2 TPD Experiments over Perovskites
O2 TPD experimental procedure consisted of 0.5 Torr NO2 exposure over
the fresh perovskite sample for 5 min and subsequent evacuation. Then, the sample was annealed to 973 K. This initial procedure was used to clean the surface contaminations. However, possible reduction of the surfaces upon the vacuum annealing at 973 K was prevented using a second oxidation step. Thus, prior to the TPD experiment, sample was oxidized for the second time in 10 Torr oxygen for 10 min at 773 K. Then the sample was cooled in oxygen to 323 K and then oxygen gas was evacuated at 323 K. In the TPD experiments, 32 m/z desorption channel was monitored by QMS with the temperature range of 323-1173 K.
2.2.9. H2 TPR Experiments over Perovskites
TPR experiments were carried out by using Micromeritics Autochem 2910 apparatus located in CNRS-ISMN, Palermo which included a thermal conductivity detector. A gas flow rate of 50 ml/min was used in the TPR experiments where a %5 H2/He gas feed was flowed over 100 mg of a catalyst
sample. Before the TPR experiments, catalysts were pretreated with %5 O2/He
gas mixture with a flow rate of 50 ml/min at 400 K for 30 min. During the TPR experiments, the reduction process was performed within 323-1273 K with a heating ramp rate of 10K/min.
28
Chapter 3
Results and Discussion
3.1.Structural Characterization of Perovskites3.1.1. XRD Analysis of Simple and Hybrid Perovskites
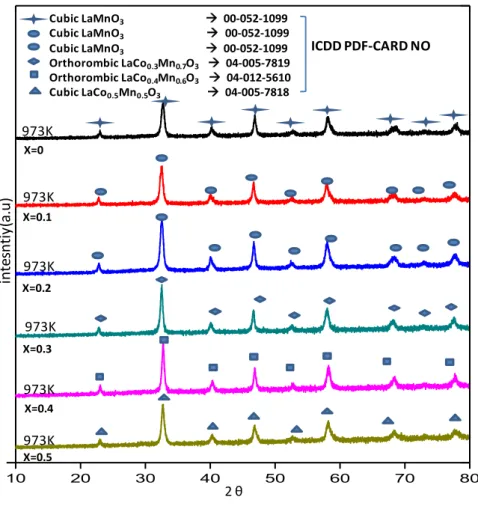
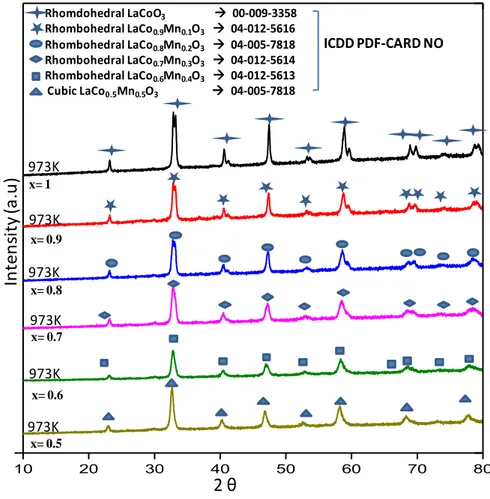
Figure 7 shows XRD patterns of hybrid and simple perovskites. Investigation of crystal structures point out that LaCoO3 calcined at 973 K can be
assigned to a rhombohedral (ICDD Card No: 00-009-3358) structure in agreement with former reports [10], [79]. LaMnO3 calcined at 973 K corresponds
to a cubic (ICDD Card No: 00-052-1099) crystal structure [80], [81].
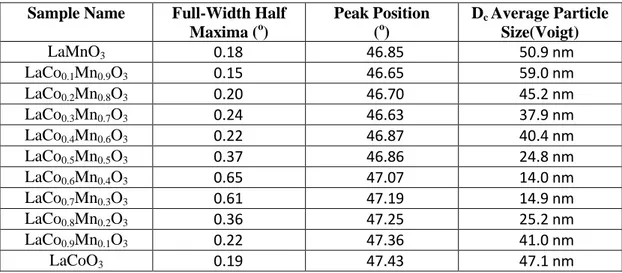
Table 3. Average Particle Size Calculation of LaCoxMn1-XO3 perovskites by using
Scherrer equation via XRD data.
Sample Name Full-Width Half
Maxima (o) Peak Position (o) Dc Average Particle Size(Voigt) LaMnO3 0.18 46.85 50.9 nm LaCo0.1Mn0.9O3 0.15 46.65 59.0 nm LaCo0.2Mn0.8O3 0.20 46.70 45.2 nm LaCo0.3Mn0.7O3 0.24 46.63 37.9 nm LaCo0.4Mn0.6O3 0.22 46.87 40.4 nm LaCo0.5Mn0.5O3 0.37 46.86 24.8 nm LaCo0.6Mn0.4O3 0.65 47.07 14.0 nm LaCo0.7Mn0.3O3 0.61 47.19 14.9 nm LaCo0.8Mn0.2O3 0.36 47.25 25.2 nm LaCo0.9Mn0.1O3 0.22 47.36 41.0 nm LaCoO3 0.19 47.43 47.1 nm
29
Figure 8.XRD patterns of LaCoxMn1-XO3 type perovskites x= 0.0-0.5
calcined at 973 K
As it is seen in the Figure 7, cubic structure is still maintained for slight addition of Co (x=0.1, 0.2). Additionally, moderate loading of Co (x=0.3, 0.4) gives rise to orthorhombic (ICDD Card No: 04-012-5610, 04-005-7819) perovskite structure. Equal amounts of Co and Mn (x=0.5) leads to the observation of the cubic(ICDD Card No: 04-005-7818) structure [82].
10 20 30 40 50 60 70 80 Cubic LaMnO3 00-052-1099 Cubic LaMnO3 00-052-1099 Cubic LaMnO3 00-052-1099 Orthorombic LaCo0.3Mn0.7O3 04-005-7819 Orthorombic LaCo0.4Mn0.6O3 04-012-5610 Cubic LaCo0.5Mn0.5O3 04-005-7818 973K 973K 973K 973K 973K 973K 2 θ int es nt iy (a .u) ICDD PDF-CARD NO X=0 X=0.1 X=0.2 X=0.3 X=0.4 X=0.5
30
Figure 9. XRD patterns of LaCoxMn1-XO3 type perovskites x= 1.0-0.5 calcined at
973 K
Figure 8 shows the alteration of the crystal structure as a function of Mn loading. Mn loadings within 0.9≤x≤0.6 into the LaCoO3 result in rhombohedral
LaCo0.1-0.4Mn0.9-0.6O3±y crystal systems. There is no monotonic relationship
between the Mn loading and the crystal structure. However, Provendier et al. reported that the shift in the main perovskite peak (2θ=32 to 2θ=33.5) changed monotonically with the extent of Mn loading (i.e. substitution). Average particle size of the synthesized hybrid perovskites, Dc, can be estimated using Scherrer
equation [83] as listed in Table 3 where it is seen that the average particles size
10 20 30 40 50 60 70 80 973K 973K 973K Rhomdohedral LaCoO3 00-009-3358 Rhombohedral LaCo0.9Mn0.1O3 04-012-5616 Rhombohedral LaCo0.8Mn0.2O3 04-005-7818 Rhombohedral LaCo0.7Mn0.3O3 04-012-5614 Rhombohedral LaCo0.6Mn0.4O3 04-012-5613 Cubic LaCo0.5Mn0.5O3 04-005-7818 2 θ In ten si ty (a .u ) 973K 973K 973K ICDD PDF-CARD NO x= 1 x= 0.9 x= 0.8 x= 0.7 x= 0.6 x= 0.5
31
varies within ca. 20-60 nm. Particle size is getting smaller owing to small addition of Co (x=0.3, 0.4) then decreases. Diffraction patterns of perovskites are fitted by using voigt function [84]. Average particle size calculations demonstrate that there is no monotonic relationship between B-site composition and particle size.
Finally, XRD patterns suggest that beside these various forms of perovskite polymorphs, no other detectable crystalline phases exist in the synthesized catalytic structures.
3.1.2. BET Analysis of Hybrid and Simple Perovskites
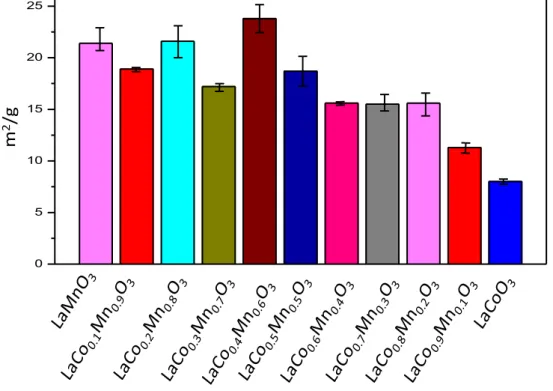
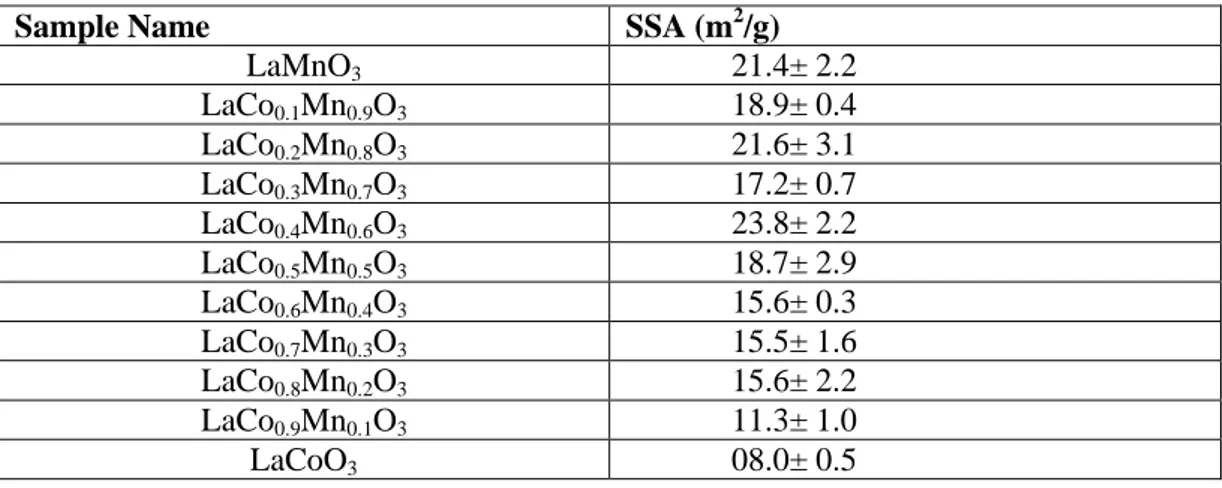
Specific surface area (SSA) results obtained from BET measurements are given in Table 4 and Figure 9 where each perovskite sample was measured 3 times to obtain a statistically representative value. SSA of the currently
32
synthesized LaMnO3 and LaCoO3 were in very good agreement with the former
reports [80].
Figure 10. Specific surface area measurements of LaCoxMn1-XO3 type perovskites
(after calcination at 973 K) where x= 0.0-1.0.
In Figure 9, it can be readily concluded that insertion of Mn into the cobaltite structure increases the SSA values. Although the increase in SSA values with increasing Mn loading is monotonic, yet it reveals a complex dependence. Along these lines, it can be argued that the crystallization and ordering of Mn-rich perovskites required higher temperatures compared to that of Co-rich perovskites Thus, Mn-rich perovskites revealed higher SSA values upon calcination at 973 K.
0 5 10 15 20 25 m 2 /g
33
Table 4.SSA values of LaCoxMn1-XO3 type hybrid perovskites obtained via BET
measurements.
Sample Name SSA (m2/g)
LaMnO3 21.4± 2.2 LaCo0.1Mn0.9O3 18.9± 0.4 LaCo0.2Mn0.8O3 21.6± 3.1 LaCo0.3Mn0.7O3 17.2± 0.7 LaCo0.4Mn0.6O3 23.8± 2.2 LaCo0.5Mn0.5O3 18.7± 2.9 LaCo0.6Mn0.4O3 15.6± 0.3 LaCo0.7Mn0.3O3 15.5± 1.6 LaCo0.8Mn0.2O3 15.6± 2.2 LaCo0.9Mn0.1O3 11.3± 1.0 LaCoO3 08.0± 0.5
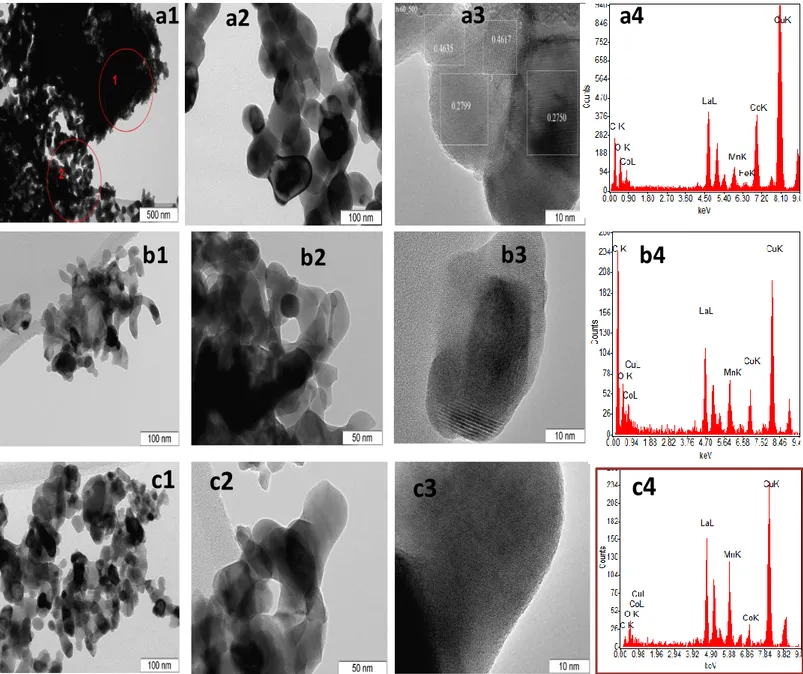
3.1.3. TEM Imaging and EDX Analysis
TEM images of LaCo0.8Mn0.2O3, LaCo0.5Mn0.5O3 and LaCo0.2Mn0.8O3 are
given in Figure 10 along with representative EDX measurements for elemental analysis. Based on the high resolution TEM images, perovskites are observed to be well-crystallized. Presence of different unit cell parameters indicates a polycrystalline structure. Elemental compositions obtained via EDX measurements are observed to be in good agreement with the nominal catalyst compositions where Mn-rich perovskites reveal an increase in the corresponding Mn signal in EDX. Average particle size of the perovskites studied via TEM was found to be ca. 50 nm which is in fair agreement with the corresponding estimations obtained via XRD measurements
34
Figure 11.TEM images and EDX spectra for a1, a2, a3 and a4)
LaCo0.8Mn0.2O3, b1, b2, b3 and b4)LaCo0.5Mn0.5O3 and c1,c2,c3 and c4)
LaCo0.2Mn0.8O3
a4
a3
a2
a1
c4
c3
c2
c1
b4
b3
b2
b1
35
3.1.4. XPS Analysis of Simple and Hybrid Perovskites
Surface atomic ratios of simple perovskites (i.e. LaCoO3 and LaMnO3)
obtained via current XPS measurements were found to be in good harmony with the formerly reported results in the literature [80]. Quantitative surface measurements via XPS are important to find out the relation between
Figure 12. Quantitative analysis of surface atomic ratios via XPS for LaCo0.xMn 1-xO3 type perovskites (x=0.0-1.0) calcined at 973 K.
Co/La Mn/La 0.1 Sur fac e A to m ic R ati o (ar b. u .)
36
Figure 13. Relative Co surface atomic ratio with respect to the total Co and Mn surface atomic ratios (i.e. relative Co content present in all of the B sites comprised of Co and Mn species) for hybrid perovskites LaCo0.xMn1-xO3
(x=0.0-1.0).
NSC and NOx oxidation or reduction activity. Figures 11 and 12, present the
Mn/La, Co/La, Co/Co+Mn surface atomic ratios derived from current XPS measurements, using Pd3d, La3d, Mn2p, and Co3p XP spectra. These results clearly indicate that the Co/La surface atomic ratio decreases as a function of decreasing Co content in the hybrid perovskites, however the decrease in the Co/La surface atomic ratio does not have a linear dependence to the nominal bulk Co/La ratio corresponding to the metal precursor amounts used in the synthesis. It is important to note that for the entire synthesized hybrid and simple perovskite surfaces, surfaces were found to be enriched by La atoms (Table 5) this is in
0.0 0.1 0.2 0.3 0.4 0.5 0.6 0.7 0.8 0.9 1.0 Co/Co+Mn C o/ C o+ M n Su rf ace At om ic R at io
37
agreement with a recent Density Functional Theory (DFT) study by W. F. Schneider et al. suggesting that LaCoO3 perovskite surfaces are terminated by a La-O top layer which minimizes the surface Gibbs free energy of the lattice [85]–[87].
Table 5.Co/La and Mn/Lasurface atomic ratios (i.e. relative surface composition
of B sites with respect to that of A sites) for LaCo0.xMn1-xO3 type hybrid
perovskites (x=0.0-1.0) obtained via XPS
Sample Name Co/La Mn/La
LaCoO3 0.38 0 LaCo0.9Mn0.1O3 0.31 0.07 LaCo0.8Mn0.2O3 0.30 0.16 LaCo0.7Mn0.3O3 0.30 0.35 LaCo0.6Mn0.4O3 0.17 0.35 LaCo0.5Mn0.5O3 0.13 0.55 LaCo0.4Mn0.6O3 0.06 0.60 LaCo0.3Mn0.7O3 0.07 0.48 LaCo0.2Mn0.8O3 0.02 0.66 LaCo0.1Mn0.9O3 0 0.75 LaMnO3 0 0.82
Table 6.Surface atomic ratios of all surface atoms (C,O,La,Co,Mn) of
LaCo0.xMn1-xO3 type perovskites (x=0.0-1.0) obtained via XPS.
Sample Name C O La Co Mn LaCoO3 33.3 50.8 11.5 4.4 0 LaCo0.9Mn0.1O3 38.2 47.5 10.3 3.2 0.8 LaCo0.8Mn0.2O3 29.9 52.3 12.2 3.6 2.0 LaCo0.7Mn0.3O3 25.9 54.5 11.9 3.6 4.2 LaCo0.6Mn0.4O3 29.8 49.8 13.4 2.3 4.7 LaCo0.5Mn0.5O3 38.6 45.5 09.4 1.2 5.2 LaCo0.4Mn0.6O3 37.6 45.2 10.4 0.6 6.2 LaCo0.3Mn0.7O3 47.9 40.1 07.8 0.6 3.7 LaCo0.2Mn0.8O3 42.9 41.6 09.2 0.2 6.1 LaCo0.1Mn0.9O3 51.5 36.7 06.8 0.0 5.1 LaMnO3 34.4 47.5 09.9 0.0 8.1
38
Co/Co+Mn surface atomic ratio points out a similar trend as shown in Figure 12 indicating that the surface coverage of Co decreases gradually as a function of decreasing nominal Co loading used in the synthesis procedure. Data given in Table 6 reveals that surface oxygen coverage is the highest for the LaCo0.7Mn0.3O3 sample. Since XPS is a highly surface sensitive technique, current
XPS data clearly indicate that the “surface composition” of the hybrid perovskites can be successfully fine-tuned by varying the synthetic protocol.
3.1.5. Ex-situ Infrared Analysis
Ex-situ infrared analyses were carried out for fresh hybrid perovskite catalysts after synthesis and calcination at 973 K without further treatment (Figures 13). While Figure 13a shows the 3D waterfall representation of the ex-situ FTIR spectra, Figure 13b presents a conventional 2D view of these spectra.
39
Figure 14. a) 3D-representation of the ex-situ FTIR spectra of the fresh
LaCo0.xMn1-xO3 perovskites (x=0.0-1.0) after calcination at 973 K, b)
2D-representation of the ex-situ FTIR spectra of the fresh LaCo0.xMn1-xO3 perovskites
(x=0.0-1.0) after calcination at 973 K.
Figures 13a and 13b show that there exists two characteristic vibrational stretchings for Co-O linkages, which are clearly visible for the spectrum corresponding to the LaCoO3 sample which does not possess any Mn. This
spectrum reveals two particular Co-O stretching of the CoO6 octahedra located at
551 and 590 cm-1. In addition, a weaker Co-O bending mode of the CoO6
octahedra of the Co3O4 phase located at 665 cm-1 is also visible in Co-rich
perovskites [88]–[90]. It is evident from Figures 13 and 14 that the 551 cm-1 feature which unambiguously originates only from Co-O species -and not from
Wavenumber cm-1 A bs or ba nc e LaCo0.1Mn0.9O3 LaCo0.2Mn0.8O3 LaCo0.3Mn0.7O3 LaCo0.4Mn0.6O3 LaCo0.5Mn0.5O3 LaCo0.6Mn0.4O3 LaCo0.7Mn0.3O3 LaCo0.8Mn0.2O3 LaCo0.9Mn0.1O3 LaCoO3 LaMnO3 400 500 600 700 800 Wavenumber cm-1 611 551 412 665 Co -O Co -O Co -O Co -O Mn -O Int ens it y LaCoO3 LaCo0.9Mn0.1O3 LaCo0.8Mn0.2O3 LaCo0.7Mn0.3O3 LaCo0.6Mn0.4O3 LaCo0.5Mn0.5O3 LaCo0.4Mn0.6O3 LaCo0.3Mn0.7O3 LaCo0.2Mn0.8O3 LaCo0.1Mn0.9O3 LaMnO3 590 a b
40
Mn-O species- gradually attenuates with increasing Mn content in the hybrid perovskites; indicating that the “bulkcomposition” of the perovskites can be fine-tuned successfully by varying the nominal Co and Mn precursor loadings in the synthetic protocol.
3.1.6. NOx Adsorption on Fresh and Reduced Perovskites
Figure 15 shows in-situ FTIR spectra corresponding to NO2 adsorption on
a representative fresh hybrid-perovskite which was initially activated with 0.5 Torr NO2 and annealed to 973 K, as described earlier. Each of the successive
spectra given in Figure 15 involves an additional dose for 1 Torr NO2 for duration
of 1 min at 323 K, followed by evacuation and spectrum acquisition. The last (i.e. the topmost) spectrum corresponds to the saturation of the surface with excess NO2 (5 Torr, 10 min) at 323 K.
As can be seen in Figure 14, NO2 and surface interaction leads to the
evolution of various IR bands located within 1000-1800 cm-1 which are associated with nitrate (NO3-) and nitrite (NO2-)species [91]–[96]. IR bands at 1639 and
1006 cm-1can be attributed to the symmetric and asymmetric modes of bridging nitrates; respectively [91].
In Figure 15, bidentate nitrates can be observed at 1575 and 1257 cm-1 [92], [93]. IR bands of nitrito species can also be detected in Figure 14 at 840-820 cm-1 (νONO, bending), 1365-1075 cm-1 (νN-O) and1485-1400 cm-1 (νN=O). Thus, the
41
Figure 15.In-situ FTIR specta corresponding to the stepwise NO2 adsorption and
saturation of fresh LaCo0.5Mn0.5O3 catalyst at 323 K.
signals at 1440, 1323 and 840 cm-1 can be ascribed to nitrito species (i.e. nitrites).IR signals in Figure 14 at 1174 and 1090 cm-1belong to nitrite vibrational modes vanishing at high exposures of NO2 due to the oxidation of nitrites into
nitrates. Adsorption process can be explained by following reaction mechanism:
2NO2 (adsorbed) + O2− (surface)→NO3− (adsorbed) + NO2− (adsorbed) [80] (6)
Stepwise NOx adsorption was also performed on perovskites other than
LaCo0.5Mn0.5O3. Figures 15-17 present similar experiments performed on all of the
1800 1600 1400 1200 1000 800
![Figure 3. a) Rhombohedral and b) orthorhombic crystal structure of perovskites [12].](https://thumb-eu.123doks.com/thumbv2/9libnet/5912088.122537/21.892.234.686.126.509/figure-rhombohedral-b-orthorhombic-crystal-structure-perovskites.webp)
![Figure 4. Catalytic oxidation process of H 2 , CO and CH 4 upon LaMnO 3 and LaCO 3 [38]](https://thumb-eu.123doks.com/thumbv2/9libnet/5912088.122537/27.892.255.710.242.592/figure-catalytic-oxidation-process-h-ch-lamno-laco.webp)
![Figure 5.Crystal structure of perovskites in the form A 2 BO 4 with active sites for NO decomposition (T′, T, and T*) and possible routes (a,b) [51]](https://thumb-eu.123doks.com/thumbv2/9libnet/5912088.122537/30.892.237.761.170.348/figure-crystal-structure-perovskites-active-decomposition-possible-routes.webp)
![Figure 7.Schematic example of in-situ FTIR and TPD system[78].](https://thumb-eu.123doks.com/thumbv2/9libnet/5912088.122537/39.892.177.761.388.813/figure-schematic-example-situ-ftir-tpd.webp)