Araştırma Arkoç&Özşahin/Kırklareli University Journal of Engineering and Science 4-1(2018) 12-29
ASSESSMENT OF COASTLINE CHANGE OF LAKES OF GALA LAKE
NATIONAL PARK (NW TURKEY) WITH MULTI-TEMPORAL
SATELLITE IMAGES
Orhan Arkoc 1,*, Burak Özşahin2 1
Vocational School of Technical Sciences, Kırklareli University, 39100 Kırklareli 2
Faculty of Architecture, Kırklareli University, 3900 Kırklareli ABSTRACT
Gala Lake national park is an A Class International Wetland and hosts different species of birds and fish. For a sustainable natural life in the park, environmental issues should be monitored. Coastline change detection is one of the important tasks of environmental monitoring. Geology, hydrogeology and hydrology are the important factors that affect coastline change. This study aims to determine the coastline change of Gala and Pamuklu lakes in Gala Lake national park with multi temporal satellite images of Landsat MSS, Landsat TM and Landsat ETM+ which were acquired between 1977 and 2011. The reasons of the changes of the coastline and the surface areas of both lakes has been investigated with geological, hydrogeological and hydrological data. Research has shown that the primary factors controlling coastline change of both lakes are precipitation and evaporation. The surface areas of both Gala and Pamuklu Lake decreased from 5.196 km2 and 1.341 km2 to 5.147 km2 and 1.295 km2, respectively, between 1977 and 2011 with an average value of % 2.2.
Keywords: Gala Lake National Park, Coastline Change, Remote Sensing, Hydrology
Araştırma Arkoç&Özşahin/Kırklareli University Journal of Engineering and Science 4-1(2018) 12-29
GALA GÖLÜ MİLLİ PARKI (KB TÜRKİYE) GÖLLERİNİN KIYI
ÇİZGİSİ DEĞİŞİMLERİNİN ÇOKLU ZAMANSAL UYDU
GÖRÜNTÜLERİ İLE DEĞERLENDİRİLMESİ
ÖZET
Gala Gölü Milli Parkı birçok kuş ve balık türüne ev sahipliği yapan A sınıfı Sulak Alan-Önemli Kuş Alanıdır. Parktaki doğal hayatın sürdürülebilir olması için çevresel sorunların izlenmesi gerekmektedir. Kıyı çizgisi değişiminin izlenmesi, çevre koruma ve izleme işlemlerinin önemli görevlerinden biridir. Jeoloji, hidrojeoloji ve hidroloji, kıyı çizgisi değişimini etkileyen önemli faktörlerdir. Bu çalışma, Gala Gölü milli parkındaki Gala ve Pamuklu göllerinin kıyı şeridi değişimini, 1977 ve 2011 yılları arasında edinilen Landsat MSS, Landsat TM ve Landsat ETM + 'ın çoklu zamansal uydu görüntüleri ile belirlemeyi amaçlamaktadır. Kıyı çizgisinde ve her iki göldeki yüzey alanlarında meydana gelen değişikliklerin nedenleri jeolojik, hidrojeolojik ve hidrolojik verilerle araştırılmıştır. Araştırmalar her iki gölün kıyı çizgisi değişimini kontrol eden birincil faktörlerin yağış ve buharlaşma olduğunu göstermiştir. Gala ve Pamuklu Gölü yüzey alanları 1977 ile 2011 yılları arasında sırasıyla 5.196 km2
ve 1.341 km2 den 5.147 km2 ve 1.295 km2'ye ortalama % 2,2 değerinde azalmıştır.
Araştırma Arkoç&Özşahin/Kırklareli University Journal of Engineering and Science 4-1(2018) 12-29
1. INTRODUCTION
In recent days, due to the climate change and other environmental issues, water bodies are affected either positively or negatively [1]. With no exception, coastal zones in the world are also under pressure of natural and anthropogenic activities and climate change [2]. Coastline can be described as the boundary between water and land [3] and it is one of the most linear features of the earth surface with dynamic nature [4, 5]. This dynamic nature of coastline is controlled by different factors such as, climate, geology, hydrogeology and hydrology. Coastal wetlands are unique and important areas due to their unique floral and faunal characteristics and also an important piece of coastal ecology [6]. Remote sensing techniques provide valuable data for coastline change detection. Furthermore, maps generated by remote sensing data have a potential to project the coastal changes in time [7, 8]. In addition, remote sensing data and geographical information systems (GIS) can easily be integrated for analyzing, and interpreting satellite images to get reliable information [9-12]. More accurate results can be obtained if these data are supported by climatic, geological, hydrogeological and hydraulic data [13].
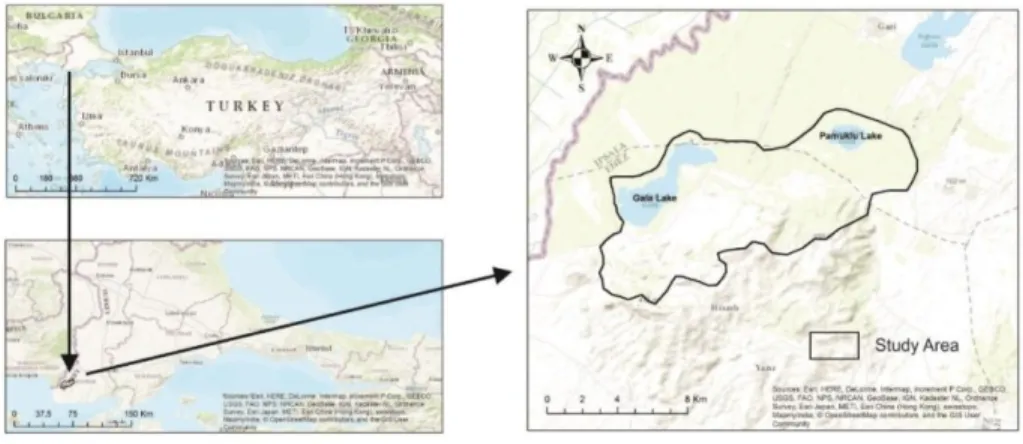
Gala Lake National Park is an A class international wetland and Important Bird Area [14],
situated in Meriç Delta, in the north-west of Turkey with an area of 60 km2
. There are two lakes situated inside the park area. These are namely Gala Lake and Pamuklu Lake. These lakes host 163 different species of birds and 16 different species of fish such as carp fish and pickerel (Figure 1). Gala and Pamuklu Lakes are defined as alluvium barrier lakes, with depths varying from 2,2m and 0,4m. During summer season Gala Lake is separated into two sections, namely Big Gala Lake and Small Gala Lake, by state hydraulic works to prevent it from drying. Both lakes are surrounded by paddy fields where %24 of Turkey’s rice demand is supplied [15-17].
Araştırma Arkoç&Özşahin/Kırklareli University Journal of Engineering and Science 4-1(2018) 12-29
2. MATERIALS AND METHODS
For the determination of coastline changes of the studied lakes, following methodology has been applied;
a) Data collection
b) Pre-processing of image data
c) Hydrological, geological and hydrogeological data interpretation
d) Coastline detection
Flowchart of the research methodology is given in Figure 2.
Figure. 2 Flowchart of The Research Methodology
2.1. Data collection
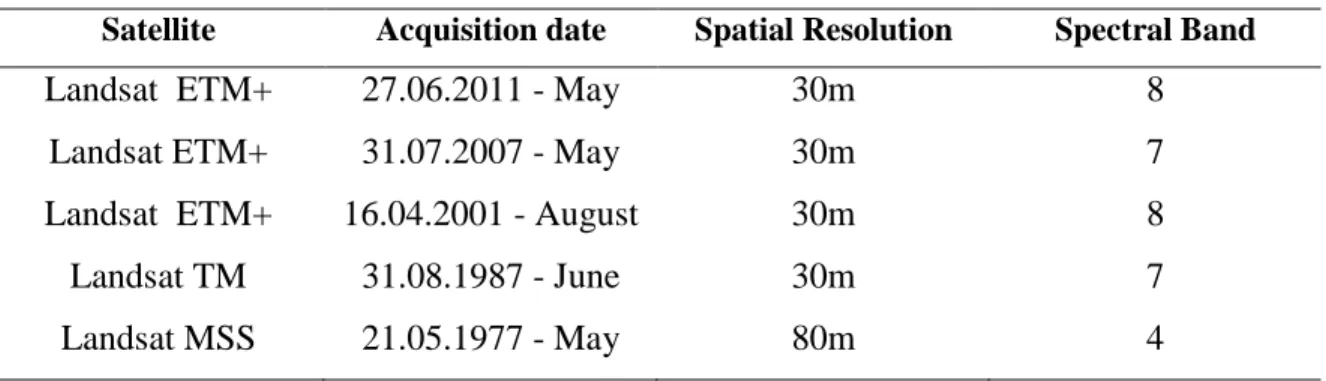
Multi-temporal analysis of the coastline change for both lakes has been made by images of Landsat ETM+ (Enhanced Thematic Mapper), Landsat TM (Thematic Mapper), Landsat MSS (Multispectral Scanner), downloaded via internet from USGS Center for Earth Resources Observation and Science (EROS) [18]. Landsat ETM+ has 8 spectral bands with 30m resolution, Landsat TM has 7 spectral bands with 30m resolution while Landsat MSS has 4 spectral bands with resolution of 80m. Acquisition dates of the satellite images are; 2011 and 2001 for Landsat ETM+, 2007 and 1987 for Landsat TM and 1977 for Landsat MSS. All the properties of the acquired images are given in Table 1.
Araştırma Arkoç&Özşahin/Kırklareli University Journal of Engineering and Science 4-1(2018) 12-29
Table 1. Properties of The Images Used In This Research
Satellite Acquisition date Spatial Resolution Spectral Band
Landsat ETM+ 27.06.2011 - May 30m 8
Landsat ETM+ 31.07.2007 - May 30m 7
Landsat ETM+ 16.04.2001 - August 30m 8
Landsat TM 31.08.1987 - June 30m 7
Landsat MSS 21.05.1977 - May 80m 4
2.2. Pre-processing of image data
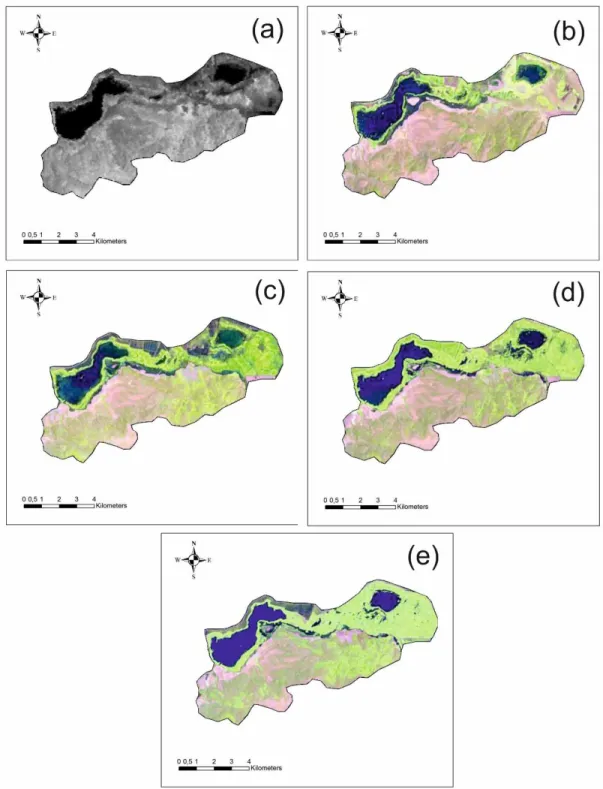
In order to make satellite images more accurate and interpretable, pre-processing procedures such as geometric and atmospheric corrections should be applied. The Landsat images had already been georeferenced, therefore, these images were only rectified to European Datum 1950 (ED50) with coordinate system of Universal Transverse Mercator (UTM-Zone35) using Globalmapper11 software (Blue Marble Geographics, Maine, USA) for geometric correction. Since a large percentage of Landsat imagery was severely contaminated by aerosols, clouds and cloud shadows, these images had to be corrected in order to obtain actual clear sky surface reflectance. This procedure is called as atmospheric correction [19-21]. The atmospheric correction of the images was done by haze reduction tool in Geomatica software (PCI Geomatics, Ontario, Canada) (Fig.3).
Araştırma Arkoç&Özşahin/Kırklareli University Journal of Engineering and Science 4-1(2018) 12-29
Figure 3. Satellite Images:
a) Landsat MSS (1977), b) Landsat TM (1987), c) Landsat ETM+ (2001), d) Landsat ETM+ (2007), e) Landsat ETM+ (2011) images
Araştırma Arkoç&Özşahin/Kırklareli University Journal of Engineering and Science 4-1(2018) 12-29
2.3. Hydrological, geological and hydrogeological data
For the analysis of the reasons of the coastline change in the study area, hydrological, geological and hydrogeological properties of the study area have also been investigated. The main components of the water balance in the study area can be stated as rainfall, recharge from streams and irrigation waters, recharge from groundwater, evaporation and discharge from lake foot. For the determination of rainfall and evaporation in the study area, data have been obtained from Turkish State Meteorological Service portal [22]. In the study area irrigation waters of paddy fields is conducted through May, June, July and August, as a result, returning irrigation waters to the main irrigation canal is assumed to be a component of recharge for both lakes. Unfortunately end of the main irrigation canal is equipped with a cover by State Hydraulic Works (SHW) and during irrigation season this cover is kept closed. For this reason, irrigation waters do not enter
both lakes. Due to this, irrigation component for water balance is neglected. The flow of
ephemeral streams recharging both lakes was stopped by construction of Sığırcı pond and Hamzadere dam in 1990 and 2000, respectively. As stated, due to nature of these streams, no flow observation stations were situated and later on these streams are being used as irrigation canals by the irrigation companies. Therefore, recharge from these streams could not be determined and since these recharges were stopped by SHW as mentioned above, this component of recharge is also not considered. The main discharge components in the study area are the evaporation and flow from foot of Gala Lake.
Geology of the study area is mainly composed of volcanic rocks and alluvium. Southeast of the study area is mountainous (Hisarlıdağ) with an elevation of 381m. Hisarlıdağ Mountain, which is composed of Oligocene aged volcanic rocks of andesite, tuff, basalt and ignimbrite (Th), is situated in the southeast of the lakes. Sandstone, limestone and claystone successions are observed at the western part of the study area and named as Çanakkale Formation (Teç) and alluvium deposited in Meriç delta with a thickness of 35-40m is consisted of gravels, sands and clay bands, comes over all units (Qa) [23] (Fig. 4). Due to the nature of clays in alluvium and volcanic rocks, recharge from groundwater does not play an important role in the study area. Lake foot of Gala is also covered with a valve equipped orifice and discharge from foot lake is controlled by SHW. Therefore, no natural flow is being observed. For this reason, this component for discharge is also not taken in account. As stated above, for the investigation of the reasons of
Araştırma Arkoç&Özşahin/Kırklareli University Journal of Engineering and Science 4-1(2018) 12-29
the coastline change of both lakes, only rainfall and evaporation data trends of years between 1977 and 2011 are taken into consideration.
Figure 4. Geological Map of The Study Area [22]
2.4. Coastline detection
Different methods were used for the detection of coastline from optical imagery in literature. In reflective infrared bands, reflectance of water is nearly equal to zero and majority of other land covers have greater reflectance than water [24]. For this reason, coastline can even be extracted from a single band image. Using this method change in coastline could easily be detected. Usage of near infrared bands (NIR) are fairly proper to separate water bodies from other land covers, therefore, different combinations of NIR bands of these images are used to detect coastline changes. Images of the study area obtained from Landsat ETM+ , Landsat TM, Landsat MSS satellites (Fig.3) are exported to ArcMap software and coastline of the lakes is extracted in raster format. Later surface area of each lake for each image is calculated by area function in ArcMap.
Araştırma Arkoç&Özşahin/Kırklareli University Journal of Engineering and Science 4-1(2018) 12-29
3. RESULTS AND DISCUSSION 3.1. Rainfall (Precipitation)
Rainfall data for the study area is obtained from İpsala meteorological station. Annual average precipitation is determined as 244.82mm with a maximum of 368.7mm in 1994. According to annual precipitation versus cumulative deviation graph of the study area (Fig 5), between 1977 and 1983 a uniform period is observed, after 1983 a dry period prevailed up to 1994. Furthermore, from 1994 a rainy period continued till 2011.
Figure 5. Annual Average Precipitation and Cumulative Deviation From Annual Precipitation Curves Between Years 1977-2011
3.2. Evaporation
Evaporation is the most important discharge component of the lakes while direct measurement of evaporation is not easy and needs more time and cost [25, 26]. Therefore, evapotranspiration (ETo) is usually estimated from meteorological parameters obtained from a near meteorological station. Different methods have been developed to estimate ETo [26-29]. Among this FAO Penman-Monteith method [29] is considered to be the most suitable model for the prediction of ETo.
Araştırma Arkoç&Özşahin/Kırklareli University Journal of Engineering and Science 4-1(2018) 12-29
The Penman-Monteith formula [29] for the estimation of ETo is given as follows;
where ETo is reference evapotranspiration (mm day-1) Δ is the slope of vapor pressure versus temperature curve at temperature Tmean (KPa.°C−1), γ is the psychrometric constant (KPa.°C−1), u2 is the wind speed at a 2 m height (m.s−1), Rn is the net radiation at crop surface (MJ.m−2.d−1), G is the soil heat flux density (MJ.m−2.d−1), T is the mean daily air temperature at 2 m height (°C), and (es-ea) is the saturation vapor pressure deficit (KPa C-1).
Data obtained from İpsala meteorological station is used for the calculation of evaporation values due to its nearness (Table 2).
Table 2. Evaporation Data of Gala and Pamuklu Lakes (mm)
Years January February March April May June July August September October November December Total
1977 10,1 12,9 20,1 25,9 47,2 94,4 129,0 130,3 78,4 42,2 18,0 14,0 622,5 1978 10,0 15,7 23,5 22,6 52,4 92,5 137,1 68,0 76,6 40,9 17,6 12,9 569,7 1979 10,7 15,7 23,9 24,1 53,0 106,1 124,7 71,2 80,8 49,4 18,3 13,7 591,7 1980 9,4 12,7 25,7 20,4 52,6 91,0 142,4 68,3 67,3 51,4 18,0 14,8 573,9 1981 9,3 13,2 25,2 25,9 53,7 98,4 124,3 69,1 74,6 49,4 20,4 14,4 578,0 1982 9,2 51,3 28,5 44,8 34,5 34,0 54,5 27,3 33,7 69,6 18,3 18,0 423,7 1983 14,9 21,4 13,0 12,5 26,8 66,2 160,5 26,6 121,5 57,9 43,8 15,5 580,5 1984 11,1 18,0 146,2 19,0 24,6 37,8 70,4 37,0 31,8 21,9 16,5 13,6 447,8 1985 14,7 20,3 23,4 11,0 21,4 42,3 52,6 26,4 33,7 27,3 51,9 12,5 337,5 1986 14,6 30,1 13,8 11,2 26,1 46,3 50,6 46,9 33,5 35,8 14,0 13,0 335,7 1987 10,0 9,6 24,5 19,1 26,4 83,2 54,0 36,7 33,0 43,0 30,6 163,4 533,5 1988 5,8 13,7 21,3 13,0 21,9 35,2 57,5 26,1 44,3 34,1 38,9 13,2 324,9 1989 4,7 14,0 34,3 16,7 25,7 52,6 58,3 140,2 42,4 78,5 14,1 30,7 512,2 1990 9,6 17,4 29,0 24,1 67,1 100,9 141,8 74,9 90,0 54,6 20,7 13,6 643,9 1991 9,5 15,2 22,9 24,3 48,1 102,2 137,1 68,8 81,4 63,3 17,4 12,1 602,3 1992 9,1 13,8 22,3 28,7 55,4 91,0 119,3 68,5 79,0 48,1 20,0 14,2 569,4 1993 9,3 12,7 21,7 19,6 48,1 86,3 119,3 77,0 79,3 50,0 19,0 13,7 556,1
Araştırma Arkoç&Özşahin/Kırklareli University Journal of Engineering and Science 4-1(2018) 12-29 Table 2 continuing 1995 11,0 16,0 23,4 24,8 56,1 94,4 122,5 65,9 71,9 40,4 16,7 14,8 557,9 1996 8,0 14,8 19,1 26,2 61,2 100,5 138,6 74,3 71,1 42,8 17,8 15,1 589,5 1997 10,2 15,0 20,9 22,4 60,7 95,6 143,5 64,9 71,6 44,6 17,8 13,6 580,8 1998 8,6 13,4 18,5 23,2 48,7 95,2 138,1 87,5 74,3 48,7 19,2 14,9 590,3 1999 10,5 14,5 22,3 25,2 56,1 93,6 138,1 79,5 87,3 55,7 17,6 15,1 615,6 2000 9,3 14,3 26,1 26,4 53,3 105,2 168,9 79,8 83,6 46,0 20,8 15,5 649,1 2001 11,2 15,7 28,0 28,0 62,6 106,1 136,0 84,7 83,6 52,0 20,4 12,6 641,0 2002 10,5 15,9 25,0 24,2 60,4 101,7 138,6 77,9 74,6 44,1 17,6 13,6 604,3 2003 11,0 13,1 22,7 25,5 65,7 98,4 131,0 76,4 84,6 49,4 19,8 13,7 611,3 2004 10,4 16,2 24,3 24,1 50,2 87,3 132,5 71,5 79,6 48,3 19,9 16,5 580,8 2005 11,5 14,0 23,8 29,2 56,8 85,2 124,7 72,6 82,7 43,9 16,8 15,3 576,7 2006 9,3 14,1 23,2 25,6 61,8 97,2 130,5 77,9 82,7 44,4 16,3 12,9 595,9 2007 10,6 13,7 31,1 35,0 77,0 114,9 146,3 82,7 89,3 48,9 16,6 14,4 680,5 2008 8,4 17,3 23,5 27,0 57,1 106,5 130,0 77,9 82,4 42,5 21,7 16,7 611,0 2009 11,2 15,1 30,4 26,5 66,8 98,4 139,2 74,1 82,7 49,6 19,4 15,6 629,0 2010 12,0 17,3 24,8 25,0 62,9 98,8 124,3 79,5 89,3 40,4 19,5 17,8 611,6 2011 9,3 14,3 23,1 21,6 54,7 87,0 132,5 71,2 84,6 46,3 14,9 14,5 573,9
3.3. Coastline change of lakes
According to the maps produced from satellite imaginary, between 1977 and 1987 the surface
area of Gala Lake increased from 5,196 km2 to 5,336 km2 with a ratio of 2,69% and the surface
area of Pamuklu Lake increased from 1,341 km2 to 1,352 km2 with a ratio of 0,8% (Fig. 6 and
Fig.7). During this period, evaporation of the lakes was calculated as 5594,4 mm and annual precipitation was measured as 2466,4 mm).
Araştırma Arkoç&Özşahin/Kırklareli University Journal of Engineering and Science 4-1(2018) 12-29
Figure 6. Precipitation and Evaporation Trends of the Study
Araştırma Arkoç&Özşahin/Kırklareli University Journal of Engineering and Science 4-1(2018) 12-29
Between 1987 and 2001, the surface areas of the lakes decreased to 4,985 km2 and 1,352 km2 for Gala Lake and Pamuklu Lake, respectively, and evaporation calculated as 8061,2 mm and precipitation was measured as 3464,1 mm. According to the graph of annual cumulative precipitation (Fig. 5), between the years 1983 and 1994, a dry period of 11 years, from 1994 to 2001 a rainy period of 6 years was observed. Between 2001 and 2007, the surface area of both Gala Lake and Pamuklu Lake increased to 5,142 km2 and 1,289 km2, respectively (Table 3). This fluctuation of rainfall and high evaporation values could be the reason for the decrease in the surface areas of both lakes.
Table 3. Changes in Surface Areas of The Lakes in the Study Area
Time Image Gala Lake/km2 Pamuklu Lake/km2
Area Change rate* Area Change rate*
1977 Landsat ETM+ 5.196 1.341 1987 Landsat ETM+ 5.336 + 2.7 1.352 + 0.8 2001 Landsat ETM+ 4.985 - 6.5 1.234 - 6.6 2007 Landsat TM 5.142 + 3.1 1.289 + 4.5 2011 Landsat MSS 5.147 + 0.1 1.295 + 0.4 *
Average per year change rate from last image acquisition time.
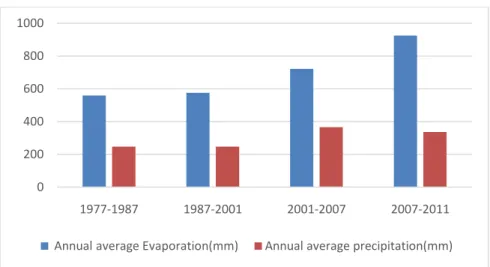
Table 4. Changes of Evaporation and Precipitation Values of Both Lakes During Observation Periods
Period Evaporation(mm) Change rate Precipitation(mm) Change rate
1977-1987 10y 5594,4 2466,4
1987-2001 14y 8061,2 + 3464,1 +
2001-2007 5y 3609,0 - 1827,2 -
2007-2011 4y 3701,8 + 1344,8 -
Between 2001 and 2007, evaporation was calculated as 3609 mm and precipitation was 1827,2 mm. and a rainy period was observed. Furthermore, this increase continued till 2011 for Gala
Lake with a surface area of 5,147 km2 and for Pamuklu Lake with a surface area of 1,295 km2
and evaporation was 3701,8 mm and precipitation was 1344,8 mm. Changes of the surface area of the lake surfaces are given in Table 4. According to these results, no significant coastline change was observed for both lakes. Since 1977, both precipitation and evaporation values
Araştırma Arkoç&Özşahin/Kırklareli University Journal of Engineering and Science 4-1(2018) 12-29
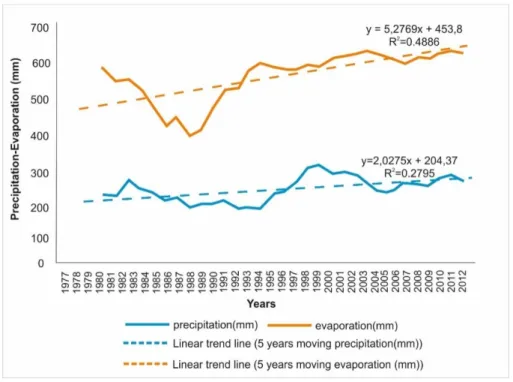
showed a trend of slight increase while 5 year moving average values of both precipitation and evaporation values also support that surface area change for both lakes was proportional with precipitation and evaporation values respectively (Fig 8 and Fig 9). It should be also noted that, as seen in figure 10, annual evaporation values had shown greater increase than precipitation values in the study area.
Figure 8. Coastline Change of Gala Lake Area
Araştırma Arkoç&Özşahin/Kırklareli University Journal of Engineering and Science 4-1(2018) 12-29
Figure 10. Annual Average Evaporation and Average Precipitation Changes in the Study Area
4. CONCLUSIONS
In different parts of the world, levels of water bodies tend to decrease. In order to resume the sustainability of water bodies, factors affecting them should be determined. Especially adverse impacts of anthropogenic activity can easily be removed after their determination. This study aims to determine the coastline change of Gala Lake and Pamuklu Lake of Gala Lake National Park and to discuss its reasons.
For this purpose, remote sensing techniques and multi temporal satellite images of Landsat ETM+, Landsat TM, Landsat MSS which were achieved in 1977, 1987, 2001, 2007 and 2011 have been investigated. After haze and cloud reduction of the images, ideal band for coastline detection is selected (Atmospheric correction). Eventually, the changes of coastline for both lakes from 1977 to 2011 are specified. These investigations are supported by hydrogeological, geological and hydrological data. For this purpose, precipitation data, as foremost important data of recharge, and evaporation data for discharge, are used. Additionally, the surface area changes of both lakes are also determined from shore lines. In the study area it has been observed that due to precautions taken by SHW for irrigation of the paddy fields the flow of the streams feeding the lakes and flow from lake foot had been interrupted. These components for recharge and discharge for water balance are neglected.
In 1977, the surface areas of Gala Lake and Pamuklu Lake were 5.196 km2 and 1.341 km2, respectively. In 2011, the areas of both lake surfaces were 5.147 km2 and 1.295 km2 during this
0 200 400 600 800 1000 1977-1987 1987-2001 2001-2007 2007-2011
Araştırma Arkoç&Özşahin/Kırklareli University Journal of Engineering and Science 4-1(2018) 12-29
period of time, the surface area of Gala Lake decreased %1 while the surface area of Pamuklu Lake decreased % 3.4. This decrease in surface areas was mainly caused by rainfall and evaporation and the dry period occurred during this time interval of the study. Studies revealed that coastline change of the lakes are mainly controlled by precipitation and evaporation. Water entry of stream waters and exit from lake foot is restricted to due to the work carried out for irrigation purposes. This resulted the precipitation as the only component of recharge and evaporation as discharge component. Consequently, both lakes have not been seriously affected from negative impacts of climate change reported by the Intergovernmental Panel on Climate Change in latest decade.
REFERENCES
[1] Stocker, T.F., Qin, D.; Plattner G-K., Tignor, M.M.B., Allen, S.K,, Boschung, J., Nauels, A., Xia, Y., Bex, V., Midgle, P.M.(Eds.) Climate Change 2013: The physical science basis summary for policymakers; Cambridge University Press: Cambridge, UK, pp. 3-30, 2013.
[2] Pachauri RK, et al. (Eds.) (2014) Climate Change 2014: Synthesis Report. Contribution of Working Groups I, II and III to the Fifth Assessment Report of the Intergovernmental Panel on Climate Change, Geneva, Switzerland, IPCC, 151 p., ISBN: 978-92-9169-143-2
[3] Li, X., Damen, M.C., Coastline change detection with satellite remote sensing for environmental management of the Pearl River Estuary. China. J Marine Syst., 82, 54-61, 2010. doi:10.1016/j.jmarsys.2010.02.005
[4] Alesheikh, A.A., Ghorbanali, A., Nouri, N., Coastline change detection using remote sensing. Int J Environ Sci Technol.,4 (1), 61–66, 2007. doi:10.1007/BF03325962
[5] Winarso, G., Budhiman, S. The potential application of remote sensing data for coastal study, Proc. 22 nd. Asian Conference on Remote Sensing, Singapore. C1, 87-91, 2001.
[6] Kuleli, T., Guneroglu, A., Karsli, F., Dihkan, M., Automatic detection of shoreline change on coastal Ramsar wetlands of Turkey. Ocean Eng., 38(10), 1141-1149, 2014. doi: 10.1016/j.oceaneng.2011.05.006
[7] Ciavola, P., Mantovani, F., Simeoni, U., Tessari, U., Relation between river dynamics and coastal changes in Albania: an assessment integrating satellite imagery with historical data. Int J Remote Sens., 20 (3), 561–584,1999. doi: 10.1080/014311699213343
Araştırma Arkoç&Özşahin/Kırklareli University Journal of Engineering and Science 4-1(2018) 12-29
[8] Yang, X, Damen, M.C.J., Van Zuidam, R.A., Use of Thematic Mapper imagery with a geographic information system for geomorphologic mapping in a large deltaic lowland environment. Int J Remote Sens., 20 (4), 659–681, 1999. doi: 10.1080/014311699213127
[9] Maiti, S., Bhattacharya, A.K., Shoreline change analysis and its application to prediction: a remote sensing and statistics based approach. Marine Geo., 257 (1–4), 11–23, 2009. 10.1016/j.margeo.2008.10.006
[10] Genz, A.S., Fletcher, C.H., Dunn, R.A., Frazer, L.N., Rooney, J.J., The predictive accuracy of shoreline change rate methods and alongshore beach variation on Maui, Hawaii. J Coast Res., 23 (1), 87–105, 2007. doi: 10.2112/05-0521.1
[11] Durduran, S.S., Coastline change assessment on water reservoirs located in the Konya Basin Area, Turkey, using multitemporal landsat imagery. Environ Monit Assess., 164(1), 453-461, 2010. doi: 10.1007/s10661-009-0906-9
[12] Dasho, O.A., Ariyibi, E.A., Akinluyi, F.O., Awoyemi, M.O., Adebayo, A.S., Application of satellite remote sensing to groundwater potential modeling in Ejigbo area, Southwestern Nigeria. Model Earth Syst Environ., 1-19,2017. doi: 10.1007/s40808-017-0322-z
[13] Sener, E., Davraz, A., Sener, S.,Investigation of Aksehir and Eber Lakes (SW Turkey) coastline change with multitemporal satellite images. Water Resour Manage., 24(4), 727-745,2010. doi: 0.1007/s11269-009-9467-5
[14] BirdLife International, Important Bird Areas factsheet: Meriç Delta. http://www.birdlife.org (erişim tarihi 16/03/2018).
[15] Çamur-Elipek, B., Arslan, N., Kirgiz, T., Öterler, B., Güher, H., Özkan, N., Analysis of Benthic Macroinvertebrates in Relation to Environmental Variables of Lake Gala, a National Park of Turkey, Turk J Fish Aquat Sci. 10, 235-243, 2010, doi: 10.4194/trjfas.2010.0212
[16] Tokatlı, C., Köse, E., Uğurluoğlu, A., Çiçek, A., Emiroğlu, Ö., Gala Gölü (Edirne) Su Kalitesinin Coğrafi Bilgi Sistemi (CBS) Kullanılarak Değerlendirilmesi, Sigma.2014, 32, 490-501, 2014.
[17] Güher, H. A., Gala Gölü’nün (Edirne) Cladocera and Copepoda (Crustacea) türleri üzerine faunistik bir çalışma, Trak Univ J Nat Sci., 17(1), 1-5, 2016.
[18] USGS Center for Earth Resources Observation and Science (EROS),
Araştırma Arkoç&Özşahin/Kırklareli University Journal of Engineering and Science 4-1(2018) 12-29
[19] Liang, S., Fang, H, Chen, M., Atmospheric correction of Landsat ETM+ land surface imagery. I. Methods. IEEE Trans Geosci Remote Sens., 39(11), 2490-2498, 2001, doi: 10.1109/36.964986
[20] Lu, D., Mausel, P., Brondizio, E., Moran, E., Assessment of atmospheric correction methods for Landsat TM data applicable to Amazon basin LBA research. Int J Remote Sens., 23(13), 2651-2671, 2002. doi: 10.1080/01431160110109642
[21] Tardy, B., Rivalland, V., Huc, M., Hagolle, O., Marcq, S., Boulet, G., A Software Tool for Atmospheric Correction and Surface Temperature Estimation of Landsat Infrared Thermal Data. Remote Sens., 8(9), 696, 2016. doi: 10.3390/rs8090696
[22] Meteoroloji Genel Müdürlüğü Veri Temin Sistemi, http://tumas.mgm.gov.tr (erişim tarihi: 1 May 2017).
[23] Senturk, K., Karaköse, C., 1/100 000 ölçekli Türkiye Jeoloji Haritaları, Çanakkale –D2 paftası, Maden Tetkik ve Arama Genel Müdürlüğü, Ankara, No:62, 7s, 1998.
[24] Van, T.T., Binh, T.T., Shoreline change detection to serve sustainable management of coastal zone in Cuu Long Estuary. International Symposium on Geoinformatics for Spatial Infrastructure Development in Earth and Allied Sciences, Hanoi, Vietnam, 2008, C1. (erişim: http://wgrass.media.osaka-cu.ac.jp/gisideas08 ).
[25] Kelley, G.W., Hobgood, J.S., Bedford, K.W., Schwab, D.J., Generation of three dimensional lake model forecasts for Lake Erie. Weather Forecast, 13, 305–315, 1998.
[26] Sharifi, A., Dinpashoh, Y., Sensitivity analysis of the Penman-Monteith reference crop evapotranspiration to climatic variables in Iran. Water Resour Manage, 28(15), 5465-5476, 2014. doi: 10.1007/s11269-014-0813-x
[27] Blaney, H.F., Criddle, W.D., Determining water requirements in irrigated areas from climatological and irrigation data. USDA SCS-TP-96, U.S. Department of Agriculture, Washington. D.C, 3s, 1950.
[28] Hargreaves, G.H., Samani, Z.A., Reference crop evapotranspiration from temperature. Appl Eng in Agric.,1(2), 96-99, 1985.
[29] Allen, R.G., Perevia, L.S., Raes, D., Smith, M., Crop evapotranspiration: Guidelines for computing crop water requirements. FAO Irrigation and Drainage Paper No. 56, Food and Agriculture Organization, Rome, Italy, 1998, 15 s.
![Figure 4. Geological Map of The Study Area [22]](https://thumb-eu.123doks.com/thumbv2/9libnet/3704857.24779/8.918.278.645.192.503/figure-geological-map-study-area.webp)