EUROPEAN ORGANIZATION FOR NUCLEAR RESEARCH (CERN)
CERN-EP/2017-049 2017/07/12
CMS-B2G-16-015
Search for tt resonances in highly boosted lepton+jets and
fully hadronic final states in proton-proton collisions at
√
s
=
13 TeV
The CMS Collaboration
∗Abstract
A search for the production of heavy resonances decaying into top quark-antiquark pairs is presented. The analysis is performed in the lepton+jets and fully hadronic
channels using data collected in proton-proton collisions at √s = 13 TeV using the
CMS detector at the LHC, corresponding to an integrated luminosity of 2.6 fb−1.
The selection is optimized for massive resonances, where the top quarks have large Lorentz boosts. No evidence for resonant tt production is found in the data, and up-per limits on the production cross section of heavy resonances are set. The exclusion limits for resonances with masses above 2 TeV are significantly improved compared
to those of previous analyses at√s=8 TeV.
Published in the Journal of High Energy Physics as doi:10.1007/JHEP07(2017)001.
c
2017 CERN for the benefit of the CMS Collaboration. CC-BY-3.0 license
∗See Appendix A for the list of collaboration members
1
1
Introduction
Numerous extensions of the standard model (SM) predict the existence of new interactions with enhanced couplings to third-generation quarks, especially the top quark. The associated mas-sive new particle contained in these theories could be observed as a tt resonance in experiments
at the CERN LHC. Examples of such resonances are: massive color-singlet Z-like bosons (Z0)
in extended gauge theories [1–3], colorons [4–7] and axigluons [8–10] in models with extended strong interaction sectors, heavier Higgs siblings in models with extended Higgs sectors [11], and Kaluza–Klein (KK) excitations of gluons [12], electroweak gauge bosons [13], and gravi-tons [14] in various extensions of the Randall–Sundrum (RS) model [15, 16]. These models predict the existence of TeV-scale resonances with production cross sections of a few picobarns
at√s = 13 TeV. In all of these examples, resonant tt production would be observable in the
reconstructed invariant mass spectrum of the top quark-antiquark pair (Mtt).
Searches performed at the Tevatron have set upper limits on the production cross section of
narrow Z0resonances with masses below 900 GeV that decay into tt and have a relative decay
widthΓ/M of 1.2% [17, 18]. Similarly, searches at the LHC have set sub-picobarn limits on the
production cross section of resonances in the 1–3 TeV mass range [19–26] at√s = 7 and 8 TeV.
The most stringent limits are from the CMS 8 TeV analysis [27], which combines searches in the fully hadronic, lepton+jets, and dilepton+jets channels. This work excludes narrow (1.2%
relative width) and wide (10% relative width) Z0 bosons with masses of up to 2.4 and 2.9 TeV,
respectively, and an RS KK gluon with mass of up to 2.8 TeV, at the 95% CL.
In this paper, we present a search for the production of heavy spin-1 or spin-2 resonances decaying into tt pairs using the analysis methods described in Ref. [27]. We use data recorded
in 2015 with the CMS detector in proton-proton (pp) collisions at √s = 13 TeV at the LHC,
corresponding to an integrated luminosity of 2.6 fb−1. Four benchmark models are considered:
a Z0boson decaying exclusively to tt with relative decay widths of 1%, 10%, and 30%, and a KK
gluon resonance in the RS model (having a relative decay width of approximately 17%). The Z0
events are generated in the framework of the sequential SM (SSM) [28]. Although the 1% and 30% widths are unphysical for various masses in that model, assuming SM-like couplings to quarks, this approach enables us to present limits as a function of width, allowing the results to be reinterpreted in models with different resonance widths. The RS KK gluon model is provided as an example of a specific, well-motivated model with a predicted physical width.
A search is performed using the Mttspectrum for resonances with masses greater than 500 GeV,
where the top quarks from the resonance decay have large Lorentz boosts. The analysis is performed using the lepton+jets and fully hadronic tt decay modes. The lepton+jets channel is
tt→ (W+b)(W−b) → (q1q2b)(`−ν`b) (or charge conjugate),
where one W boson decays hadronically, and the other decays to a muon or an electron, and the associated neutrino. The fully hadronic channel is
tt→ (W+b)(W−b) → (q1q2b)(q3q4b),
where both W bosons decay hadronically. The sensitivity of the search is improved by identify-ing jets originatidentify-ing from the hadronization of b quarks (b jets), and separatidentify-ing the samples into categories that depend on the number of leptons (0 or 1), the lepton flavor (electron or muon), the number of jets consistent with a hadronic top quark decay (“t-tagged” jets), and the number of b jets or b subjets (where subjets are smaller jets found within a given jet). In the lepton+jets channel, the resulting samples consist mainly of events from SM tt production or from W bo-son production in association with jets. In the fully hadronic channel, the resulting samples are
dominated by SM tt and non-top multijet production. We refer to the latter as NTMJ, and this category comprises events from quantum chromodynamic (QCD) interactions as well as from other processes that result in jet production. The term “QCD multijet” is used to describe the class of interactions considered in the generation of samples of simulated events arising solely from QCD processes.
In this paper, Section 2 describes the CMS detector, while Sections 3 and 4 describe the tech-niques used for object reconstruction and the properties of simulated events utilized in the analysis, respectively. Section 5 describes the event selections applied in each channel of the analysis, and Section 6 outlines the methods developed to estimate the various background components using fitting procedures. Finally, Section 7 contains the results of the analysis in the form of cross section limits on new physics models, and Section 8 summarizes the work.
2
The CMS detector
The central feature of the CMS apparatus [29] is a superconducting solenoid of 6 m internal diameter, providing a magnetic field of 3.8 T. Within the solenoid volume are a silicon pixel and strip tracker, a lead tungstate crystal electromagnetic calorimeter (ECAL), and a brass and
scintillator hadron calorimeter (HCAL). In the region|η| <1.74, the HCAL cells have widths
of 0.087 in pseudorapidity (η) and 0.087 radians in azimuth (φ). In the η–φ plane, and for |η| <1.48, the HCAL cells map on to 5×5 ECAL crystals arrays to form calorimeter towers
projecting radially outwards from close to the nominal interaction point. For |η| > 1.74, the
coverage of the towers increases progressively to a maximum of 0.174 in∆η and ∆φ. Within
each tower, the energy deposits in ECAL and HCAL cells are summed to define the calori-meter tower energies, subsequently used to provide the energies and directions of hadronic jets. Electron momenta are estimated by combining the energy measurement in the ECAL with the momentum measurement in the tracker. Extensive forward calorimetry complements the coverage provided by the barrel and endcap detectors. Muons are measured in gas-ionization detectors embedded in the steel flux-return yoke outside the solenoid. A more detailed de-scription of the CMS detector, together with a definition of the coordinate system used and the relevant kinematic variables, can be found in Ref. [29].
3
Event reconstruction
Event reconstruction is based on the CMS particle-flow (PF) algorithm [30, 31], which takes into account information from all subdetectors, including measurements from the tracking sys-tem, energy deposits in the ECAL and HCAL, and tracks reconstructed in the muon detectors. Given this information, all particles in the event are reconstructed as electrons, muons, photons, charged hadrons, or neutral hadrons.
Primary vertices are reconstructed using a deterministic annealing filtering algorithm [32]. The leading primary vertex of the event is defined as the primary vertex with the largest squared
sum of transverse momenta (pT) of associated charged particles. Charged particles
associ-ated with other primary vertices due to additional interactions within the same bunch crossing (“pileup”) are removed from further consideration.
Muons are reconstructed using the information collected in the muon detectors and the inner
tracking detectors, and are measured in the range |η| < 2.4. Tracks associated with muon
candidates must be consistent with muons originating from the leading primary vertex, and are required to satisfy identification requirements. Matching muon chamber information to
3
tracks measured in the silicon tracker results in a pT resolution of 1.3–2.0% in the barrel and
better than 6% in the endcaps for muons with 20 < pT < 100 GeV. The pT resolution in the
barrel is better than 10% for muons with pTup to 1 TeV [33].
Electron candidates are reconstructed in the range|η| <2.5 by combining tracking information
with energy deposits in the ECAL. Candidates are identified [34] using information on the spatial distribution of the shower, the track quality, and the spatial match between the track and electromagnetic cluster, the fraction of total cluster energy in the HCAL, and the level of activity in the surrounding tracker and calorimeter regions. The transverse momentum resolution for
electrons with pT ≈45 GeV from Z→ee decays ranges from 1.7% for nonshowering electrons
in the barrel region to 4.5% for electrons showering in the endcaps [34].
Jets are clustered using PF candidates as inputs to the anti-kTalgorithm [35] in the FASTJET3.0
software package [36] using two different choices of the distance parameter: R = 0.4 and 0.8.
In the following, we refer to the first set of jets as AK4 or small-radius jets, and the second set of jets as AK8 or large-radius jets. For both the small- and large-radius jets, corrections based on the jet area [37] are applied to the energy of the jets to remove the energy contributions from neutral hadrons from pileup interactions. Subsequent corrections are used to account for the combined response function of the calorimeters in both jet energy and mass, as a function of
ηand pT [38]. The jet energy resolution varies from 15% at 10 GeV to 8% at 100 GeV to 4% at
1 TeV for the small-radius jets, and degrades by a few percent for the large-radius jets. The small-radius jets associated with b quarks are identified using the Combined Secondary Vertex v2 (CSVv2) algorithm [39, 40]. The working point used for jet b tagging in this analysis has an
efficiency of≈65% (in tt simulated events) and a mistag rate (the fraction of light-flavor jets
that are incorrectly tagged) of≈1% [40].
The large-radius jets with pT >500 GeV are taken as hadronic top quark candidates. To identify
true top quark decays, the “CMS top tagger v2” algorithm [41] is used. In this algorithm, the constituents of the AK8 jets are reclustered using the Cambridge–Aachen algorithm [42, 43]. The “modified mass drop tagger” algorithm [44], also known as the “soft drop” (SD) algo-rithm, recursively declusters a jet into two subjets, discarding soft and wide-angle radiation jet components until a hard splitting criterion is met, to obtain jets consistent with boosted heavy-object decays. This algorithm has been shown to improve jet mass resolution by approximately 40% relative to standard reconstruction techniques [45]. The algorithm is used with
angu-lar exponent β = 0, soft cutoff threshold zcut < 0.1, and characteristic radius R0 = 0.8 [46].
This algorithm is also able to identify two subjets within the AK8 jet. The subjet correspond-ing to the b quark can be identified uscorrespond-ing subjet b taggcorrespond-ing techniques [39]. Specifically, the CSVv2 algorithm, as described above, identifies b-tagged subjets. The algorithm has a com-parable performance when applied to subjets, but the uncertainties are larger because of the limited number of highly boosted objects used to measure its efficiency. The N-subjettiness
observables τN are calculated using all PF candidates in the AK8 jet. Each corresponds to a
pT-weighted minimum distance from one of N hypothesized subjet axes, defined by the
one-pass minimization procedure. These observables are used to quantify the consistency of the
particles of a jet with an N-prong decay topology. The variable τ32 =τ3/τ2[47, 48] is employed
to identify the three-pronged substructure of a hadronically decaying top quark. The specific working point used in this analysis is defined by requiring that the soft-dropped mass of the
jet satisfies 110 < MSD < 210 GeV and the N-subjettiness variable satisfies τ32 < 0.69, which
corresponds to a misidentification rate (for light-flavor quark and gluon jets) in simulation of 3% [41]. This working point selects top quark jets with an efficiency of approximately 40%
when the jet pT is above 500 GeV. Jets selected by the jet mass and N-subjettiness criteria are
they contain at least one soft-dropped subjet identified as b-tagged using the working point described above.
The missing pT in the plane transverse to the beam direction is reconstructed as the negative
vector sum of the pT of all PF candidates reconstructed in the event [38]. Its magnitude is
denoted by pmissT . Corrections to the jet energy scale and jet energy resolution are propagated
to the measurement of pmissT .
4
Simulated events
The simulation of Z0 resonances is performed with the leading-order MADGRAPHv5.2.2.2 [49]
Monte Carlo (MC) program using SM values for the left- and right-handed Z0couplings to top
quarks. The simulation is performed for a range of Z0 masses between 0.5 and 4.0 TeV, and for
the three relative width hypotheses of 1%, 10%, and 30%. Higher-order QCD multijet processes
for up to three extra partons are simulated at tree level. The Z0 boson is required to decay into
a tt pair in all generated events. The parton showering and hadronization is modeled with
PYTHIA 8.205 [50, 51], and the MLM algorithm [52] is used to match the parton shower to the matrix element calculation with a merging scale of 35 GeV.
The simulation of KK excitations of a gluon is performed with the PYTHIAprogram. The KK
gluon excitations are simulated with resonance masses between 0.5 and 4.0 TeV, assuming the
branching fraction of the KK gluon into top quark pairs is≈94%, with the branching fraction to
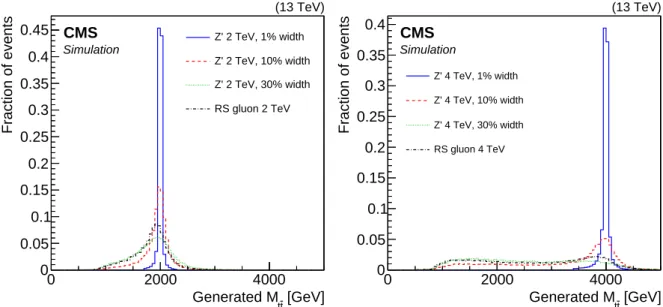
bottom (light) quark pairs being 5% (<1%) [12]. Figure 1 shows the generator-level Mtt
distri-butions for resonance masses of 2 TeV and 4 TeV, for the various signal hypotheses considered. For the highest-mass samples considered, the resonance production is dominated by off-shell
contributions, giving the long tail toward low values of Mttseen in the distributions.
[GeV] t t Generated M 0 2000 4000 Fraction of events 0 0.05 0.1 0.15 0.2 0.25 0.3 0.35 0.4 0.45 Z' 2 TeV, 1% width Z' 2 TeV, 10% width Z' 2 TeV, 30% width RS gluon 2 TeV (13 TeV) CMS Simulation [GeV] t t Generated M 0 2000 4000 Fraction of events 0 0.05 0.1 0.15 0.2 0.25 0.3 0.35 0.4 Z' 4 TeV, 1% width Z' 4 TeV, 10% width Z' 4 TeV, 30% width RS gluon 4 TeV (13 TeV) CMS Simulation
Figure 1: Distributions of generator-level Mttfor the production of new particles with masses
of 2 TeV (left) and 4 TeV (right), for the four signal hypotheses considered in this analysis. Background events from tt production via QCD interactions and electroweak production of single top quarks in the tW channel are simulated with the next-to-leading order (NLO)
gen-eratorPOWHEG(v2) [53–57]. The s- and t-channel processes of single top quark production are
simulated with MADGRAPH5 aMC@NLO v5.2.2.2 [49]. All events are interfaced withPYTHIA
5
The associated production of W or Z boson and jets is simulated using MADGRAPH. The MLM
matching scheme is applied to match the showers generated with PYTHIA. Up to four
addi-tional partons in the matrix element calculations are included. The tt, W/Z+jets, and single-top-quark samples are normalized to the theoretical predictions described in Refs. [58–61].
Di-boson processes (VV = WW, WZ, and ZZ) are simulated with PYTHIA for both the matrix
element and parton showering calculations. The event rates are normalized to the NLO cross sections from Ref. [62].
Simulated QCD multijet events, generated withPYTHIA, are used to validate the
background-estimation procedure in the fully hadronic channel, but not in the search, where the NTMJ background is estimated from sideband regions in data.
All events are generated at the center of mass energy of 13 TeV and use the NNPDF 3.0 parton
distribution functions (PDF) [63]. In the parton shower simulated withPYTHIA, the underlying
event tune CUETP8M1 [64, 65] has been used. All simulated samples include the effects of additional inelastic proton-proton interactions within the same or adjacent bunch crossings.
5
Event selection and categorization
5.1 Lepton+jets channel
Events in the muon channel are collected with a single-muon trigger, which requires the
pres-ence of a muon with pT > 45 GeV and|η| < 2.1. The trigger selection employed in the
elec-tron channel requires an elecelec-tron with pT > 45 GeV, |η| < 2.5, and at least two jets with
pT > 200 (50) GeV for the leading (subleading) AK4 jet reconstructed at trigger level. These
trigger choices ensure an efficiency of about 99% for high-mass signal events.
In the lepton+jets analysis, we select events offline containing one muon with pT > 50 GeV
and|η| < 2.1 or one electron with pT > 50 GeV and|η| < 2.5, and at least two AK4 jets with
|η| < 2.4. In the muon (electron) channel, the leading AK4 jet is required to have pT >150
(250) GeV, and the subleading AK4 jet must have pT >50 (70) GeV. Additional reconstructed
jets, utilized in the reconstruction of the tt system, are required to have pT >30 GeV. Given
the highly-boosted topology of the final-state objects, no isolation requirements are applied to the leptons at the trigger level or in the analysis stages. However, events are required to pass a
two-dimensional selection of∆R(`, j) >0.4 or prel
T (`, j) >20 GeV, where j is the small-radius jet
with minimal angular separation∆R=
√
(∆η)2+ (∆φ)2from the lepton`(electron or muon),
and prelT (`, j)is the component of the lepton momentum orthogonal to the axis of jet j. The
val-ues of∆R(`, j)and prel
T (`, j)are calculated considering small-radius jets with pT >15 GeV and
|η| <3.0. The values used are optimized for this analysis. This two-dimensional selection effec-tively replaces the more conventional lepton isolation requirement, as it significantly reduces the background from NTMJ production while maintaining high efficiency for the high-mass signal hypotheses.
Events in the muon channel are required to have pmissT > 50 GeV and (pmissT +p`T) >150 GeV.
In the electron channel, where jets are often misidentified as electrons, we find that the most
effective approach for rejecting NTMJ events is to require only pmiss
T >120 GeV. After these
requirements, the contributions from NTMJ production in both lepton channels are found to be negligible. We also reject events that contain a second lepton to ensure there is no overlap between the event samples and to maintain a clear distinction between lepton+jets and dilep-ton+jets analyses. Finally, we veto events with two t-tagged jets to ensure orthogonality to the fully hadronic analysis. This veto has a negligible impact on the signal efficiency of the
lepton+jets analysis.
The kinematic reconstruction of the tt system in the lepton+jets channel is performed by as-signing the products in the final state to either the leptonic or hadronic branch of the tt system.
We first assign the charged lepton and pmissT to the leptonic branch of the event, where pmissT
is interpreted as the pT of the neutrino, pz(ν). The longitudinal component of the neutrino
momentum is inferred by constraining the invariant mass of the` +νsystem to match the W
boson mass. This procedure leads to a quadratic equation in pz(ν). If two real solutions are
found, hypotheses are built for both cases. If no real solutions are available, the real part is
taken as pz(ν). In events without t-tagged jets, only small-radius jets are used to reconstruct
both the leptonic and hadronic top decays.
In events containing a t-tagged jet, the large-radius jet is assigned to the hadronically decaying
top quark. Only small-radius jets with a separation of∆R> 1.2 from the t-tagged jet are used
in the reconstruction of the leptonic top quark decay. Because of the presence of multiple tt
hypotheses per event, a two-term χ2discriminator is used to quantify the compatibility of each
hypothesis with a tt decay. The discriminator is defined as χ2= Mlep−Mlep σMlep !2 + Mhad−Mhad σMhad !2 , (1)
where Mlepand Mhadare the invariant masses of the reconstructed semileptonically and
hadron-ically decaying top quark, respectively. The quantities σMlepand σMhad are the resolutions of the
leptonic and hadronic top quark reconstruction, respectively, and Mlepand Mhadare the means
of the corresponding mass distributions. The values of Mlep, σMlep, Mhad, and σMhadare derived
using a sample of simulated events in which all four partons of the final state top quark decay products are matched to a reconstructed jet used in the hypothesis. In each event, the tt pair
reconstructed with the smallest value of χ2(labeled χ2min) is chosen. In events with a t-tagged
jet, Mhad is given by the mass of the large-radius jet calculated using the soft drop algorithm.
This choice is made because, compared to the conventional jet mass, the soft dropped mass
is much less dependent on the jet pT, and therefore on the resonance mass in a given signal
hypothesis. Moreover, this provides greater discrimination between background and signal.
Events in the signal region are required to have χ2min < 30 for all lepton+jets categories. This
upper threshold on χ2minreduces the contribution of events from non-tt background processes
and maximizes the expected sensitivity of the analysis to new resonances.
Finally, to further enhance sensitivity, events are categorized according to the number of t-tagged
and b-tagged jets as follows : events with one t-tagged jet(1 t tag); events with zero t-tagged
jets and at least one b-tagged jet(0 t tag, 1 b tag); and events with zero t-tagged and b-tagged
jets(0 t tag, 0 b tag).
5.2 Fully hadronic channel
The fully hadronic channel requires that at least two jets satisfy kinematic and t tagging selec-tion criteria. The data were collected online with a trigger requiring the scalar sum of the AK4
jet energies (HT) to be larger than 800 GeV. The trigger selection has an efficiency of above 95%,
as measured in simulation, for events that satisfy the offline requirement HT > 1000 GeV. The
event reconstruction is performed using only AK8 jets. The two leading jets are required to
have pT > 500 GeV, rapidity |y| < 2.4, and both are required to be t tagged. A back-to-back
topology is selected by requiring the azimuthal separation of the two leading jets to satisfy |∆φ| >2.1.
5.3 Tagging variables in lepton+jets and fully hadronic channels 7
Events are further categorized into six regions based on two criteria: the rapidity difference (∆y) between the two AK8 jets and the number of jets with at least one b-tagged subjet for
the two highest pT jets. Events can contain 0, 1, or 2 jets with a b-tagged subjet, and they are
separated into bins of|∆y| <1.0 and|∆y| >1.0.
5.3 Tagging variables in lepton+jets and fully hadronic channels
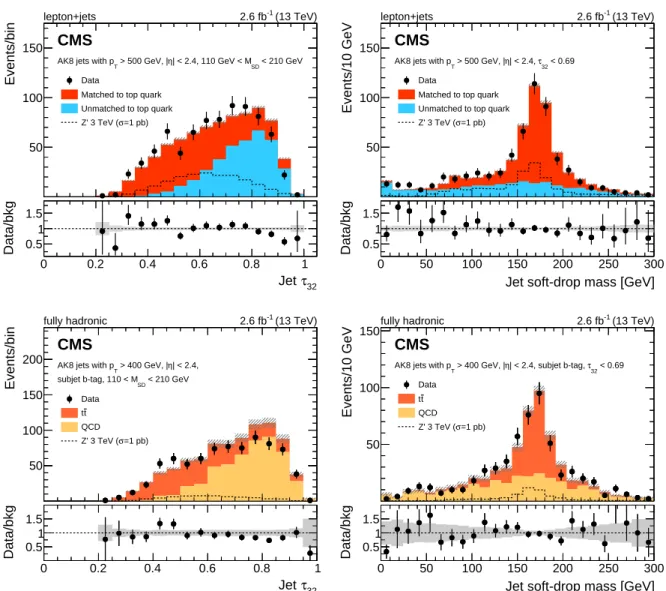
The distributions of the two variables used in the t tagging algorithm, τ32and MSD, are shown
in Fig. 2 for the lepton+jets channel (upper row) and the fully hadronic channel (lower row). Each of the figures is obtained after removing the selection on the quantity being plotted, while maintaining all other analysis-level selections. We observe good agreement between data and simulation in the lepton+jets decay channel, where simulated events are divided into contri-butions from generator-level top quarks and other jets from tt events and subdominant back-ground processes. The fully hadronic channel also shows good agreement between the simu-lated distribution and data. The small discrepancies do not affect the analysis, as it relies on data to estimate the NTMJ contribution to the background. Some discrepancy is visible at high
values of τ32, however this region is excluded by the selection used for t tagging.
6
Background model and normalization
In this section, we describe the sources of the SM background and methods of background estimation for both the lepton+jets and fully hadronic channels. We then introduce the sources of systematic uncertainty considered in this analysis. Finally, we describe the treatment of the backgrounds and uncertainties in the maximum likelihood fit that is used to determine the total yield of SM processes and in the statistical analysis of data.
6.1 Lepton+jets channel
Several SM processes contribute to the sample obtained from the lepton+jets selection de-scribed in Section 5. The two main background processes are tt and W+jets production. The
latter accounts for a sizeable portion of the background in the(0 t tag, 0 b tag)category, whereas
the former fully dominates the(0 t tag, 1 b tag)and(1 t tag)categories. Single top quark, Z+jets,
and diboson production contribute only a small fraction of the background.
The distributions obtained from simulation are corrected to account for known discrepancies in the observed number of data and simulated events. In particular, we derive a scale factor (SF) between data and simulation for the t tagging mistag (t mistag) rate for AK8 jets from a
sample dominated by W+jets, selected by requiring events to have χ2min > 30. The remaining
contamination from tt is removed by subtracting the distribution of tt events in simulation. The t mistag rate is measured separately for the muon and electron channels, in data and sim-ulation. The resulting values, together with the data-to-simulation SFs, are shown in Table 1. As the SFs for the muon and electron channels are consistent, the weighted average is used:
SF` =0.79±0.15.
Table 1: The mistag rates in data and simulation, and their ratio (data/simulation SF), for AK8 jets in the lepton+jets analysis.
Channel Eff. in data Eff. in MC SF
e+jets 0.038±0.010 0.051±0.002 0.74±0.20
µ+jets 0.043±0.012 0.051±0.002 0.85±0.24
Events/bin
50 100 150
Data
Matched to top quark Unmatched to top quark
=1 pb) σ Z' 3 TeV ( CMS (13 TeV) -1 2.6 fb < 210 GeV SD | < 2.4, 110 GeV < M η > 500 GeV, | T
AK8 jets with p
lepton+jets 32 τ Jet 0 0.2 0.4 0.6 0.8 1 Data/bkg 0.5 1 1.5 Events/10 GeV 50 100 150 Data
Matched to top quark Unmatched to top quark
=1 pb) σ Z' 3 TeV ( CMS (13 TeV) -1 2.6 fb < 0.69 32 τ | < 2.4, η > 500 GeV, | T
AK8 jets with p
lepton+jets
Jet soft-drop mass [GeV]
0 50 100 150 200 250 300 Data/bkg 0.5 1 1.5 Events/bin 50 100 150 200 CMS (13 TeV) -1 2.6 fb < 210 GeV SD subjet b-tag, 110 < M | < 2.4, η > 400 GeV, | T
AK8 jets with p
fully hadronic Data t t QCD =1 pb) σ Z' 3 TeV ( 32 τ Jet 0 0.2 0.4 0.6 0.8 1 Data/bkg 0.5 1 1.5 Events/10 GeV 50 100 150 CMS (13 TeV) -1 2.6 fb < 0.69 32 τ | < 2.4, subjet b-tag, η > 400 GeV, | T
AK8 jets with p
fully hadronic Data t t QCD =1 pb) σ Z' 3 TeV (
Jet soft-drop mass [GeV]
0 50 100 150 200 250 300
Data/bkg 0.5
1 1.5
Figure 2: Distributions of the N-subjettiness ratio, τ32, and the soft dropped mass, MSD, for
AK8 jets in data and simulation, after the signal selection. For lepton+jets, with pT >500 GeV
(upper row). For the fully hadronic final state, with pT > 400 GeV and subjet b tag (lower
row). The distribution of τ32(left) is shown after the selection 110< MSD <210 GeV, and the
distribution of MSD(right) is shown after the selection τ32<0.69. The lepton+jets channel plots
compare data to background simulation, where the latter is divided into contributions from jets matched at the generator level to top quarks and other jets in top pair or W+jets events. The fully hadronic channel plots compare data to tt and QCD multijet simulation. Contributions
from a benchmark narrow Z0signal model are shown with the black dashed lines. In obtaining
the final results, NTMJ production is estimated from data, and simulated QCD multijet events are not used. In all plots, the error bars include only statistical contributions.
6.2 Fully hadronic channel 9
hypothesis to data [66]. Distributions defined in samples dominated by various backgrounds are used simultaneously in a binned maximum likelihood fit to constrain the different
uncer-tainties in the background model using the data. The reconstructed Mttdistribution is used in
regions dominated by tt and W+jets, and the dimuon invariant mass is used in a region
domi-nated by Z+jets. The tt-domidomi-nated region is defined by Mtt <2 TeV and χ2min< 30. The region
dominated by W+jets events is defined by χ2min > 30. For each of these two latter regions, six
exclusive categories are defined based on lepton flavor and number of b-tagged and t-tagged
jets ((1 t tag);(0 t tag, 1 b tag); (0 t tag, 0 b tag)), giving a total of 12 control regions (CRs). One
additional CR, dominated by Z+jets, is defined by removing the lepton veto from the µ+jets
selection and adding the Z boson mass window requirement 71< Mµµ <111 GeV. The Z→ee
channel is not used because of the stringent requirement on pmissT .
6.2 Fully hadronic channel
The fully hadronic channel has two primary sources of SM background: tt events and NTMJ
production. The shape of the Mtt distribution for tt events is taken from simulation. The
nor-malization of this distribution is initially set to the theoretical cross section, but is allowed to vary within both rate and shape uncertainties during the statistical analysis. The shape and normalization are both fitted and extracted for each of the six event categories. The variation of the tt contribution to the total background predominantly affects the signal regions with two subjet b tags, which have tt as the dominant background component.
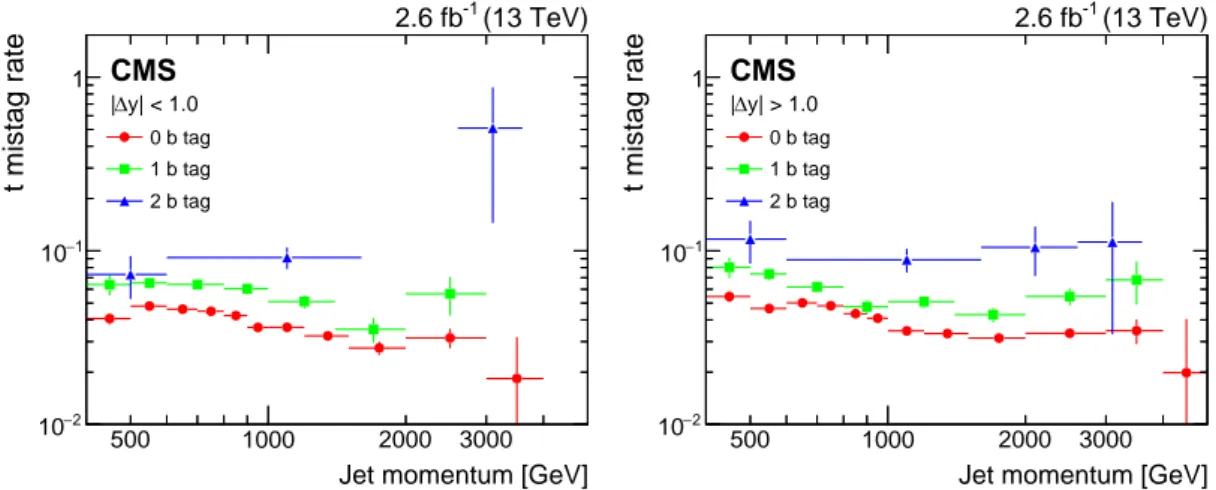
For the NTMJ estimate, we use a data-driven technique similar to that described in Ref. [25]. The method involves selecting a sample of data events with low SM tt contribution by invert-ing the t tagginvert-ing N-subjettiness requirement on one selected jet (anti-tag), and determininvert-ing the
t tagging rate for the second jet (probe). The anti-tag jet is required to satisfy 110 < MSD <
210 GeV and τ32 >0.69. This “anti-tag and probe” method yields a per-jet t mistag rate
param-eterized as a function of jet momentum (which is more closely tied to the radiation within the
jet than is the pT) and is measured separately for events falling into each of the six b tag and|∆y|
categories (Fig. 3). The anti-tag requirement is designed to select a sample in data dominated by NTMJ events. A small number of genuine tt events survive this selection. This contamination is removed by subtracting the distributions measured in tt simulation from those measured in the anti-tag and probe selection in data.
Once the t mistag rate has been determined from the NTMJ control sample, it is used to estimate the normalization and shape of NTMJ events passing the final event selection. To do this, we use a “single-tagged” region that contains events with at least one t-tagged jet. To avoid bias, we randomly select one of the two leading top quark jet candidates and require that it pass the t tagging selection described above. If the randomly chosen jet is t tagged, we include this event and weight it by the appropriate t mistag rate based on the momentum of the jet opposite the tagged jet, their rapidity difference, and the number of subjet b tags, as shown in Fig. 3.
This singly-tagged control region without any requirements on the second jet has an overlap with the signal region, and is used to estimate the NTMJ background. To remove the effects of double-counting, the tt contribution is subtracted from the NTMJ estimate. This is done by evaluating the t mistag weighting procedure described above on the simulated tt events, to find the contribution of tt events that would enter the NTMJ background estimate when the method is applied to data. This contribution amounts to a tt contamination of about 1–2% of the NTMJ background estimate in the 0 b-tag event regions (about 6–10% in the other regions), and is subtracted from the NTMJ background estimate.
Jet momentum [GeV] 500 1000 2000 3000 t mistag rate 2 − 10 1 − 10 1 CMS (13 TeV) -1 2.6 fb y| < 1.0 ∆ | 0 b tag 1 b tag 2 b tag
Jet momentum [GeV]
500 1000 2000 3000 t mistag rate 2 − 10 1 − 10 1 CMS (13 TeV) -1 2.6 fb y| > 1.0 ∆ | 0 b tag 1 b tag 2 b tag
Figure 3: The mistag rate for the t tagging algorithm in the fully hadronic channel, measured with data for the six event categories by an anti-tag and probe procedure. The round, square, and triangular points indicate the t mistag rate for events in the 0, 1, and 2 b tag categories,
re-spectively. The left (right) plot contains events with|∆y| <1.0 (>1.0). The contamination from
tt production is removed by subtracting the distribution of tt events in simulation, normalized to SM expectation.
the fact that the second jet, having no t tagging applied, has different kinematics than jets in the signal region. To mimic the kinematics of the signal region, a “mass-modified” procedure is used, in which we randomly set the mass of this second jet according to a distribution of jet masses from simulated QCD multijet events, using the same window as used to select the
signal region selection, 110< MSD<210 GeV. This method is validated using simulated QCD
multijet events.
6.3 Systematic uncertainties
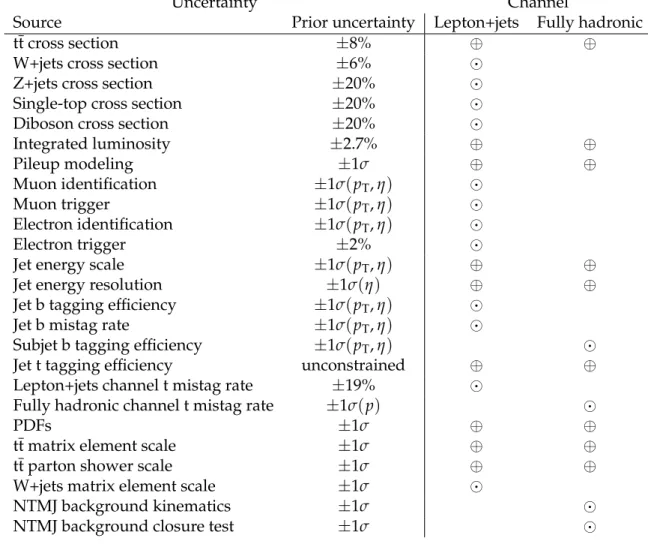
Several sources of systematic uncertainties are considered in this search. Each of these is related to an experimental uncertainty introduced in the reconstruction of the event or to a theoretical uncertainty affecting the simulation of certain background or signal processes. In particular, we quantify the effect of each of these uncertainties on the measurement of the invariant mass of the reconstructed tt system. These uncertainties are taken into account in the maximum likelihood fit to determine the total yield of SM processes, and in the statistical interpretation of the data. The complete list of systematic uncertainties is given below, and Table 2 lists the sources of uncertainty and the channels they affect.
The effect of the uncertainties in the theoretical SM cross sections for tt, W+jets and Z+jets production are obtained from the background fit described above, and are 8% for tt, 6% for W+jets, and 20% for Z+jets production. Small contributions to the event yields arise from single top quark and diboson production. Their normalization is taken from theory [60, 67– 70] and assigned a 20% uncertainty. The effect due to missing higher-order corrections in the simulation of tt and W+jets production in the SM is estimated by varying the renormalization and factorization scales used in the simulation up and down independently by a factor of 2. Additionally, we account for uncertainties in the simulation of initial- and final-state radiation
on the reconstruction of the tt system by using tt events simulated with different Q2scales used
for the parton shower generation and evolution. Simulated samples for both background and signal processes are generated using PDFs from the NNPDF 3.0 set [63]. The corresponding systematic uncertainty is determined according to the procedure described in Ref. [71]. The
6.4 Fitting procedure 11
uncertainty associated with the yield of simulated pileup events is evaluated by varying the
inelastic pp cross section [73] by±5% (σinel=72.0±3.6 mb).
The systematic uncertainties related to the muon identification and trigger efficiencies are treated
as uncorrelated, and both are applied as functions of the muon pT and η [33]. The
uncertain-ties are obtained by varying each corresponding data-to-simulation SF by one standard devi-ation. Additional systematic uncertainties of 1% and 0.5% are attributed to the identification and trigger efficiency SF measurements, respectively. Similarly, the uncertainty in the electron
identification efficiency is applied as a function of the electron pT and η [34]. An uncertainty
of 2% is assigned to the efficiency of the electron trigger selection, and is determined from a complementary measurement of the e+jets trigger efficiency in a dilepton (eµ) control region. The uncertainties in the data-to-simulation corrections for jet energy scale and jet energy reso-lution are evaluated by varying these corrections within their uncertainties, as functions of the
jet pT and η. Both systematic variations are also propagated to the measurement of pmissT and
the jet mass. A SF is applied to account for differing efficiencies and misidentification rates of the b tagging selection between data and simulation. Uncertainties in the SFs are measured
as functions of the jet pT and treated as uncorrelated. The data-to-simulation correction for
the subjet b tagging algorithm efficiency is also included as an independent uncertainty and is
evaluated by varying the correction within its uncertainties, as a function of jet pT and η. The
data-to-simulation correction for the efficiency of the t tagging selection for AK8 jets is mea-sured in situ in the statistical analysis. This is done by leaving this parameter unconstrained in the fit. The t mistag efficiency in the lepton+jets channel (dominated by quarks from W+jets) is measured directly in a control region dominated by W+jets production with an uncertainty of 19%. The t mistag rate in the fully hadronic channel (dominated by gluons from QCD interac-tions) is measured as described above, with a momentum-dependent uncertainty ranging from 5 to 100%. These uncertainties are estimated by varying the anti-tag criterion for the construc-tion of the anti-tag and probe sample. Systematic uncertainties due to the t tagging efficiency and t mistag rate are treated as uncorrelated.
The systematic uncertainty associated with the “mass-modified” procedure, which is used to correct the kinematic bias in the background estimation, is computed by taking half the dif-ference between the uncorrected and “mass-modified” background estimates. This affects the
shape and normalization of the Mttdistribution. Simulated QCD multijet events are used in a
closure test to verify that the background estimation procedure accurately predicts the double
t-tagged Mttdistribution. An additional systematic uncertainty is assigned to the NTMJ
back-ground estimate based on small disagreements (up to 10%) observed in the closure test, in the
shape of the kinematic threshold at low values of Mtt.
6.4 Fitting procedure
To improve the flexibility of the background model, we estimate the central values and uncer-tainties in several parameters through a maximum likelihood fit to data using the top quark pair invariant mass distribution, as follows. The normalizations for the background estimates using simulated events are left unconstrained in the fit. The data-to-simulation SF for the t tagging efficiency is also unconstrained and extracted from the fit. The SF for the subjet b tag-ging efficiency as well as the yield of events from the NTMJ background estimation method,
having both pT and η dependence, are allowed to vary within uncertainties, with their final
values estimated by the fit. The NTMJ background is constrained using the procedure outlined in Section 6.2. All other systematic uncertainties are included as nuisance parameters in the fit, and are allowed to vary within their corresponding rate and shape uncertainties, as described
Table 2: Sources of uncertainty and the channels they affect. Uncorrelated uncertainties applied
to a given channel are labeled with a . Uncertainties that are correlated between channels
are labeled with a⊕. In this table, σ denotes the uncertainty in the given prior value in the
likelihood fit.
Uncertainty Channel
Source Prior uncertainty Lepton+jets Fully hadronic
tt cross section ±8% ⊕ ⊕
W+jets cross section ±6%
Z+jets cross section ±20%
Single-top cross section ±20%
Diboson cross section ±20%
Integrated luminosity ±2.7% ⊕ ⊕ Pileup modeling ±1σ ⊕ ⊕ Muon identification ±1σ(pT, η) Muon trigger ±1σ(pT, η) Electron identification ±1σ(pT, η) Electron trigger ±2%
Jet energy scale ±1σ(pT, η) ⊕ ⊕
Jet energy resolution ±1σ(η) ⊕ ⊕
Jet b tagging efficiency ±1σ(pT, η)
Jet b mistag rate ±1σ(pT, η)
Subjet b tagging efficiency ±1σ(pT, η)
Jet t tagging efficiency unconstrained ⊕ ⊕
Lepton+jets channel t mistag rate ±19%
Fully hadronic channel t mistag rate ±1σ(p)
PDFs ±1σ ⊕ ⊕
tt matrix element scale ±1σ ⊕ ⊕
tt parton shower scale ±1σ ⊕ ⊕
W+jets matrix element scale ±1σ
NTMJ background kinematics ±1σ
NTMJ background closure test ±1σ
above, using log-normal prior distributions. The best fit values obtained from this maximum likelihood evaluation are used to correct the distributions of background and signal processes. A Bayesian statistical method [66, 74] is used to extract the upper limits at 95% confidence level
(CL) on the product of the cross section and branching fraction, i.e. σ(pp → X) B(X → tt),
for heavy resonances decaying to a tt pair. In order to maximize the expected sensitivity of the search, twelve exclusive categories are employed simultaneously in the statistical analysis, as
described above. For each category, the observable used in the limit-setting procedure is Mtt.
A template-based shape analysis is performed using the Theta software package [66] for these
Mtt distributions. The systematic uncertainties listed in Table 2 are introduced as individual
nuisance parameters in the limit calculation. For the signal cross section parameter, we use a uniform prior distribution. The uncertainty in the data-to-simulation correction for t tagging efficiency is left unconstrained, whereas each of the other nuisance parameters corresponding to a systematic uncertainty is modeled with a log normal prior distribution. The uncertainty due to the finite size of the simulated samples is introduced in the statistical analysis accord-ing to the “Barlow–Beeston lite” method [75]. The impact of the statistical uncertainty in the
simulated samples is limited by rebinning each Mtt distribution to ensure that the statistical
6.4 Fitting procedure 13 Events / 100 GeV 1 10 2 10 Events / 100 GeV 1 10 2 10 Data Other t t Z’ 2.0 TeV, 1% width +jets, 1 t tag µ 2.6 fb-1 (13 TeV) CMS [GeV] t t M 0 1000 2000 3000 Data / Bkg 0.5 1 1.5 Events / 100 GeV 1 10 2 10 Events / 100 GeV 1 10 2 10 Data Other t t Z’ 2.0 TeV, 1% width
e+jets, 1 t tag 2.6 fb-1 (13 TeV)
CMS [GeV] t t M 0 1000 2000 3000 Data / Bkg 0.5 1 1.5 Events / 100 GeV 1 10 2 10 3 10 4 10 Events / 100 GeV 1 10 2 10 3 10 4 10 Data Other t t Z’ 2.0 TeV, 1% width
+jets, 0 t tag, 1 b tag
µ 2.6 fb-1 (13 TeV) CMS [GeV] t t M 0 1000 2000 3000 Data / Bkg 0.5 1 1.5 Events / 100 GeV 1 10 2 10 3 10 Events / 100 GeV 1 10 2 10 3 10 Data Other t t Z’ 2.0 TeV, 1% width
e+jets, 0 t tag, 1 b tag 2.6 fb-1 (13 TeV)
CMS [GeV] t t M 0 1000 2000 3000 Data / Bkg 0.5 1 1.5 Events / 100 GeV 1 10 2 10 3 10 4 10 Events / 100 GeV 1 10 2 10 3 10 4 10 Data Other t t Z’ 2.0 TeV, 1% width
+jets, 0 t tag, 0 b tag
µ 2.6 fb-1 (13 TeV) CMS [GeV] t t M 0 1000 2000 3000 Data / Bkg 0.5 1 1.5 Events / 100 GeV 1 10 2 10 3 10 Events / 100 GeV 1 10 2 10 3 10 Data Other t t Z’ 2.0 TeV, 1% width
e+jets, 0 t tag, 0 b tag 2.6 fb-1 (13 TeV)
CMS [GeV] t t M 0 1000 2000 3000 Data / Bkg 0.5 1 1.5
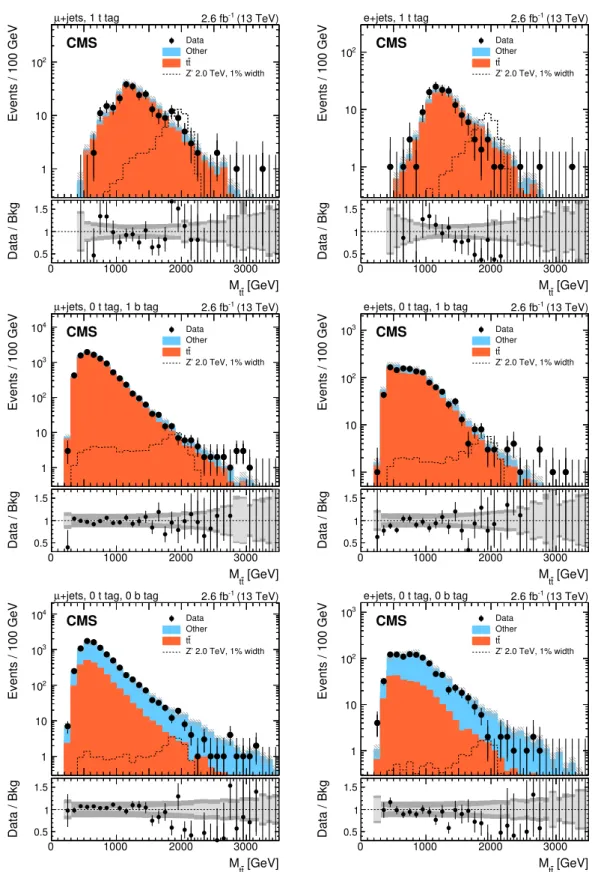
Figure 4: Distributions in Mttfor data and expected background, for events passing the signal
selection of the lepton+jets analysis (χ2 < 30) after the maximum likelihood fit.
Distribu-tions are shown for the muon (left) and electron (right) channel. For each lepton flavor, events
are split into three exclusive categories (from uppermost to lowest): (1 t tag),(0 t tag, 1 b tag),
and(0 t tag, 0 b tag). The signal templates are normalized to a cross section of 1 pb. The
un-certainties associated with the background expectation include the statistical and all post-fit systematic uncertainties. The lower panel in each figure shows the ratio of data to predicted SM background, with the statistical (light gray) and total (dark gray) uncertainties shown sep-arately.
Events / 100 GeV 1 10 2 10 3 10 Events / 100 GeV 1 10 2 10 3 10 Data NTMJ t t Z’ 2.0 TeV, 1% width y| < 1.0; 0 b tag ∆ | 2.6 fb-1 (13 TeV) CMS [GeV] t t M 1000 2000 3000 Data / Bkg 0.5 1 1.5 Events / 100 GeV 1 10 2 10 3 10 Events / 100 GeV 1 10 2 10 3 10 Data NTMJ t t Z’ 2.0 TeV, 1% width y| > 1.0; 0 b tag ∆ | 2.6 fb-1 (13 TeV) CMS [GeV] t t M 1000 2000 3000 4000 Data / Bkg 0.5 1 1.5 Events / 100 GeV 1 10 2 10 3 10 Events / 100 GeV 1 10 2 10 3 10 Data NTMJ t t Z’ 2.0 TeV, 1% width y| < 1.0; 1 b tag ∆ | 2.6 fb-1 (13 TeV) CMS [GeV] t t M 1000 2000 3000 Data / Bkg 0.5 1 1.5 Events / 100 GeV 1 10 2 10 Events / 100 GeV 1 10 2 10 Data NTMJ t t Z’ 2.0 TeV, 1% width y| > 1.0; 1 b tag ∆ | 2.6 fb-1 (13 TeV) CMS [GeV] t t M 1000 2000 3000 4000 Data / Bkg 0.5 1 1.5 Events / 100 GeV 1 10 2 10 Events / 100 GeV 1 10 2 10 Data NTMJ t t Z’ 2.0 TeV, 1% width y| < 1.0; 2 b tag ∆ | 2.6 fb-1 (13 TeV) CMS [GeV] t t M 500 1000 1500 2000 2500 Data / Bkg 0.5 1 1.5 Events / 100 GeV 1 10 Events / 100 GeV 1 10 Data NTMJ t t Z’ 2.0 TeV, 1% width y| > 1.0; 2 b tag ∆ | 2.6 fb-1 (13 TeV) CMS [GeV] t t M 1000 2000 3000 Data / Bkg 0.5 1 1.5
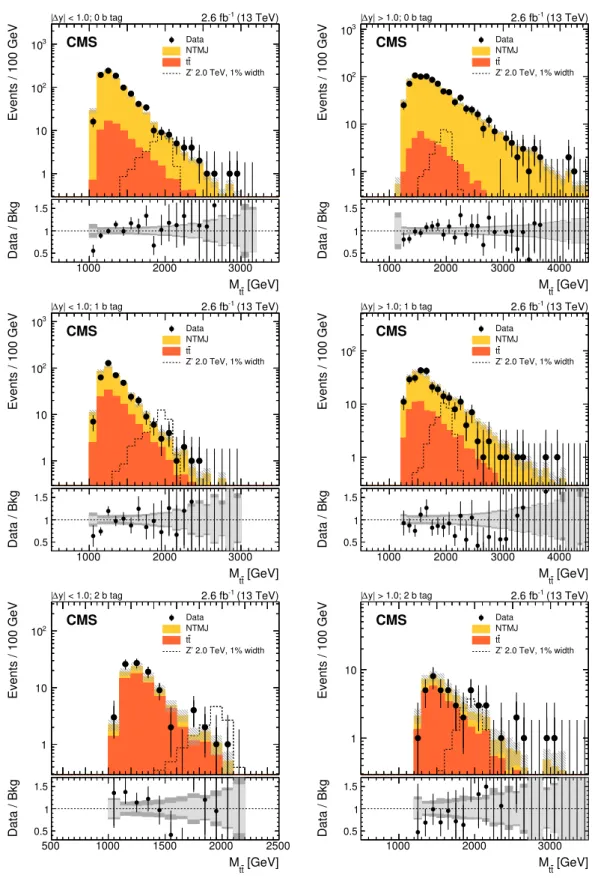
Figure 5: Distributions in Mttfor data and expected background, for events passing the signal
selection of the fully hadronic analysis after the maximum likelihood fit. Distributions are
shown for the regions with |∆y| < 1.0 (left) and |∆y| > 1.0 (right), for 0, 1, or 2 subjet b
tags (from uppermost to lowest). The signal templates are normalized to a cross section of 1 pb. The uncertainties associated with the background expectation include the statistical and all post-fit systematic uncertainties. The lower panel in each figure shows the ratio of data to predicted SM background, with the statistical (light gray) and total (dark gray) uncertainties shown separately.
15
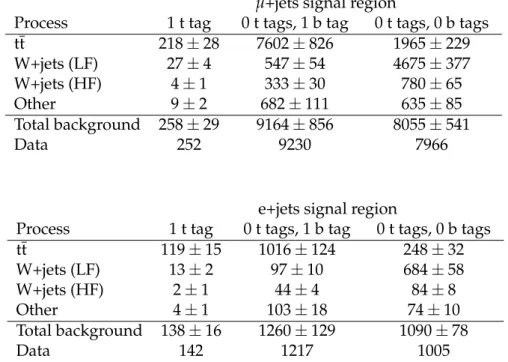
Table 3: Numbers of events in the signal region for the lepton+jets analysis. The expected yields for SM backgrounds are obtained from the maximum likelihood fit to the data described in Section 6.4. The uncertainties reported in the total expected background include the sta-tistical uncertainties in the simulation and all the posterior systematic uncertainties. For the W+jets background, LF (HF) indicates contributions from W bosons produced in association with light-flavor (heavy-flavor) jets.
µ+jets signal region
Process 1 t tag 0 t tags, 1 b tag 0 t tags, 0 b tags
tt 218±28 7602±826 1965±229 W+jets (LF) 27±4 547±54 4675±377 W+jets (HF) 4±1 333±30 780±65 Other 9±2 682±111 635±85 Total background 258±29 9164±856 8055±541 Data 252 9230 7966
e+jets signal region
Process 1 t tag 0 t tags, 1 b tag 0 t tags, 0 b tags
tt 119±15 1016±124 248±32 W+jets (LF) 13±2 97±10 684±58 W+jets (HF) 2±1 44±4 84±8 Other 4±1 103±18 74±10 Total background 138±16 1260±129 1090±78 Data 142 1217 1005
Table 4: Number of events in the signal region for the fully hadronic analysis. The expected yields for SM backgrounds are obtained from the maximum likelihood fit to data described in the text. The uncertainties reported for the total expected background include the statistical uncertainties on the simulation and all the posterior systematic uncertainties.
|∆y| >1.0 signal region
Process 0 b tags 1 b tag 2 b tags
SM tt 34±4.3 62±5.8 28±3.8
NTMJ 787±6.2 215±4.7 15±1.9
Total background 821±7.5 278±7.4 43±4.2
Data 830 264 46
|∆y| <1.0 signal region
Process 0 b tags 1 b tag 2 b tags
SM tt 66±7.1 121±10 60±7.0
NTMJ 817±8.0 248±7.0 19±1.7
Total background 882±11 369±12 79±7.3
Data 925 387 94
7
Results
The number of events observed in data and expected from SM processes after the background fit are given in Tables 3 and 4 for the six categories in the signal region of the lepton+jets and fully hadronic channels, respectively. The invariant mass distribution of the reconstructed tt
pair is shown in Fig. 4 (Fig. 5) for data and the expected SM backgrounds in the lepton+jets (fully hadronic) signal-region categories after the background fit. Good agreement between data and background prediction is observed within the estimated systematic uncertainties. The modeling of the data in background-enriched samples is verified using kinematic distributions for leptons, jets, and the reconstructed leptonically and hadronically decaying top quarks in each of the individual categories considered in the analysis. The small differences are covered by the systematic uncertainties. For the lepton+jets channel, some discrepancies are observed
at large Mttin the distributions in categories where the W+jets background dominates. These
discrepancies are related to missing higher-order corrections in the simulated events, and have little impact on the results, as these categories are less sensitive than those dominated by tt. Dedicated cross checks have confirmed that the localized discrepancies visible in Figs. 4 and 5 may be attributed to statistical fluctuations. The sensitivity of this analysis is driven by the 1 t tag categories in the lepton+jets channel, and the 2 b tag categories in the fully hadronic channel, which have the highest signal-to-background ratios.
We proceed to set exclusion limits on different benchmark models for tt resonances. Four
ex-tensions to the SM are considered in the statistical analysis: a Z0 boson decaying exclusively to
tt with a relative decay width (Γ/M) of 1%, 10%, or 30%, and a KK gluon resonance in the RS
model. The cross sections for Z0 production are taken from NLO order calculations [76]. The
leading order (LO) predictions for the KK gluon cross sections are multiplied by a factor of 1.3 to account for higher-order corrections [77].
Limits are extracted on the cross sections for the various signal hypotheses using the distribu-tions in Figs. 4 and 5. By varying the nuisance parameters within their prior distribution func-tions, pseudo-experiments are performed to estimate the 68% and 95% CL (1 and 2 standard deviations) expected limits in the median results. The combined results, including observed limits on the resonant production cross sections, are shown in Fig. 6, and tabulated in Tables 5–9. The combination of the lepton+jets and fully hadronic channels significantly improves the exclusion limits relative to previous results for all models, except for those using a width of 1%. Starting from the lower mass exclusion limit of 0.5 TeV, masses are excluded up to 4 TeV for the
30% width Z0 samples, up to 3.9 TeV for the 10% width Z0, and up to 3.3 TeV for the RS KK
gluon hypotheses, at the 95% CL. These limits are close to the point where the parton luminos-ity at low tt mass dominates the mass distribution by enhancing the off-shell contribution and reducing the resonant contribution, modifying the behavior of the signal model from resonant-like to nonresonant-resonant-like. Because of this, a different analysis strategy should be considered in
future searches, in order to be sensitive to such non-resonant production at large Mtt. Table 5
shows the exclusion limits obtained for the two channels and for their combination. Figure 7
presents the Z0 limits as a function of width instead of mass.
Table 5: Comparison of mass exclusion results (in TeV) for the individual channels and for their combination.
Excluded mass ranges [TeV]
Z0(Γ/M = 1%) Z0(Γ/M = 10%) Z0(Γ/M = 30%) RS KK Gluon
Result Exp. Obs. Exp. Obs. Exp. Obs. Exp. Obs.
Lepton+jets 0.6 – 2.1 0.6 – 2.3 0.5 – 3.5 0.5 – 3.4 0.5 – 4.0 0.5 – 4.0 0.5 – 2.9 0.5 – 2.9 Fully hadronic 1.2 – 1.8 1.4 – 1.8 1.0 – 3.2 1.0 – 3.5 1.0 – 3.7 1.0 – 4.0 1.0 – 2.6 1.0 – 2.4 Combined 0.6 – 2.4 0.6 – 2.5 0.5 – 3.7 0.5 – 3.9 0.5 – 4.0 0.5 – 4.0 0.5 – 3.1 0.5 – 3.3
17 [TeV] Z' M 0.5 1 1.5 2 2.5 3 3.5 4 ) [pb]tt → (Z' Β × Z' σ 4 − 10 3 − 10 2 − 10 1 − 10 1 10 2 10 3 10 4 10 5 10 (13 TeV) -1 2.6 fb CMS Observed Expected 1 s.d. exp. ± 2 s.d. exp. ± Z' 1% width (NLO) [TeV] Z' M 0.5 1 1.5 2 2.5 3 3.5 4 ) [pb]tt → (Z' Β × Z' σ 4 − 10 3 − 10 2 − 10 1 − 10 1 10 2 10 3 10 4 10 5 10 (13 TeV) -1 2.6 fb CMS Observed Expected 1 s.d. exp. ± 2 s.d. exp. ± Z' 10% width (NLO) [TeV] Z' M 0.5 1 1.5 2 2.5 3 3.5 4 ) [pb]tt → (Z' Β × Z' σ 4 − 10 3 − 10 2 − 10 1 − 10 1 10 2 10 3 10 4 10 5 10 (13 TeV) -1 2.6 fb CMS Observed Expected 1 s.d. exp. ± 2 s.d. exp. ± Z' 30% width (NLO) [TeV] KK g M 0.5 1 1.5 2 2.5 3 3.5 4 ) [pb]tt → KK (g Β × KK g σ 4 − 10 3 − 10 2 − 10 1 − 10 1 10 2 10 3 10 4 10 5 10 (13 TeV) -1 2.6 fb CMS Observed Expected 1 s.d. exp. ± 2 s.d. exp. ± 1.3) × RS gluon (LO
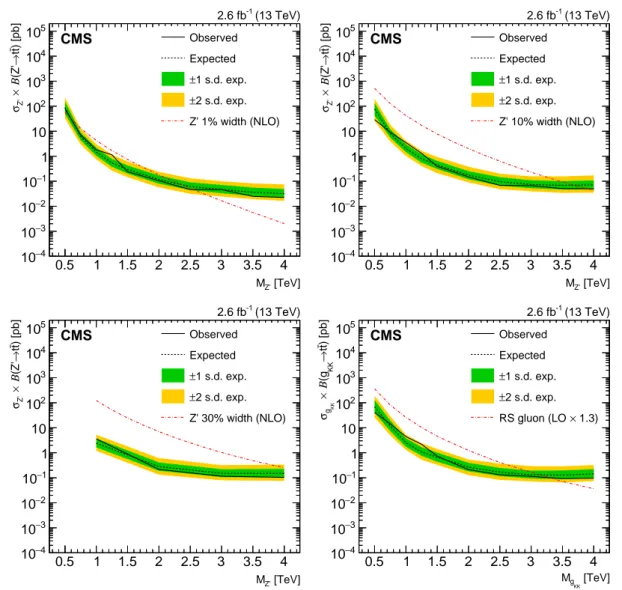
Figure 6: Observed and expected upper limits at 95% CL on the product of the production cross section and branching fractions for the full combination of the analysis results, shown as
function of the resonance mass. Limits are set using four extensions to the SM : (upper left) a Z0
boson withΓ/M of 1%, (upper right) a Z0 boson withΓ/M of 10%, (lower left) a Z0 boson with
Γ/M of 30% and (lower right) a KK excitation of a gluon in the RS model. The corresponding theoretical prediction as a function of the resonance mass is shown as a dot-dashed curve.
8
Summary
A model-independent search for the production of heavy spin-1 or spin-2 resonances decaying into tt final states has been conducted. The data correspond to an integrated luminosity of
2.6 fb−1collected with the CMS detector in proton-proton collisions at√s=13 TeV at the LHC.
The analysis is designed to have high sensitivity at resonance masses above 1 TeV, where final-state decay products become collimated because of the large Lorentz boosts of the top quarks. The analysis method provides an in-situ measurement of the data-to-simulation scale factor for the t tagging efficiency and the normalization of the main backgrounds. No evidence for massive resonances that decay to tt is found. Limits at 95% CL are set on the production cross section of new spin-1 particles decaying to tt with relative decay widths that are either narrow or wide compared with the detector resolution.
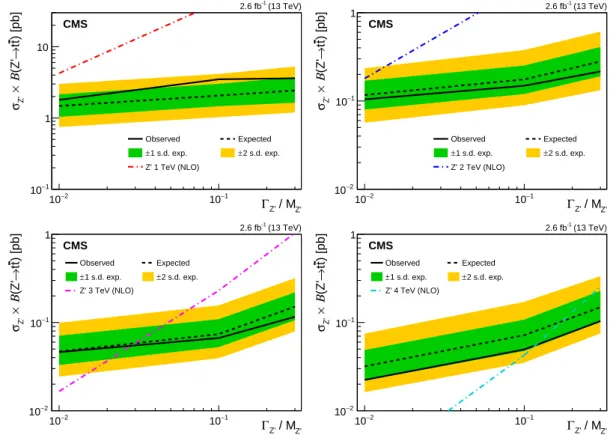
stan-Z' / M Z' Γ 2 − 10 10−1 ) [pb]tt → (Z' Β × Z' σ 1 − 10 1 10 (13 TeV) -1 2.6 fb CMS Observed Expected 1 s.d. exp. ± ±2 s.d. exp. Z' 1 TeV (NLO) Z' / M Z' Γ 2 − 10 10−1 ) [pb]tt → (Z' Β × Z' σ 2 − 10 1 − 10 1 Observed Expected 1 s.d. exp. ± ±2 s.d. exp. Z' 2 TeV (NLO) (13 TeV) -1 2.6 fb CMS Z' / M Z' Γ 2 − 10 10−1 ) [pb]tt → (Z' Β × Z' σ 2 − 10 1 − 10 1 Observed Expected 1 s.d. exp. ± ±2 s.d. exp. Z' 3 TeV (NLO) (13 TeV) -1 2.6 fb CMS Z' / M Z' Γ 2 − 10 10−1 ) [pb]tt → (Z' Β × Z' σ 2 − 10 1 − 10 1 Observed Expected 1 s.d. exp. ± ±2 s.d. exp. Z' 4 TeV (NLO) (13 TeV) -1 2.6 fb CMS
Figure 7: Expected and observed limits presented as a function of width, for MZ0 = 1, 2, 3,
4 TeV. The corresponding theoretical prediction as a function of width is shown as a dot-dashed curve in each case.
dard model. Topcolor Z0 bosons with relative widthsΓ/M of 1%, 10%, and 30% are excluded
for mass ranges of 0.6–2.5, 0.5–3.9, and 0.5–4.0 TeV, respectively. Kaluza–Klein excitations of a gluon with masses in the range 0.5–3.3 TeV in the Randall–Sundrum model are also excluded.
This search presents limits on Z0 bosons as a function of the relative width of the resonance in
the range from 1–30%, for the first time in CMS.
This analysis yields approximately the same sensitivity as the previous search based on 8 TeV
data [27] (corresponding to an integrated luminosity of 19.7 fb−1) for resonance masses in the
range 1.0–2.0 TeV. At higher resonance masses, the present analysis is significantly more
sensi-tive. Previous lower mass limits on the Z0with 10% relative width and the Kaluza–Klein gluon
were 2.9 and 2.8 TeV, respectively. The present analysis extends the lower mass limits to 3.9 and 3.3 TeV, respectively, for these models.
19
Table 6: Expected and observed cross section limits at 95% CL, for the 1% width Z0 resonance
hypothesis.
Mass [TeV] Observed limits [pb] Expected limits [pb]
−2σ −1σ Median +1σ +2σ 0.5 78 32 50 88 150 230 0.75 7.1 2.9 4.3 6.1 8.8 13 1.0 1.8 0.75 1.0 1.5 2.2 3.0 1.25 1.1 0.26 0.38 0.53 0.78 1.2 1.5 0.24 0.15 0.20 0.29 0.43 0.62 2.0 0.10 0.057 0.080 0.12 0.17 0.24 2.5 0.046 0.031 0.044 0.061 0.090 0.13 3.0 0.046 0.024 0.033 0.047 0.071 0.099 3.5 0.025 0.019 0.026 0.036 0.055 0.081 4.0 0.022 0.016 0.022 0.032 0.049 0.075
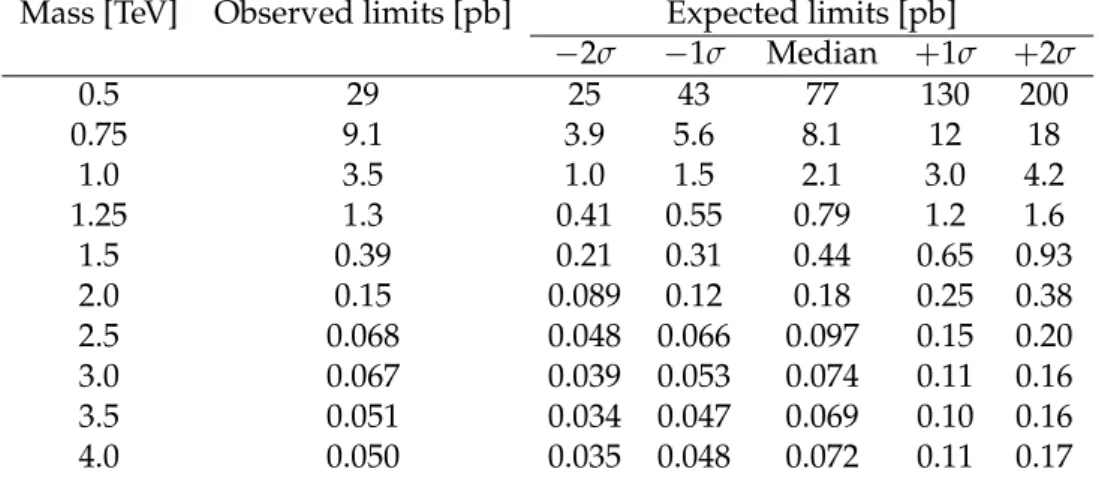
Table 7: Expected and observed cross section limits at 95% CL, for the 10% width Z0resonance
hypothesis.
Mass [TeV] Observed limits [pb] Expected limits [pb]
−2σ −1σ Median +1σ +2σ 0.5 29 25 43 77 130 200 0.75 9.1 3.9 5.6 8.1 12 18 1.0 3.5 1.0 1.5 2.1 3.0 4.2 1.25 1.3 0.41 0.55 0.79 1.2 1.6 1.5 0.39 0.21 0.31 0.44 0.65 0.93 2.0 0.15 0.089 0.12 0.18 0.25 0.38 2.5 0.068 0.048 0.066 0.097 0.15 0.20 3.0 0.067 0.039 0.053 0.074 0.11 0.16 3.5 0.051 0.034 0.047 0.069 0.10 0.16 4.0 0.050 0.035 0.048 0.072 0.11 0.17
Table 8: Expected and observed cross section limits at 95% CL, for the 30% width Z0resonance
hypothesis.
Mass [TeV] Observed limits [pb] Expected limits [pb]
−2σ −1σ Median +1σ +2σ
1.0 3.6 1.2 1.6 2.4 3.7 5.3
2.0 0.22 0.13 0.19 0.28 0.41 0.61
3.0 0.12 0.080 0.11 0.15 0.22 0.32
Table 9: Expected and observed cross section limits at 95% CL, for the RS KK gluon hypothesis.
Mass [TeV] Observed limits [pb] Expected limits [pb]
−2σ −1σ Median +1σ +2σ 0.5 41 26 40 69 130 190 0.75 14 5.0 7.3 12 19 29 1.0 4.4 1.3 1.7 2.5 3.8 5.3 1.25 2.2 0.53 0.76 1.1 1.7 2.4 1.5 0.73 0.33 0.44 0.67 1.0 1.4 2.0 0.21 0.13 0.18 0.27 0.40 0.54 2.5 0.13 0.082 0.12 0.17 0.25 0.37 3.0 0.11 0.071 0.094 0.13 0.19 0.29 3.5 0.093 0.065 0.088 0.13 0.20 0.29 4.0 0.096 0.073 0.099 0.14 0.22 0.32
21
Acknowledgments
We congratulate our colleagues in the CERN accelerator departments for the excellent perfor-mance of the LHC and thank the technical and administrative staffs at CERN and at other CMS institutes for their contributions to the success of the CMS effort. In addition, we grate-fully acknowledge the computing centers and personnel of the Worldwide LHC Computing Grid for delivering so effectively the computing infrastructure essential to our analyses. Fi-nally, we acknowledge the enduring support for the construction and operation of the LHC and the CMS detector provided by the following funding agencies: the Austrian Federal Min-istry of Science, Research and Economy and the Austrian Science Fund; the Belgian Fonds de la Recherche Scientifique, and Fonds voor Wetenschappelijk Onderzoek; the Brazilian Fund-ing Agencies (CNPq, CAPES, FAPERJ, and FAPESP); the Bulgarian Ministry of Education and Science; CERN; the Chinese Academy of Sciences, Ministry of Science and Technology, and Na-tional Natural Science Foundation of China; the Colombian Funding Agency (COLCIENCIAS); the Croatian Ministry of Science, Education and Sport, and the Croatian Science Foundation; the Research Promotion Foundation, Cyprus; the Secretariat for Higher Education, Science, Technology and Innovation, Ecuador; the Ministry of Education and Research, Estonian Re-search Council via IUT23-4 and IUT23-6 and European Regional Development Fund, Estonia; the Academy of Finland, Finnish Ministry of Education and Culture, and Helsinki Institute of Physics; the Institut National de Physique Nucl´eaire et de Physique des Particules / CNRS, and Commissariat `a l’ ´Energie Atomique et aux ´Energies Alternatives / CEA, France; the Bundes-ministerium f ¨ur Bildung und Forschung, Deutsche Forschungsgemeinschaft, and Helmholtz-Gemeinschaft Deutscher Forschungszentren, Germany; the General Secretariat for Research and Technology, Greece; the National Scientific Research Foundation, and National Innova-tion Office, Hungary; the Department of Atomic Energy and the Department of Science and Technology, India; the Institute for Studies in Theoretical Physics and Mathematics, Iran; the Science Foundation, Ireland; the Istituto Nazionale di Fisica Nucleare, Italy; the Ministry of Science, ICT and Future Planning, and National Research Foundation (NRF), Republic of Ko-rea; the Lithuanian Academy of Sciences; the Ministry of Education, and University of Malaya (Malaysia); the Mexican Funding Agencies (BUAP, CINVESTAV, CONACYT, LNS, SEP, and UASLP-FAI); the Ministry of Business, Innovation and Employment, New Zealand; the Pak-istan Atomic Energy Commission; the Ministry of Science and Higher Education and the Na-tional Science Centre, Poland; the Fundac¸˜ao para a Ciˆencia e a Tecnologia, Portugal; JINR, Dubna; the Ministry of Education and Science of the Russian Federation, the Federal Agency of Atomic Energy of the Russian Federation, Russian Academy of Sciences, and the Russian Foundation for Basic Research; the Ministry of Education, Science and Technological Devel-opment of Serbia; the Secretar´ıa de Estado de Investigaci ´on, Desarrollo e Innovaci ´on and Pro-grama Consolider-Ingenio 2010, Spain; the Swiss Funding Agencies (ETH Board, ETH Zurich, PSI, SNF, UniZH, Canton Zurich, and SER); the Ministry of Science and Technology, Taipei; the Thailand Center of Excellence in Physics, the Institute for the Promotion of Teaching Science and Technology of Thailand, Special Task Force for Activating Research and the National Sci-ence and Technology Development Agency of Thailand; the Scientific and Technical Research Council of Turkey, and Turkish Atomic Energy Authority; the National Academy of Sciences of Ukraine, and State Fund for Fundamental Researches, Ukraine; the Science and Technology Facilities Council, UK; the US Department of Energy, and the US National Science Foundation. Individuals have received support from the Marie-Curie programme and the European Re-search Council and EPLANET (European Union); the Leventis Foundation; the A. P. Sloan Foundation; the Alexander von Humboldt Foundation; the Belgian Federal Science Policy Of-fice; the Fonds pour la Formation `a la Recherche dans l’Industrie et dans l’Agriculture
(FRIA-Belgium); the Agentschap voor Innovatie door Wetenschap en Technologie (IWT-(FRIA-Belgium); the Ministry of Education, Youth and Sports (MEYS) of the Czech Republic; the Council of Sci-ence and Industrial Research, India; the HOMING PLUS programme of the Foundation for Polish Science, cofinanced from European Union, Regional Development Fund, the Mobil-ity Plus programme of the Ministry of Science and Higher Education, the National Science Center (Poland), contracts Harmonia 2014/14/M/ST2/00428, Opus 2013/11/B/ST2/04202, 2014/13/B/ST2/02543 and 2014/15/B/ST2/03998, Sonata-bis 2012/07/E/ST2/01406; the Thalis and Aristeia programmes cofinanced by EU-ESF and the Greek NSRF; the National Priorities Research Program by Qatar National Research Fund; the Programa Clar´ın-COFUND del Princi-pado de Asturias; the Rachadapisek Sompot Fund for Postdoctoral Fellowship, Chulalongkorn University and the Chulalongkorn Academic into Its 2nd Century Project Advancement Project (Thailand); and the Welch Foundation, contract C-1845.
References
[1] J. L. Rosner, “Prominent decay modes of a leptophobic Z0”, Phys. Lett. B 387 (1996) 113,
doi:10.1016/0370-2693(96)01022-2, arXiv:hep-ph/9607207.
[2] K. R. Lynch, S. Mrenna, M. Narain, and E. H. Simmons, “Finding Z0bosons coupled
preferentially to the third family at CERN LEP and the Fermilab Tevatron”, Phys. Rev. D
63(2001) 035006, doi:10.1103/PhysRevD.63.035006, arXiv:hep-ph/0007286.
[3] M. Carena, A. Daleo, B. A. Dobrescu, and T. M. P. Tait, “Z0gauge bosons at the Fermilab
Tevatron”, Phys. Rev. D 70 (2004) 093009, doi:10.1103/PhysRevD.70.093009,
arXiv:hep-ph/0408098.
[4] C. T. Hill, “Topcolor top quark condensation in a gauge extension of the standard model”, Phys. Lett. B 266 (1991) 419, doi:10.1016/0370-2693(91)91061-Y.
[5] R. M. Harris and S. Jain, “Cross sections for leptophobic topcolor Z0 decaying to
top-antitop”, Eur. Phys. J. C 72 (2012) 2072,
doi:10.1140/epjc/s10052-012-2072-4, arXiv:1112.4928.
[6] C. T. Hill and S. J. Parke, “Top production: Sensitivity to new physics”, Phys. Rev. D 49 (1994) 4454, doi:10.1103/PhysRevD.49.4454, arXiv:hep-ph/9312324.
[7] C. T. Hill, “Topcolor assisted technicolor”, Phys. Lett. B 345 (1995) 483,
doi:10.1016/0370-2693(94)01660-5, arXiv:hep-ph/9411426.
[8] P. H. Frampton and S. L. Glashow, “Chiral color: An alternative to the standard model”, Phys. Lett. B 190 (1987) 157, doi:10.1016/0370-2693(87)90859-8.
[9] D. Choudhury, R. M. Godbole, R. K. Singh, and K. Wagh, “Top production at the Tevatron/LHC and nonstandard, strongly interacting spin one particles”, Phys. Lett. B
657(2007) 69, doi:10.1016/j.physletb.2007.09.057, arXiv:0705.1499.
[10] R. M. Godbole and D. Choudhury, “Nonstandard, strongly interacting spin one t¯t resonances”, in Proceedings, 34th International Conference on High Energy Physics (ICHEP 2008): Philadelphia, Pennsylvania, July 30-August 5, 2008. 2008. arXiv:0810.3635. [11] D. Dicus, A. Stange, and S. Willenbrock, “Higgs decay to top quarks at hadron colliders”,
Phys. Lett. B 333 (1994) 126, doi:10.1016/0370-2693(94)91017-0,
References 23
[12] K. Agashe et al., “CERN LHC signals from warped extra dimensions”, Phys. Rev. D 77 (2008) 015003, doi:10.1103/PhysRevD.77.015003, arXiv:hep-ph/0612015. [13] K. Agashe et al., “CERN LHC signals for warped electroweak neutral gauge bosons”,
Phys. Rev. D 76 (2007) 115015, doi:10.1103/PhysRevD.76.115015,
arXiv:0709.0007.
[14] H. Davoudiasl, J. L. Hewett, and T. G. Rizzo, “Phenomenology of the Randall-Sundrum Gauge Hierarchy Model”, Phys. Rev. Lett. 84 (2000) 2080,
doi:10.1103/PhysRevLett.84.2080, arXiv:hep-ph/9909255.
[15] L. Randall and R. Sundrum, “Large Mass Hierarchy from a Small Extra Dimension”, Phys. Rev. Lett. 83 (1999) 3370, doi:10.1103/PhysRevLett.83.3370,
arXiv:hep-ph/9905221.
[16] L. Randall and R. Sundrum, “An Alternative to Compactification”, Phys. Rev. Lett. 83 (1999) 4690, doi:10.1103/PhysRevLett.83.4690, arXiv:hep-th/9906064.
[17] CDF Collaboration, “A search for resonant production of t¯t pairs in 4.8 fb−1of integrated
luminosity of p ¯p collisions at√s=1.96 TeV”, Phys. Rev. D 84 (2011) 072004,
doi:10.1103/PhysRevD.84.072004, arXiv:1107.5063.
[18] D0 Collaboration, “Search for a narrow t¯t resonance in p ¯p collisions at√s=1.96 TeV”,
Phys. Rev. D 85 (2012) 051101, doi:10.1103/PhysRevD.85.051101,
arXiv:1111.1271.
[19] CMS Collaboration, “Search for anomalous tt production in the highly-boosted all-hadronic final state”, JHEP 09 (2012) 029, doi:10.1007/JHEP09(2012)029,
arXiv:1204.2488.
[20] ATLAS Collaboration, “Search for resonances decaying into top-quark pairs using fully
hadronic decays in pp collisions with ATLAS at√s=7 TeV”, JHEP 01 (2013) 116,
doi:10.1007/JHEP01(2013)116, arXiv:1211.2202.
[21] ATLAS Collaboration, “A search for t¯t resonances in the lepton plus jets final state with
ATLAS using 4.7 fb−1of pp collisions at√s=7 TeV”, Phys. Rev. D 88 (2013) 012004,
doi:10.1103/PhysRevD.88.012004, arXiv:1305.2756.
[22] ATLAS Collaboration, “A search for t¯t resonances in lepton+jets events with highly
boosted top quarks collected in pp collisions at√s =7 TeV with the ATLAS detector”,
JHEP 09 (2012) 041, doi:10.1007/JHEP09(2012)041, arXiv:1207.2409. [23] CMS Collaboration, “Search for resonant tt production in lepton+jets events in pp
collisions at√s=7 TeV”, JHEP 12 (2012) 015, doi:10.1007/JHEP12(2012)015,
arXiv:1209.4397.
[24] CMS Collaboration, “Search for Z0 resonances decaying to t¯t in dilepton+jets final states
in pp collisions at√s=7 TeV”, Phys. Rev. D 87 (2013) 072002,
doi:10.1103/PhysRevD.87.072002, arXiv:1211.3338.
[25] CMS Collaboration, “Searches for new physics using the t¯t invariant mass distribution in
pp collisions at√s=8 TeV”, Phys. Rev. Lett. 111 (2013) 211804,