Determination of Spatial Weed Variability for Precision Spraying
Ufuk TÜRKER1
Geliş Tarihi: 24.11.2005
Abstract: Weeds are patchy because weed spread, survival and reproduction are variable within a field and over time. Weed patches stay in about the same place from year to year, even though weed density within a patch may vary. Weeds, and methods used to control weeds, can have negative economic and environmental impacts. With precision agriculture, growers can take advantage of the patchy nature of weeds by targeting management efforts only where they are needed instead of wasting expensive and potentially hazardous inputs where weeds are not present. The availability of geographic information systems (GIS) and global positioning systems (GPS) allows to generate site-specific application maps in order to apply herbicides only in those portions of a field in which weeds are present. In this study, weeds in winter wheat were sampled in 2001 and 2002 in two fields of 6.7 ha inSarayköy research station) and 6.4 ha in Atatürk Orman Çiftliği (AOÇ) respectively. The most frequent weed species were taken into account in weed sampling. Weed infestation was determined by a combination of visual assessment within a 5 metre radius and actual weed counts within a 1 m2 quadrant of the grid sample point. Additional sampling was undertaken if the 1 m2 quadrant
appeared unrepresentative. Weed density and spraying maps were generated using Arcgis 3.2a GIS software package. The results demonstrate that mapping weeds for precision spraying to control weeds can theoretically reduce herbicide applications. Compared to traditional application, the amount of herbicides in a small grain cereal would be reduced by % 25 in Sarayköy and 55 % in AOÇ field respectively.
Key Words: Weed, weed variability, weed mapping, variable rate herbicide application,
Hassas İlaçlama için Alansal Yabancı Ot Dağılımının Belirlenmesi
Öz: Yabancı otlar, hayatta kalmaları ve yeniden üremeleri ve tekrar arazi üzerindeki dağılımları değişken olduğu için arazi üzerinde tekrar tekrar kümeler halinde ortaya çıkabilmektedirler. Bu dağınık yabancı ot kümelerinin yabancı ot yoğunluğu değişse bile kümeleştiği yerler yıldan yıla aynı kalabilmektedir. Yabancı otları kontrol etmek üzere kullanılan metodların gerek ekonomik ve gerekse çevresel olumsuz etkileri olabilmektedir. Hassas tarım ile yetiştiriciler pahalı girdilerden olan ilacın yabancı otların kümeleştiği yerleri hedef alarak ihtiyaç duyulan yerleri ilaçlamak ve yabancı otun olmadığı yere atılmaması ile çevreye olan etkileri en aza indirgenebilir. Coğrafi bilgi sistemleri (CBS) ile küresel konulmalama sistemleri (KKS), yabancı otların arazi üzerindeki dağılımlarını ve bu dağılımların haritalanmasını sağlamaktadırlar. Bu yolla hazırlanan dağılım haritalarından, alana özgü ilaç uygulama haritalarının geliştirmesi mümkün olmaktadır. Bu çalışmada, 6.4 ha (AOÇ) ve 6.7 ha’lık (Sarayköy araştırma istasyonu) iki kışlık buğday ekili arazide yabancı ot örneklemesi yapılmıştır. Örneklemede en sık görülen yabancı otlar dikkate alınmıştır. Arazi uzerinde yabancı otların bulunduğu yerler 5 metre’lik alan içersine alınarak gözlem yapılmış ve bu alanlarda 1m2’lik örneklemeler
yapılmıştır. 1m2’lik örneklemenin yeterli olmadığı yerlerde ilave örneklemeler yapılmıştır. Yabancı ot dağılım yoğunluğu
ve bu dağılıma yönelik yabancı ot ilaçlama haritaları Arcgis 3.2a CBS yazılımı kullanılarak hazırlanmıştır. Elde edilen sonuçlar, hassas ilaçlama için yabancı otların haritalanması ile teorik olarak uygulanacak ilaç miktarını azaltılmaktadır. Geleneksel tek düze uygulamalar ile kıyaslandığında ilaç miktarının çalışılan arazilerde Sarayköy için % 25, AOÇ için ise %55 azaltılabileceği görülmüştür.
Anahtar Kelimeler: Yabancı ot, yabancı ot değişkenliği, yabancı ot haritalaması, değişken oranlı yabancı ot ilaçlaması
Introduction
Site-specific spraying present an interesting potential for the reduction of chemical inputs used in agriculture. The prospect of increased profit and reduced environmental impact has sparked interest in precision farming techniques. Farmers have known for years that a range of weeds occur in patches. Recent studies, driven by the idea of precision farming and spatially variable herbicide application have provided quantitative data concerning the degree of patchiness of a number of specific weeds (Cardina et al. 1995; Gerhards et al. 1997). Surveys have demonstrated that weed patches can cover from 80% to as little as a few percent of arable fields (Brown et al. 1990, Wilson and Brain, 1990; Thompson et al. 1991; Johnson et al. 1995; Rew et al. 1996).
Di tomaso (1995) found that weeds tended to be more competitive with crops at higher nutrient levels. Strategies for site specific weed application is one of the primary focus of research in the precision farming area, include varying the rate of herbicides in low and high patchy areas at the field.
Advances in technologies such as global positioning systems (GPS), remote sensing (RS) and computer integrated farm equipment (VRT) offer the potential for site specific and locally varying weed management. The availability of Geographic information systems (GIS) allows to generate variable herbicide application maps in order to apply herbicides only in those portions of the field in which weeds are present. Obtaining variable weed
maps with location and density of weeds within single past and current weed management strategies and enabling to ascertain the chemical requirements of patch spraying. Weed maps are also the source of data for patch sprayers navigating by GPS (Stafford and Miller 1996; Rew et al.1997; Goudy et al. 1999).
Furthermore locally varying rates reduce environmental loading of herbicides by up to 40% when it is compared to the conventional approach (Faechner and Deutsch 2002). Locally varying herbicide rates could be integrated into weed control management programs. As of yet, there has been very little research done examining the potential of site specific application. Another important issue relating to site specific applications that has not been adequately investigated is the effect of targeting weed patches for herbicide applications on patch stability. If patches remained relatively stable in a field from year to year then farmers could use the same weed maps for several years without having to have their fields re-mapped yearly.
Field scale weed maps can be constructed from on-ground survey techniques, including GPS-assisted field scouting (Stafford et al. 1996), intensive grid sampling (Goudy et al.1999), vehicle-based monitoring (Rew et al. 1996) harvest-based monitoring (Colliver et al.1996). Such approach involves mapping the distribution of weed populations and preparing treatment map to enable to apply herbicides selectively to locations with moderate or high weed infestation levels (Mortensen et al.1995)
The objective of this research is to determine the level of weed distribution variability for two arable winter wheat field and map locally-variable weed species and also produce variable rate herbicide application maps.
Materials and Methods
A commercial field site in a wheat-fallow rotation in
AOÇ (Atatürk Orman Çiftliği) ( 32.500 N, 40.500 ) and a
research station in Sarayköy (32.610 N, 40.080 E) in a
wheat-fallow rotation were chosen for the study. In the spring of 2001 and 2002 Sarayköy and AOÇ field was flagged respectively on a 30*30 grid. Flags were georeferenced using a GPS.
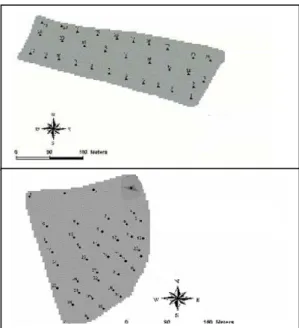
The most frequent weed species were taken into account in weed sampling from the sampling points that was flagged on a 30*30m grid (Fig 1 (a) and (b)) in which 31 sampling points for Sarayköy field and 40 sampling points for AOÇ were obtained. Weed infestation was determined by a combination of visual assessment within
a 5 metre radius and actual weed counts within a 1 m2
quadrant of the grid sample point.
Additional sampling was undertaken if the 1 m2
quadrant appeared unrepresentative. Low weed
infestation corresponded to less than 10 weed plants/m2,
medium weed infestation to 10-40 weed plants/m2, and
high weed infestation to more than 41 weed plants/m2.
(a)
Figure 1 (a) and (b). Weed sampling points at Sarayköy (a) field (▲) in 2001 and AOÇ (b) field (●) in 2002 respectively.
Weed data were interpolated with punctual kriging interpolation method using ArcView 3.0a software (ESRI geographical information system (GIS)) to generate interpolated surface maps based on point data.
Coefficient of variability were calculated for both field to understand how weed distributed at the field. In many studies, variance and standard deviation are often found to be proportional to the mean. It is therefore common practice to compare variability between sample populations using more stable coefficient of variation (C.V.). To determine the weed variability, the equation indicated below was used;
C.V. =
Z ′
σ
. 100 (1) Where; C.V.= Coefficient of variability;σ = The standard deviation of the sample population;
Z ′
= The central tendency and distribution of asample population.
High C.V. values shows high variability than low C.V. values. C.V values bigger than 35 shows high variability (Wilding,1985). Mean values of weed and standard deviations of weed were also calculated using SPSS statistical software package program.
To describe the heterogeneity of the fields for total weed, Lloyd’s patchiness Index (PI) (Lloyd,1967) was calculated. Also Lloyd’s PI for weed species as a function of mean weed densities was given for AOÇ as an example. The equation for PI was given below;
PI =
ratio
mean
iance
−
var
(2) (b)
The 2001 weed density map is presented in Figure 2 for Sarayköy field. Recorded weed species indicated high spatial variability in the field. Some similarities can be found between the patterns of the low yield zones of the 2001 yield and the high weed infested areas (Fig 2 and Fig 3).
A weed treatment map was created for the precision spraying for each field.
Results and Discussions
The weed distribution on fields was not homogenous. Very high weed variability was found for Sarayköy field with 83.94 C.V. and a medium variability for AOÇ field. with 24.2 C.V. (Table 1).
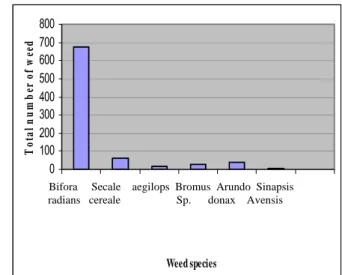
Bifora Radiants spp was the most frequent species
recorded on the Sarayköy field. The occurrence of Secale Cereale and Arunda Donax together with the less frequent
Bromus spp were also recorded as weed species on this
field. The frequency of the most frequent weed species for Sarayköy field in 2001 are presented in Figure 4. Spatial weed density map was prepared and presented from the total number of these weed species for ease of precision spraying for Sarayköy field (Fig. 2).
Table 1. Weed variability of Sarayköy and AOÇ. Variable Mean C.V. Std. Dev. Variability degree Weed (Sarayköy) 29.71 83.94 15.24 High Weed (AOÇ) 69.23 24.2 16.05 Moderate
Figure 2. Distribution map of weed infestation for Sarayköy field in 2001.
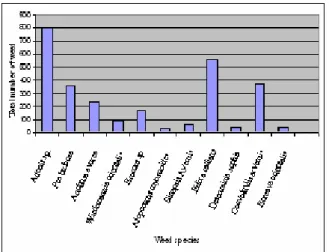
Adonis spp. and Bifora radians spp. were the most
frequent species recorded on the AOÇ field. Poa bulbosa, Anchusa avurea, Convoluvlis arvensis and Boreava orientalis were the less frequent weed species recorded on the AOÇ field. The frequency of the weed species for AOÇ field in 2002 are presented in Figure 5. Also Spatial weed density map was prepared and presented from the total number of these weed species for precision spraying for AOÇ field (Fig. 3).
Mean weed density was found to be 69.23 weed m-1
for AOÇ. Mean weed density was calculated as 29.71
weed m-2 for Sarayköy field which was less infestated
comparing with AOÇ (Table 1). The weed distribution calculated by kriging interpolation shows clumped weed distributions by whole field weed infestation. Spatial distribution maps of weed infestation for Sarayköy and AOÇ field were given in figure 2 and figure 3 respectively. On the Sarayköy field, a clear trend of increasing weed infestation from west to east can be seen (Fig.2). 6 weed species was recorded in Sarayköy field. Bifora Radiants
spp. gave the highest frequency and as dominant weed on
the Sarayköy field that covered %81 of the whole field.
Low yielding zones
Weeds m-2
Figure 3. Distribution map of weed infestation for AOÇ field in 2002. 0 100 200 300 400 500 600 700 800 Bifo ra ra dians Secale cereal e aegil ops Bromus sp Arun do do nax Sina psis Ave nsis Weed species T o ta l n u m b er o f w eed
Low yielding zones
Weeds m-2
Bifora Secale aegilops Bromus Arundo Sinapsis radians cereale Sp. donax Avensis
Figure 4. The frequency of the weed species recorded on Sarayköy field in 2001.
Figure 5. The frequency of the weed species recorded on AOÇ field in 2002.
Similar increasing trend of weed infestation was observed from south to north for AOÇ field. 11 weed species were recorded in AOÇ field (Fig.3). Adonis spp. and Bifora radians spp. were the most frequent species that covered approximately %50 of whole field.
Lloyd’s PI was found to be higher than one for Sarayköy and AOÇ field with 7.51 and 3.72 respectively. This reveals that weed distribution for both field was an inhomogeneous aggregated distribution. Comparison of PI values for both field shows that weed was more unevenly distributed in Sarayköy field than AOÇ field. C.V values also verify more unevenly distribution for Sarayköy field.
Based on the indices of aggregation, the spatial patterns of single species can be generally described as aggregated. Figure 6 illustrates Lloyd’s PI as a function of mean weed densities for AOÇ field. The figure shows that patchiness is connected with low densities and vice versa.
Site specific variable rate application maps according to weed incidence and crop density were prepared for Sarayköy field and AOÇ field (Fig.7 and 8). Application maps are based on total herbicide application. This requires even If there is one weed presence, application will be made for Sarayköy field. When the weed number exceeds 10, application will be made since the distributions are less patchiness for AOÇ field.
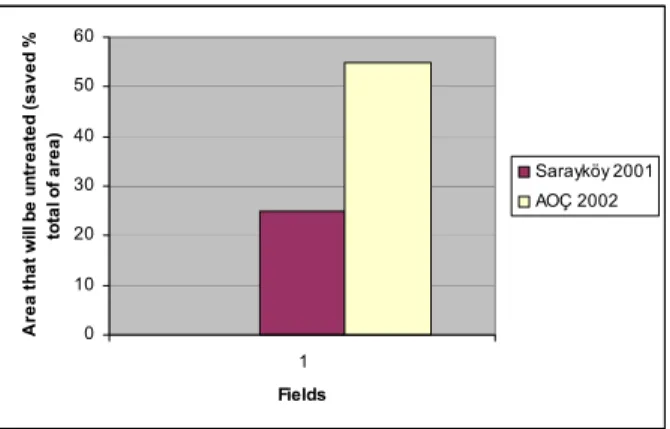
It can be seen from figure 9 that approximately %25 of spraying application can be saved for Sarayköy field. For AOÇ field only % 45 of total herbicide application can be made that brings approximately % 55 savings from variable herbicide application.
Possible precision spraying equipment for variable rate herbicide application is given in Figure 10.
0 1 2 3 4 5 6 0 5 10 15 20 25
Mean density (weeds m)
Ll oy d' s pa tc hi ne s s in de x -2
Figure 6. Lloyd’s PI of weed species as a function of weed density for AOÇ field.
Application 0-1 1-15
Figure 7. Variable rate treatment map for total herbicide application in Sarayköy field (2001).
Figure 6. Variable rate treatment map for total herbicide application in Sarayköy field (2001).
Application 10-88 0-10
Figure 8. Variable rate treatment map for total herbicide application in AOÇ field (2002).
0 10 20 30 40 50 60 1 Fields A re a t h a t w ill be u n tr e a te d ( s aved % to ta l o f area) Sarayköy 2001 AOÇ 2002
Figure 9. Area that will be covered with variable rate herbicide application for Sarayköy and AOÇ field.
Figure 10. Precision spraying equipment for variable rate herbicide application (Gerhards et al, 1999).
Conclusions
The utilisation of spatially selective herbicide application techniques depends on the fact that weeds are aggregated in distribution. The results presented on the spatial distribution of weed populations indicate that aggregated and relatively small high continuity of distribution pattern with a inhomogeneity occurrence of weeds varied between C.V. % 83 and C.V. % 24 in Sarayköy and AOÇ field respectively. The moderate Variation of spatial distribution of total weed infestations for AOÇ and a high variation of spatial distribution of total weed infestations for Sarayköy field that are promising for site specific weed management.
Site specific weed control is an environmentally sound and cost saving alternative to whole field treatment. Herbicides use could be reduced in winter wheat for both field when the sprayer is directed to patches with high weed infestation levels. Thus one can conclude that weeds can be spatially aggregated, providing a target for spatially selective weed control.
In all, the findings could contribute to an improvement of weed monitoring and therefore facilitate the integration of patchy weed control in the concept of precision agriculture.
References
Brown, R. B., G. W. Anderson, B. Proud and J. G. A. Steckler. 1990. Herbicide application control using GIS weed maps. ASAE paper no.90-1061,15pp.
Cardina, J., D. H. Sparrow and E. I. McCoy. 1995. Analysis of spatial distribution of common l ambsquarters in no-till soybean. Weed science.43, 258-268.
Colliver, C. T., B. D. Maxwell, D. A. Tyler, D. W. Roberts and D. S. Long. 1996. Georeferencing wild oat infestations in small grains. Proceedings of the third international conference on Precision agriculture, pp 453-463. Minneapolis,USA. Di Tomaso, J. M, 1995. Approaches for improving crop
competitiviness through the manipulation of fertilization strategies. Weed Science 43:491-497.
Faechner, T and C. V. Deutsch. 2002. Spatial Modeling of weeds for optimal treatment. Proceedings of the 2002 National Meeting, Canadian weed science society. pp. 58-61. Gerhards, R, M. Sökefeld, K. Schulze, D. A. Mortensen and W.
Kühbauch. 1997. Site specific weed control in winter wheat. Journal of Agronomy and CropScience,178,219-225. Gerhards, R., M. M. Sökefeld, K. Schulze, Mortensen and W.
Kühbauch. 1999. Results of a four-year study on site specific herbicide application. Proceedings 2nd European
Conference on Precision Agriculture, Odense, Denmark, 689-697.
Goudy, H. J., K. A. Bennett, R. B. Brown and F. J. Tardif. 1999. Evaluation of site specific weed control in a corn soybean rotational system. Proceedings of the 1999 National Meeting, Canadian weed science society. Pp. 49-54. Johnson, G. A., D. A. Mortensen, A. R. Martin. 1995. A simulation
of herbicide use based on weed spatial distribution. Weed research, 35,197-205.
Lloyd, M. 1967. Mean crowding, Journal of Animal Ecology,36,1-30.
Mortensen, D. A., G. A. Johnson, D. Y. Wyse and A. R. Martin. 1995. Managing spatially variable weed populations. Proceedings ASA-CSSA-SSSA- Soil Specific Management for Agricultural Systems, Minneapolis,MI, USA, 397-415. Rew, L. J., G. W. Cussans, M. A. Mugglestone and P. C. H.
Miller. 1996. A technique for mapping the spatial distribution of Elymus repens, with estimates of the potential reduction in herbicide usage from patch spraying. Weed research, 36, 283-292.
Rew, L. J., P. C. H. Miller and M. E. R. Paice. 1997. The importance of patch mapping resolution for sprayer control. Aspects of Applied Biology, 48, 49-55.
Stafford, J. V., L. Bars and B. Ambler. 1996. A hand-held data logger with integral GPS for producing weed maps by field walking, Computers and Electronics in Agriculture,14,235-247.
Thompson, J. F., J. V. Stafford and B. Ambler. 1991. Weed detection in cereal crops. American Society of Agricultural Engineers, paper 907516.
Statford J. V. and P. C. H. Miller. 1996. Spatially selective application of herbicide to cereal crops. Computers and Electronics, 9, pp 217-229 Elsevier Science publisher. Wilson, B. J and Brain. 1990. Weed monitoring on a whole farm,
patchiness and stability of distribution of Alopecurus myosuroides over ten year period. Proceedings EWRS Symposium Integrated with management in cereals, Helsinki, Finland, pp 45-52.
Wilding, L. P. 1985. Spatial variability: accommodation and implications to soil surveys, p.166- 189. Wageningen, Netherlands.
Acknowledgements
The assistance of the plant protection and control of the ministry of Agriculture is gratefully acknowledged.
İletişim adresi: Ufuk TÜRKER
Ankara Üniv.Ziraat Fakültesi, Tarım Makinaları Bölümü-Ankara. Tel: 0 312 5961610