THE FINANCIAL ANALYSIS OF
POSTMERGER PERFORMANCE OF
SURVIVING FIRMS
A lövsat Müslümov*
ABSTRACT
This paper exam ines the synergy created in the m erger process, its sources a n d fa c to rs that influence its m agnitude using a sam ple o f 56 m ergers fr o m U.S. industries co m pleted within 1992-1997. Researchfindings indicate that mergers are resulting in the synergy gains, which is measured by operating c a s h flo w s relative to the industries. The c a s h flo w increases do not come from gaining monopoly position a n d cutting capital investments a n d labor cost. T he cash flow improvements com e fr o m the m ore productive usage o f assets in generating sales. The subsample studies show that cash flo w improvements are particularly strong in high overlap, equity-financed, value and larger m erger subsamples.
İn Finance, A ssistant Professor, F a culty o f E c o n o m ic s a n d A d m in is tra tiv e S cience s, D o ğ u ş U n iv e rs ity , Istan bu l. T u rkey . The pa- p r is ba&d on one o f the parts o f m y P h .D . d issertation, e n title d “ ^ i e F in a n c ia l A n a ly s is o f M e rg e rs " ( B o ğ a z iç i U n iv e rs ity , F e b m ary 2TOI}. 1 w ou ld like to tha nk to Prof. D r. Ö z e r E rtu n a, P ro f.D r. C u d i T u n cer G u rso y a n d an a n o n y m o u s referee for th e ir m a n y in s ig h tfu l comments and helpful suggestions. The fin a n c ia l su ppo rt o f S e lç u k A ltu n İn pu rch asin g the C o m p u s ta t D atabase a n d A li P o lat İn p u r c h a sing of Mergerstat D atabase are g rate fully ack n o w le d g e d .
Y A P I K R E D İ E C O N O M I C R E V I E W . V O L U M E 1 3 . N U M B E R I . J U N E 2 0 0 2
1. I N T R O D U C T I O N
Financial literature suggests that m erger decision m ay be the result o f one or m ore of the following m otives: synergy, agency, and hubris. The synergy m otive im plies that mer ging fim is expect synergetic gains that result by m erging the resources o f the tw o firm s. The gains m ay arise from various sources, such as: potential reductions in production or distribution costs, realization of econom ies o f scale, vertical integration, adoption of m o re e ffic ie n t p ro d u c tio n or o rg a n iz a tio n a l technology, increased m arket pow er in pro duct m arkets, increased utilization o f the ac q u i r e r ’s m a n a g e m e n t te a m , re d u c tio n o f agency costs by bringing organization-speci fic assets under com m on ownership, elim ina tion of inefficient target managem ent, the use o f u n d e ru tiliz e d tax sh ie ld s, av o id an ce o f bankruptcy costs, increased leverage, other types of tax advantages. Synergy motive pre dicts that the com bined firm generates cash flow s with a present value in excess o f the sum o f the market values o f the bidding and target firms.
The agency m otive, which is based on the agency theory, suggests that takeover occurs since m anagerial m otives dominate takeover market and acquirer’s management enhances its welfare at the expense o f acquirer share holders. Jensen (1986) suggests that m ana gers m ay undertake ac q u isitio n s sim ply to increase the sizes o f their fim is, since m ana gerial com pensation and pow er often incre ase with the level o f sources under a m ana g e r’s c o n tro l. S h leifer and V yshny (1989) how ever, suggest that m anagers m ay under take acquisitions o f fimis for which they w o uld be the best possible m anagers for the pur pose o f enabling them to attract higher com pensation from their shareholders and incre
ase th e irjo b security. They suggest that ma nagem ent might acquire firms that enhance the d e p e n d e n c e o f the firm on th e ir own skills even though such announcement acqu isitions m ight reduce the value o f the firm. Harris (1994) suggest that although a fim i’s shareholders are likely to be better off if the ir firm is the target rather than the acquirer, the firm ’s manager, may be better o ff if his firm is the acquirer, since the target’s mana ger usually losses his jo b following a tak e over, whereas the acquirer’s manager usually retains his. A ccording to H arris’s m odel, a m anager’s fear that the firm with which his firm can create synergy gains will take over his firm, if his firm does not take it over, m a kes him want his fim i to be acquirer.
The hubris hypothesis suggests that mana g e rs m ake m is ta k e s in e v a lu a tin g ta rg e t firms, and engage in acquisitions even when there is no synergy (Roll, 1985). It is most li kely because acquirer com panies o v eresti m ate th eir abilities to m anage an acquisition. The hubris hypothesis relies on the perfect form o f m a rk et e ffic ie n c y . In the case o f strong-fom i efficient markets no gains from the takeover could be observed, since these takeovers do not bring any operational or fi nancial synergy and doesn’t bring a solution to agency problem s (since there is not any agency problem).
Financial literature provides evidence that m e rg e d firm s show s ig n ific a n t im p ro v e ments in postm erger cash flows. Healy, Pale- pu and Ruback (1992) examine the post-ac quisition operating perform ance o f merged firms using a sample of the 50 largest m er g ers b etw een U.S. pu b lic in d u strial firm s com pleted in the period 1979 to m id -1984. They have found significant im provem ents in operating cash flow returns after the mer
A . M U S L U M O V : T H E F I N A N C I A L A N A L Y S I S O F P O S T M E R G E R P E R F O R M A N C E O F S U R V I V I N G F I R M S
ger, resulting from increase in asset producti vity relative to their industries.
The primary objective o f this paper is to study the magnitude of the synergy created in the m erger process and specify successful merger types. For this purpose, we collected a sample of 56 m ergers between U.S. public in dustrial firms com pleted between 1992 and 1997. We establish two-staged variable analy sis model. In the first stage, we measure whe re there is synergy postmerger. We used expe rimental design to measure postmerger perfor mance improvements of surviving firms, fol lowing Healy, Palepu, and R uback (1992). Our cash flow measures are industry-adjusted and unaffected by the method of payment and the method o f accounting o f transaction.
The present study provides validity check of the study o f H ealy, P alepu and R uback (1992) in a different time setting. Our merger sample that covers 1992-1998 period is uni que and has not been analyzed in the previous researches in empirical literature. This period is characterized as a heavy merger wave peri od in U.S. industries. The U.S. industries were forced to restructure themselves in these years due to technological developm ents, growing competition, and pressure from dem and side. The merger patterns and anticipated gains va ried considerably across industries.
Media, telecom m unications and com puter industries were involved in heavy takeover activities as a result of sw iftly evolving digi tal technology, w hich was driving these in dustries together. The prim arily tw o techno logical advances; digitization and fiber op tics, were converging these industries on the “information su p e rw a y ” . The d istin c tio n s between telephones, televisions and com pu ters were starting to blur as a result of digital technologies. The broken m onopoly o f tele
com m unications firm s in the USA, pushed firms to merge in order to be com petitive and to o ffer custom ers every sort o f telephony: local, long-distance, and Internet access. G e ographical m arket expansion d esires were an o th er m otivation o f m ergers in these in dustries.
The com puter industry was trying to chal lenge the growing power o f Microsoft in the software m arket, by m erger and joint ventu res. A wave of intelligent, handheld devices, running non-M icrosoft software attracted al most all of the com puter com panies and pus hed them to takeovers. The defense industry was trying to restructure itself in the face of Pentagon’s intention to reduce the budget al located to defense expenditures, w hich w o uld result in sm aller n u m b er o f in teg rated suppliers. The pharm aceutical industry was going to be v ertically integrated. The drug com panies were merging w ith pharmacy b e nefit m anagem ent co m p an ies, m iddlem en w ith m a ssiv e b u y in g p o w e r that p ro v id e prescrip tio n d ru g s for th e ir insured c u s to mers at knockdown prices.
O ur research findings favor synergy the ory o f the m ergers. It is found that m erged firm s show significant im provem ents in ope rating cash flows relative to their industries postmerger, resulting from increases in asset productivity relative to their industries. Post m erger cash How im provem ents do not come at the expense o f the long-term perform ance and do not reflect wealth transfer from other stakeholders to shareholders. This result sug g ests that p o stm e rg e r cash flow im p ro v e ments can be attributed to the synergy resul ting from merger.
The subsam ple analyses show that high overlap, equity-financed m ergers experience significantly higher cash flow s whereas low
Y A P I K R E D İ E C O N O M I C R E V I E W . V O L U M E 1 3 . N U M B E R / , J U N E 2 0 0 2
overlap and m ixed-financed m ergers fails to perform better after merger. In the other hand, it is found that bidders with high price-to-bo- ok ratios are motivated by hubris. Their mer gers fail to create additional value, whereas bidders with low price-to-book ratios are more prudent in their merger decisions. The com bi ned size o f bidder and targets are found to be effective on the postm erger perform ance of the mergers. Significant improvements in cash Hows are observed in bigger mergers, whereas smaller mergers do not experience significant cash How improvements after merger.
The rem ainder o f the paper is organized as follows. Section II describes sample and data used in the study. Section III describes the re searc h m eth o d o lo g y . S ectio n IV an aly zes p o stm e rg e r p erfo rm a n ce o f m erg ed firm s. Section V discusses previous empirical rese arch and c o m p a re s the rese arch fin d in g s. Section VI gives a brief conclusion.
I I . S A M P L E A N D D A T A
We collected a sam ple of m ergers betw e en 1992 and 1997. The source o f the m erger d ata is M e rg e rsta t. T he p rim ary d atab ase consists o f 629 m erger b id s m eeting the be low-m entioned restrictions;
1. T h e re is a m e rg e r o ffe r to p u rc h a se stock in the com pany.
2. The details of the offer appear in M er gerstat.
3. Transaction date lies between 1992 and 1997.
4. T ransactions valued at less than $ 350 m illion were elim inated. B anks, insurance, and railroad com panies w ere elim inated, sin ce they are subject to different regulations.
5. C o u n try o f b id d ers and ta rg e ts is the USA. A cquisitions by foreign concerns were elim inated.
6. The deals that did not obtain complete ownership of the target were eliminated.
7. The m ergers that were later cancelled were eliminated.
8. The acquiring company is required to have at least, three years prem erger and two years postm erger financial and market data available on the C om pustat tapes, whereas the req u irem en t for the target com pany is three years prem erger financial and m data.
9. The size o f target should exceed 5% of the size of acquirer. Target firm size is com puted from Com pustat as the market value of common stock plus the net debt and prefer red stock at the beginning of the year before the acquisition.
10. Some companies are involved in more than one m erger bid. The m erger cases invol ving these bidder firm s are elim inated from the analysis, since there are distorting effects of crossing merger cases.
These selection criteria reduce our initial sa m p le o f 6 2 9 m e rg e r c a s e s to 56. T h is sam ple size is satisfactory fo r the analysis purposes. Healy, Palepu, and Ruback (1992) c o n d u c te d th e p o s tm e r g e r p e rfo rm a n c e analysis with 50 cases, whereas this number was 38 in Clark, and Ofek (1994).
Summary statistics for aggregate, average, and m edian deal size and to tal n u m b er o f m ergers according to calendar years are re ported in Table 1. The last two years capture more than half o f the total num ber and aggre gate dollar value of m ergers. A verage deal size is 2,983 million dollars, whereas median deal size is 1,169 million dollars. The avera ge and m edian deal sizes su g g est th at the study is focused on larger mergers.
The source of the financial and market da ta is Com pustat (North American).
A . M Ü S L Ü M O V : T H E F I N A N C I A L A N A L Y S I S O F P O S T M E R G E R P E R F O R M A N C E O F S U R V I V I N G F I R M S
TABLE 1: SUMMARY STATISTICS FOR AGGGREGATE, AVERAGE, AND MEDIAN DEAL, SIZE AND TOTAL NUMBER OF MERGERS ACCORDING
TO CALENDAR YEARS IN 56 MERGER CASES OVER THE PERIOD 1992-1997
Year Total
N u m b e r o f M ergers
A g g reg ate Deal Size (M illio n D ollars)
A v erag e D eal Size (M illio n D ollars)
M edian D eal Size (M illio n D ollars) 1992 3 1,222 407 4 0 6 1993 6 14,213 2,369 1,154 1994 5 4 ,4 1 0 882 828 1995 13 4 6 ,6 0 7 3,585 1,440 1996 15 83,735 5 ,582 2 ,1 8 4 1997 14 16,872 1,205 772 Total 5 6 167,059 2.983 1,169 III. R ESEA RC H M E T H O D O L O G Y 3.1. Testable Predictions
Since o u r p rim a ry o b je c tiv e is to te st whether there are any performance improve ments after the m erger, we examine the cash flow, profitability, operating efficiency, out put, and capital investment variables. Speci fically, we test the hypotheses that m ergers (1) increase the surviving firm ’s cash flow, (2) increase the surviving firm ’s cash flow
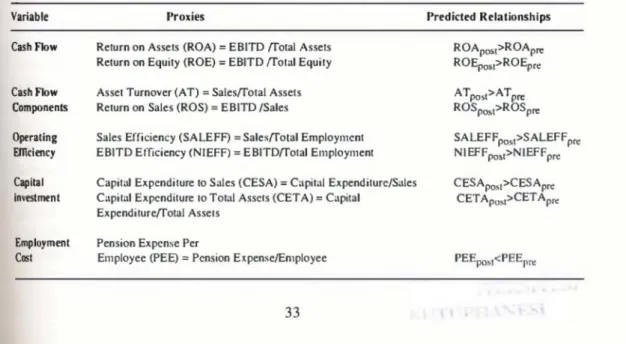
m argin, (3) increase surviving firm ’s asset p ro d u ctiv ity , (4) increase su rv iv in g firm ’s operational efficiency, (5) increase surviving firm ’s capital spending, (6) decrease su rv i ving firm ’s em ploym ent cost. T able 2 p re sents our testable predictions and the em piri cal proxies we em ploy. The testable predicti ons are held in the sim ilar line with the study o f Healy, Palepu, and Ruback (1992) in order to provide com parable results.
TABLE 2: SUMARY OF TESTABLE PREDICTIONS
TOs Table details the economic characteristics we examine for changes resulting from mergers. We also present and de fine the empirical proxies we employ in our analyses. The index symbols POST and PRE in the predicted relationship column stand for postmerger and premerger, respectively.
Variable Proxies Predicted R elationships
Cash Flow Return on Assets (ROA) = EB1TD H'otal Assets Return on Equity (ROE) = EB1TD ^ o ta l Equity
ROApOS[>ROApre ^O Epos[>ROEpre Cash Flow
Components
Asset Turnover (AT) = S ales^otal Assets Return on Sales (ROS) = EB1TD /Sales
^^pos!> ^^pre ^O S pos[>ROSpre Operating
Efficiency
Sales Efficiency (SALEFF) = S a le s^ o ta l Employment EB1TD Efficiency (N1EFF) = E B lT D ^otal Employment
SALEFF,, os[>SALEFFpre NIEFFposI>NIEFFpre Capital
investment
Capital Expenditure to Sales (CESA) = Capital Expenditure/Sales Capital Expenditure to Total Assets (CETA) = Capital
Expenditure^otal Assets
CESApost>CESApre CETA pos[>CETApre
Employment Cost
Pension Expense Per
Employee (PEE) = Pension Expense/Employee PEEpo.M<PEEpre
Y A P I K R E D İ E C O N O M I C R E V I E W , V O L U M E 1 3 . N U M B E R ¡ . J U N E 2 0 0 2
3 .2 .Variables
We use tw o different cash flow variables to m easure im provem ents in operating per fo rm an ce. We use E B IT D d e fla te d by the m arket value o f assets (m arket value o f equ ity p lu s b o o k v alu e o f net d e b t), and total equity (m arket value of equity) to provide a return m etric that is com parable across firms.
The m arket value o f assets, m easured at the beginning o f the year, is the market value of equity plus the book values o f net debt and preferred stock. We define EBITD , measured over the year, as sales, minus cost o f goods sold and selling and adm inistrative expenses, p lu s d e p re c ia tio n and g o o d w ill ex p e n se s. This measure excludes the effect o f depreci
ation, goodw ill, interest expense and income, and taxes. It is th erefo re u naffected by the m ethod o f accounting for the m erger (purc hase or pooling accounting) and the method o f financing (cash, m ixed or equity). As dis cussed in Healy, Palepu, and Ruback (1992) these factors make it difficult to com pare tra d itio n a l a c c o u n tin g retu rn s of the m erged firm over tim e and cross-sectionally.
We exclude the change in equity values o f the target and acquiring firm s at the m erger a n n o u n c e m e n t fro m the a s s e t b a se in the postm erger years. F o rth e target and acquirer, the change in equity values is m easured on the beginning o f the month before the bid of fer is announced to the date the target is dele ted from Com pustat, which is regarded as the delisting date from trading on public exchan ges. In an efficient stock m arket these revalu ations represent the capitalized value of any expected postm erger perform ance im prove ments. If m erger announcem ent equity reva luations are included in the asset base, m e asured cash flow returns will not show any abnorm al increase, even th o u g h the m erger
results in increase in operating cash flows. If there are improvements in cash fiow re turns in the postm erger period, it can arise from a variety o f sources. These include imp rovements in cash flow margins and greater asset productivity. Cash flow m argin, which is EBITD on sales, measures the pretax ope rating cash flows generated per sales dollar. Asset turnover measures the sales dollars ge nerated from each dollar o f investment in as sets (market value o f the assets). The variab les are defined so that their product equals to the EBITD on total assets, first cash flow va riable.
O perating efficiency variables prim arily deal with the increased usage o f labor to pro duce more output. Sales and EBITD on total em p lo y m en t provide a m easure to test the improvements in operating efficiency.
Improvements in cash flows may be achi eved by focusing on short-term performance im provem ents at the expense of the long-li- a b ility o f the firm . To asse ss w h eth er the merged firms focus on short-term performan ce improvements at the expense o f long-term investments, we examine their capital invest ments. Tw o empirical proxies are employed to m easure capital investm ents; capital e x penditures to sales and capital expenditures to total assets (m arket value of the assets).
Mergers give the acquirer an opportunity to renegotiate explicit and implicit contracts to lower labor costs and achieve a more effi cient mix o f capital and labor. Because we are unable to obtain sufficient data on wages d irec tly , we ex am ine pension expense per em ployee to analyze changes in labor costs in years surrounding the mergers. However, the caution should be made in the interpreta tion o f this variable, since this variable suf fers from identification problem. Firms may
A . M U S L U M O V : T H E F I N A N C I A L A N A L Y S I S O F P O S T M E R G E R P E R F O R M A N C E O F S U R V I V I N G F I R M S
not be as flexible in th eirp e n sio n expenses as they w ould be in their direct com pensation contracts.
3.3 Performance Benchmark
We aggregate perform ance data of the tar get and bidding firm s before the m erger to obtain the p re m e rg e r p e rfo rm a n c e o f the combined firms. In the calculation o f var ab les for p rem e rg er years to tal assets, sales, EBITD, capital expenditures, pension expen
ses, and num ber o f em ployees are taken as the sum o f the values for the target and acqu iring firms. The variable values o f surviving firm are used in the postm erger years.
Comparing the po stm erg er perform ance with this p rem erger benchm ark provides a measure o f the change in the perform ance. But economic factors have m uch effect on the postm erger perform ance o f the m erged fim san d so m e o f the difference betw een the premerger and postm erger perform ance co uld be due to economywide and industry fac- tors,priorto a continuation o f firm -specific performance before the m erger. Hence, we use industry-adjusted perform ance o f the tar get and bidding firms as our prim ary bench mark to evaluate postm erger performance.
Industry-adjusted perform ance is calcula ted by subtracting the industry m edian from the sample firm value for each year and firm, we use Compustat SIC industry definitions, Mid exclude the target and acquiring firm s’ values from the industry m edian value com putations. Industry values fo r the sam ple fims are constructed by w eig h in g m edian perfomance measures for the target and ac quiring firms’ industries by the relative asset sizes ofbidder and target at the beginning ye ar of the merger announcement.
At last, but not least, a caution should be
made on the synergy assum ption utilized in the present study. The synergy assum ption o f the current study is lhal i f the synergy effect is p re se n t, the t otal cash f l o w s o f m e rg e d firm sw ill be greater than the sim ple sum of cash flows of the parts that is bidder and tar get firm s. R esearch findings should be in te rp re te d w ith in this w in d o w , sin ce if the sy n erg y assu m p tio n is in c o rre c t, then the pre-m erger period would be m isrepresented by the mere sum m ation o f the two firms.
3.4. Research M ethodology
To test the research predictions, we first com pute em pirical proxies fo r every co m pany for a seven-year period: three years be fore through three years after m ergers. We then calculate the m edian of each variable for each firm over pre- and postm erger windows (p re m e rg e r= y e a rs-3 t o - 1; postm erger = ye ars + 1 to +3). Year 0, the year o f the merger, is excluded from the analysis since the vari able values for this year are not com parable across firm s and for industry com parisons.
Having com puted industry-adjusted pre- and postm erger m edians, we use the nonpa- ram etric W ilcoxon sig n ed -ran k test as our principal m ethod o f testin g fo r sig n ifican t changes in the variables follow ing M eggin- son, N ash and Van Randenborgh (1994). The financial ratios do not follow normal distri bution, making it difficult to interpret the fin dings o f the param etric analysis. T he sm all sample sizes in subsam ple analyses, also, le ad to the selection o f nonparam etric tests as a suitable m ethod o f testing postm erger perfor mance im provem ents.
We base our conclusions on the standardi zed test statistic Z , w hich fo r sam ples o f at least 10 fo llo w s a p p ro x im ately a stan d ard normal distribution. In addition to the W
Y A P I K R E D İ E C O N O M I C R E V I E W , V O L U M E 1 3 , N U M B E R I . J U N E 2 0 0 2
xon test, we use a (binomial) proportion test to determ ine w hether the proportion (p) of firms experiencing changes in a given direc tio n is g re a te r th an w o u ld be cx p c c te d by chance (typically testing w hether p = 0.5). Given the w ide variance in firms, and indust ries, finding that an overw helm ing proporti on o f firms changcd perfo rn an cc in the same direction may be at least as informative as a finding concerning the median change in per formance.
3.5. Subsam ple Analysis
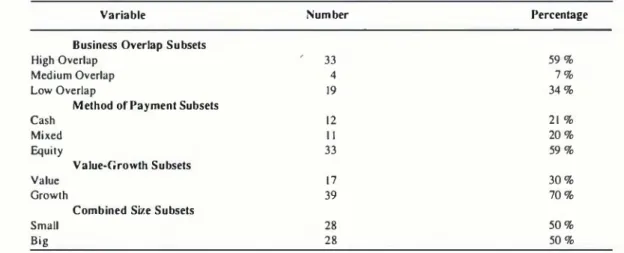
In addition to analyzing the full sample of m erged com panies, we perform sim ilar tests for below m entioned subsam ples. The per centage distribution o f the subsam ples is pro vided in T able 3.
ater cash How improvements than mergers between firms with no overlap, we exam i ne th is p ro p o s itio n by c la s s ify in g our sample mergers as those with high, medi um, and low business overlap between the target and acquiring firm s. High overlap m ergers arc m erger cases betw een those b id d e r an d ta rg e t firm s w hose at least th ree first SIC Code num bers are the s a m e, whereas in m edium overlap m ergers the first two SIC Code num bers sim ilar. The rem aining m ergers are classified as low o v e rla p m e rg e rs. S am ple an a ly sis show that 33 (59%) out of 56 mergers are high overlap mergers, whereas 4 (7%) ca ses are medium overlap and 19 (34%) ca ses are low overlap mergers.
TABLE 3: DISTRIBUTION OF SUBSAMPLES
This Table details the absolute and percentage distribution of subsampies defined in the body part of the text. Toiai 56 merger cases present in the total sample of this study.
V ariable N um ber Percentage
Business O verlap Subsets
High Overlap ' 33 59% Medium Overlap 4 7 % Low Overlap 19 34% M ethod o fP a y m e n t Subsets Cash 12 21 % Mixed 11 2 0 % ^ u i t y 33 59%
V alue-G row th Subsets
Value 17 30%
Growth 39 70%
C om bined Si/e Subsets
Small 28 50%
Big 28 50%
1. B u sin ess O verlap Subsam ples: T heoreti cal financial literature suggests that stra teg y is an im p o rta n t d ete rm in an t o f the im provem ents in the postm crger p erfo r m a n c e , th e r e f o r e , it is r e a s o n a b le to hypothesize that m ergers by firms that ha ve overlapping businesses will show
grc-2. M ethod ofP aym ent Subsamples: The m et hod o f payment o f financing is frequently cited as important to the ultimate success o f mergers. The effect o f m ethod o f pay ment is analyzed by dividing total sample to three subsets based on the form of pay ment. The first subset is called equity-fi
A . M U S L U M O V : T H E F I N A N C I A L A N A L Y S I S O F P O S T M E R G E R P E R F O R M A N C E O F S U R V I V I N G F I R M S
nanced and includes cases where only the acquirer’s com m on stock was used to pay for an acq u isitio n . The second subset is called cash -fin an ced and includes cases w here only cash w as used for paym ent. The third subset is called m ixed-financed and includes all other cases in w hich the p aym ent term s were n e ith e r pure stock nor pure cash . In som e cases, both stock and cash were used and in other cases cash and senior secu rities were used. Sam ple a n a ly sis sh o w that 33 (5 9 % ) out o f 56 m ergers are e q u ity - f in a n c e d m e rg e rs , whereas 12(21% ) cases are cash-financed and 11 (20%) cases are mixed-financed.
3. Value-Growth Subsamples: Theoretical fi nancial literature suggest that com panies with high price to book ratios ( ‘g ro w th ’ firms) are more likely to overestimate the ir own abilities to m anage an acquisition and motivated by hubris (Rau and Verma- elen (1995)). Therefore, the takeovers by growth firm s destroy shareholder value. On the o th er hand, com panies w ith low price to book ratios ( ‘v a lu e ’ firm s) are more prudent before approving acquisiti ons. Since these acquisitions are not m oti vated by hubris, they should create share holder value, we rank the m ergers into se parate subsam ples based on bidders’ price to book ratio relative to their in d u stries’ price to book ratio at the beginning o f the year o f m e rg e r a n n o u n c e m e n t. B id d er com panies’ price to book ratio is com pa red to the industry’s median price to book ratio in the beginning o f the year prior to announcement. Ifb id d e rco m p an ies’ price to book ratio is higher than industry’s m e dian price to book ratio, the m erger case is classified as ‘g ro w th ’ m erger, otherw ise
as “value” m erger. As a result o f this ran k in g , 17 (30% ) m erg ers a p p eared to be ‘v alu e’ m ergers and 39 (70% ) bidders as ‘grow th’ mergers.
4. Com bined Size Subsamples: We also exa mine whether the com bined size o f bidder and target influences p ostm erger perfor mance o f the surviving firm, we divide total sample to two different subsets according to com bined size o f the b id d er and targets. Combined size is calculated as the sum o f bidder and target firm sizes in the beginning o f the year prior to announcement. Total as sets are calculated by sum m ing m arket va lue o f equity and book value o f total debt and preferred stock, we classify mergers as “larger” and “smaller” according to their si ze relative to the median for all firms in the sample. If the com bined size o f merger is greater than or equal to the calculated medi an o f the sample, the merger case is classifi ed as a larger merger, otherwise as a smaller merger. Since merger cases are ranked rela tive to their median, both subsets have an equal number (28 mergers) of merger cases.
I V . E M P I R I C A L R E S U L T S
In this section we present and discuss our em pirical results for the full sam ple o f m er gers, and for the four subsam ples. We first present and discuss our empirical results (in T able 4 and T able 5) for the com plete sam p
le o f 56 mergers. Then we discuss our results for the fo llo w in g su b sa m p le s o f our data: High overlap versus m edium overlap versus low overlap m ergers (Table 6)*; cash finan ced versus m ixed financed versus equity-fi n a n c e d m e rg e rs (T a b le 7); v a lu e v e rs u s g ro w th m e rg e rs (T a b le 8 ); la r g e r v e rsu s
' T able 6 thro ug h T ab le 9 are p ro v id e d at the e n d o f the A rtic le .
Y A P I K R E D İ E C O N O M I C R E V I E W , V O L U M E 1 3 . N U M B E R I . J U N E 2 0 0 2
sm aller m ergers (Table 9). For each of these partitions, we exam ine and report (in the text and in Tables 6 to 9) w hether each subsam p le o f firm s experience significant changes in the variable values after merger. We also test w h e th e r the d iffe re n c e b etw een the value changes fo r the subsam ples are significant.
4.1. Cash Flow Changes
Table 4 reports the changes in cash flows in years 1 to 3 relative to the year before m er ger. F irm s’ m edian ROA increase by 0.24% in year 1, decrease by 1.40% in year 2, decre ase by 2.28% in year 3 relative to year -1. It seem s that there is dow nw ard trend in firm s’ cash flow s in the postm erger period. How e ver, the sample firm s’ industries experience decline in cash flows also, and this decline is g re a te r than sam ple firm s ’. T h e re fo re, in d u s tr y - a d ju s te d c a sh flo w s in c r e a s e by 3.32% in year 1, 1.32% in year 2, and i .61%
in year 3 relative to year -1. Apparently, mer ger-related cash flow im provem ents are im mediately observed following the merger.
Another cash flow proxy, ROE, however, shows below -industry perform ance com pa ring to y e a r-1 . Industry-adjusted ROE incre ases by 0.66 % in year 1, and then decreases by 0.65% in year 2, and 1.22% in year 3 rela tive to year -1.
Table 5 reports that in accordance with re search predictions, industry-adjusted ROA increases significantly after m erger. The in du stry -ad ju sted m ean (m edian) increase in ROA after m erg er is 1 percentage points (1 percent) and 61 percent o f all firms experien ce increasing ROA after m erger. These test statistics are all significant at the 10 percent level2. This result suggests that mergers cre ate synergy. Cash flows deflated on the mar ket value o f stocks (RO E) show significant changes after m erger, as well.
TABLE 4: MEDIAN CHANGE OF VARIABLES INI POSTMERGER YEARS RELATIVETO THE YEAR BEFORE THE MERGER
This Table presents median change of variables in years 1 to 3 relative to the year before the merger (y e ^ -1). Y ear-1 value for the combined firms is weighted averages of t^ g e t ^ d acquirer values, with the weights being the relative set values of the two fim s . Postmerger values use data for the surviving fim s . Industry-adjusted variables are computed for each firm and year as the difference tetw een the sample firms’ growth rates in that year and growth rates for variab les in the same industry. Target and acquirer industry values are weighted by the relative size of the acquirer and target firms in y e a r - 1.
Variables Firm Industry-adjusted
______________________________________________________
Median (%)_________________________Median (% j
Cash FlowsR eturn on Assets (ROA)
Y ear-1 to 1 0.24 3.32
Year - 1 to 2 - 1.<W 1.32
Year - 1 to 3 -2.28 1.61
R eturn on E quity (ROE)
Y ear-1 to 1 -1.75 0.66
Year - 1 to 2 -1.31 -0.65
Year - 1 to 3 -2.35 - 1.22
^ S in c e o u r h y p o th e s e s are u n id ir e c t io n a l, w e use o n e - ta ile d statistical tests.
TABLE 5: POSTMERGER PERFORMANCE ANALYSIS:
SUMMARY OF RESULTS FROM TESTS OF PREDICTIONS FOR THE FULL SAMPLE OF MERGERS
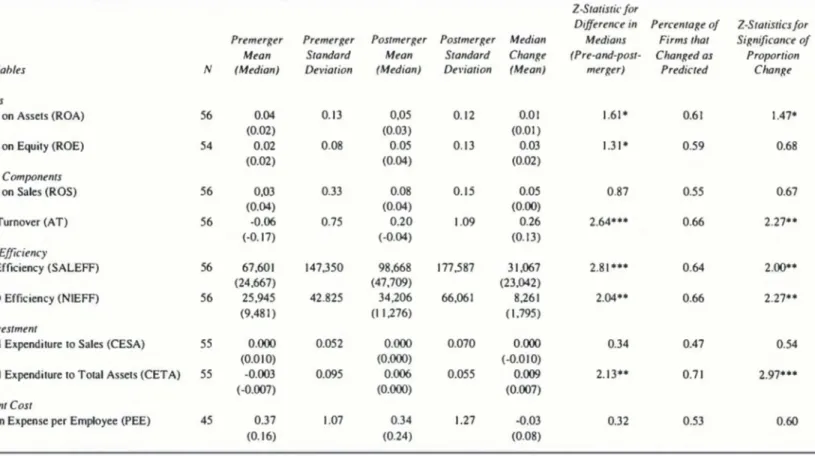
This Table presents empirical results for our full sample of mergers. For each empirical proxy we give the number of usable observation, the mean and median values, standard deviati on of the proxy for the three-year periods prior and subsequent to merger, the mean and median change in the proxy’s value for postmerger versus premerger period, and a test of signi ficance of the change in median values. The final two columns detail the percentage of firms whose proxy values change as predicted, as well as a test of significance of this change.
Z-Statistic fo r
Difference in Percentage o f Z-Statistics fo r Premerger Premerger Postmerger Postmerger Median Medians Firms that Significance o f Mean Standard Mean Standard Change (Pre-and-post- Changed as Proportion
Variables N (Median) Deviation (Median) Deviation (Mean) merger) Predicted Change
Cash Flows
Return on Assets (ROA) 56 0.04 0.13 0,05 0.12 0.01 1.61* 0.61 1.47*
(0.02) (0.03) (0 .01)
Return on Equity (ROE) 54 0.02 0.08 0.05 0.13 0.03 1.31* 0.59 0.68
(0.02) (0.04) (0.02)
Cash Flow Components
Return on Sales (ROS) 56 0,03 0.33 0.08 0.15 0.05 0.87 0.55 0.67
(0.04) (0.04) (0.00)
Asset Turnover (AT) 56 -0.06 0.75 0.20 1.09 0.26 2.64*** 0.66 2.27**
(-0.17) (-0.04) (0.13)
Operating Efficiency
Sales Efficiency (SALEFF) 56 67,601 147,350 98,668 177,587 31,067 2.81*** 0.64 2.00**
(24,667) (47,709) (23,042)
EB1TD Efficiency (NIEFF) 56 25,945 42.825 34,206 66,061 8,261 2.04** 0.66 2.27**
(9,481) (11,276) (1.795)
Capital Investment
Capital Expenditure to Sales (CESA) 55 0.000 0.052 0.000 0.070 0.000 0.34 0.47 0.54
(0.010) (0,000) (-0.010)
Capital Expenditure to Total Assets (CETA) 55 -0.003 0.095 0.006 0.055 0.009 2.13** 0.71 2 97***
(-0.007) (0.000) (0.007)
Employment Cost
Pension Expense per Employee (PEE) 45 0.37 1.07 0.34 1.27 -0.03 0.32 0.53 0.60
(0.16) (0.24) (0.08)
*,**, *** indicate sig n ifica n ce a t 1 0 J , a n d /% significance levels respectively u sin g o n e-ta iled test.
A . M U SL U M O V : TH E F IN A N C IA L A N A LY SI S OF PO ST M ER G ER PE RFOR MANCE OF S U R V IV IN G F IR M S
Y A P I K R E D İ E C O N O M I C R E V I E W . V O L U M E 1 3 . N U M B E R I . J U N E 2 0 0 2
Interesting pattern is observed across sub samples (Tables 6 to 9). High overlap, equity- financed, value, and larger merger subsamples show significantly positive cash flow im pro vem ents, whereas cash flow changes are posi tive, but not statistically significant for rem a ining su b sam p les. The percentage o f firm s that experienced increasing industry-adjusted ROA is M percent in high overlap, 53 percent in low overlap, 67 percent in equity-financed, 58 percent in cash-financed, 45 percent in mi- xed-financed, 76 percent in “value”, 54 per cent in “grow th”, 64 percent in larger, and 57 percent in sm aller m erger subsam ples. This conclusion casts doubts on the profitability of mixed-financed and growth mergers.
4.2. Cash Flow Com ponents
Cash flow increases may stem from two sources: increasing cash flow m argin or inc reasing asset turnover. O ur results in table 4 suggest that the main source o f the observed cash flow increase is increasing asset produc tivity. Asset turnover increased significantly for postm erger period showing 26 percentage points (13 percent) industry-adjusted mean (median) increase and 66 percent o f all firn s experience increasing ROE after merger. The W ilcoxon and p roportion test statistics are significant at 5 percent level.
Cash flow m argins do not change signifi cantly after m erger (Table 5). The industry- adjusted m ean (m edian) change in return on sales (ROE) after m erger is not significant.
From tables 6 to 9, it is evident that all of the su b sa m p le s e x c e p t c a sh -fin a n c e d and sm aller m erg er su b sets experience sig n ifi cantly increasing asset turnover. C ash flow m argin do not show significant increases in any o f the subsam ples. T his result suggests that m e rg e r b e n e fits are p rim a rily g ain ed
through realizing more sales dollars per asset dollar more than gaining market power thro ugh increased sales margins.
4.3. Operational Efficiency Changes Financial literature predicts that merger of two com panies will help these firn s to em p loy their human, financial, and technological resources more efficiently. Both of the opera ting efficiency measures we employ, industry- adjusted sales per em ployee (SALEFF) and net cash flow per em ployee (NIEFF), show significant median increases following merger for the full sample. From table 5, it is evident that sales per employee go from a premerger industry-adjusted average (m edian) 67,601 USD (24,667 USD) to postm erger industry- a d ju s te d a v e ra g e (m e d ia n ) 9 8 ,6 6 8 USD (47,709 USD). Net cash flow peremployee al so shows significant increase; industry-adjus ted prem erger mean (m edian) 25,945 USD (9,481 U SD) goes to 34,206 USD (11,276 USD). Further, SALEFF and NIEFF increase in 64 and 66 percent of all cases, significant at the 5 percent levels.
Subsam ple study (T ables 6 to 9) shows that operating efficiency im proves in all of the subsam ples except cash- and m ixed-fi- n an ced , v alu e, and larg e m e rg e r su b se ts. These results are surprising in te rn s o f value and larger m erger subsam ples, since these subsam ples experience significantly impro ving cash flow changes.
4.4. C apitallnvestm ent
We com pute capital investm ent intensity using two proxies, capital expenditure divided by sales (CESA) and capital expenditures di vided by total assets (CETA). The CESA me asure is not statistically significant according to both the W ilcoxon and proportion tests, but
A . M U S L U M O V : T H E F I N A N C I A L A N A L Y S I S O F P O S T M E R G E R P E R F O R M A N C E O F S U R V I V I N G F I R M S
CETA show s sig n ifican t increases on both tests (T able 5). On av erag e (m ed ian ), our sample firms increase industry-adjusted capi tal investment relative to total assets by 0.9 percentage p o in ts (0.7 p e rc e n t), from in dustry-adjusted CETA ^ . 3 percent (-0.7 per cent) prem erger to industry-adjusted CETA 0.6 percent (0 percent) postm erger, and 71 percent of all firms increase CETA after m er ger. The Wilcoxon test statistics (2.13) signifi cant at the five percent level, whereas propor tion test statistics significant at the one percent level. The results suggest that com panies do not cut their long-term investment in order to increase their short-term cash nows.
Capital investment hasn’t been cut signifi cantly a c ro ss su b sa m p le s (T a b le s 6 to 9), even it increased significantly in high over lap, equity-financed, value, and large merger subsamples. These results suggest that mer ging firm s are investing in th e ir long-term perspective along with short- and m edium - tern profitability.
4.5. Employment Cost
One o f the expected effects o f the merger is decline in the em ploym ent cost, since m er gers a llo w re n e g o tia tio n o f e m p lo y m e n t contracts. E ven if there are co n tractio n s in employment cost, it does not refer to synergy gains o f m ergers. This phenom enon m ostly states w ealth transfer from em ployers to sha reholders.
We find that pension expense per em plo yee (PEE) does not change significantly for p o stm e rg er p e rio d (T a b le 5). S u b sa m p le analyses do not detect any significant decre ases in PEE across subsam ples (Tables 6 to 9). These results should be interpreted with caution, since this variable suffers from iden tification problem. Firms may not be as flex
ible in their pension expenses as they would be in their direct com pensation contracts.
V . C O M P A R I S O N W I T H P R I O R R E S E A R C H E S
There are a num ber o f researches conduc ted on the p o stm e rg e r p e rfo rm an ce o f the m erged firms in the empirical literature. Lev and M andelker (1972) find that the long-run profitability of acquiring firm s is som ew hat higher than that o f com parable nonm erging firms. However, acquiring firms experience a decrease in growth rate in the postm erger pe riod com pared with nonmerging firms. A ut h o rs relate th is p h e n o m e n o n to a “ sh a k e d o w n ” or “ d ig estio n ” effect. N evertheless, th is study su ffers serio u s m eth o d o lo g ic a l problems (Reid (1973)).
Clark and Ofek (1994) examine a sample of takeovers occurring betw een 1981 and 1988 identified as being attempts to restructure dist ressed targets. They used performance indica tors that focus on postmerger performance of both com bined firm s and target alone to test whether the combination o f bidder and target is a successful method o f restructuring the tar get. All o f the perfornance m easures indicate that the m ergers are not successful. 20 out o f the 38 restructuring attempts are classified as failed attempts, nine as marginally successful, and nine as successful in this study.
Healy, Palepu and Ruback (1992) exam i ne the post-acquisition operating perform an ce o f m erged firms using a sam ple o f the 50 largest m ergers between U.S. public industri al firms com pleted in the period 1979 to mid-
1984. Their findings are in the same line with the fin d in g s o f c u rren t stu d y . The m erg ed firm s are fo u n d have s ig n ific a n t im p ro v e m ents in operating cash flow returns after the m erger, resulting from increase in asset pro
Y A P I K R E D İ E C O N O M I C R E V I E W . V O L U M E 13, N U M B E R I , J U N E 2 0 0 2
ductivity relative to their industries. These im provem ents were particularly strong for transactions involving firm s in overlapping businesses. Sam ple firm sm ain tain th eircap i- tal e x p e n d itu re and R& D rates relativ e to their industries after the merger.
The results o f the present study are directly com parable and in the same line with that of H ealy, Palepu and Ruback (1992). O ur fin dings approves the validity o f their findings in differen t time setting, though, adding some new insights about the mergers o f growth and value firms which is consistent with the perfor m ance extrapolation hypothesis o f Rau and Vermaelen (1995), which states that takeovers by growth firn s destroy shareholder value
V I . S U M M A R Y A N D C O N C L U S I O N S
O ur em pirical analysis o f postm erger per formance of surviving firms provides support to natural selection hypothesis. Our findings indicate that surviving firm s show significant improvements in operating cash flows relative to their industries after the merger, resulting from increases in asset productivity relative to their industries. The im provem ents are parti cularly strong in high overlap, equity-finan c ed , value an d la rg e r m erg er su b sam p les. C ash flow m argins apparently stay unchan ged. This suggests that postmerger performan ce improvements are not due to the market po wer gains. Postmerger performance improve m ents feed from im proved operating effici en cy . M erg in g firm s are in v estin g in their long-tern ^ rsp e c tiv e as well instead of focu sing only on their short-term cash flows. The postm erger cash glow im provem ents do not reflect wealth transfer from employers to sha reholders, since m ergers do not lead to em p loyment cost cuts. These findings suggest that
m ergerscreate additional value or to put it dif ferently merger result in the creation of fitter specics (firms).
Consistent with research predictions, high o v e rla p m erg e rs are fo u n d to e x p e rie n c e strong and statistically significant cash flow improvements whereas low overlap mergers fa ils to im p ro v e th e ir cash flo w s s ig n ifi cantly. This result suggests that bidders are more inclined to utilize merger-related syner gies in intra-industry mergers.
Equity-financed mergers experience signi ficant im provem ent in postm erger industry- adjusted cash flows. This conclusion is con sistent with the finance theory which suggests that method o f payment reveal information to the market. Stocks are preferred since value of equity frequently used in lim iting overpay ment, that is equity-financed mergers are inc lined to overcom e the inform ational asym metry in the merger market (Hansen, 1987).
A ccording to research findings, bidders with high price-to-book ratios do not experi ence statistically significant cash flow impro vements; whereas bidders with low price to book ratios are more prudent in their merger d e c is io n s . T h e p o o r p e rfo rm a n c e of the growth bidders may be due to hubris and the failure o f the market for corporate control to monitor their actions properly.
The com bined size of bidder and targets are found to be effective on the postm erger perform ance of the mergers. Cash flows imp rove significantly in big-sized mergers, whe reas sm all-sized m ergers do not experience sig n ific a n t cash flow im p ro v em en ts after merger. The success of the big-sized mergers is apparently due to the close control of them by the m ark et an d o th e r d e c isio n -m ak ers (such as shareholders and board o f directors) who have to approve the acquisition.
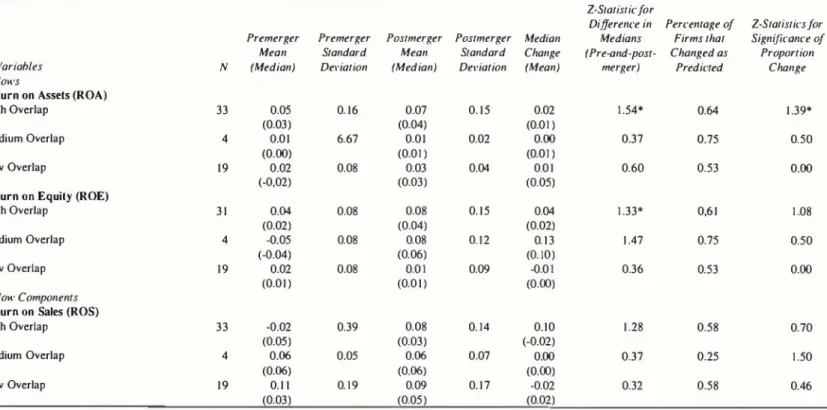
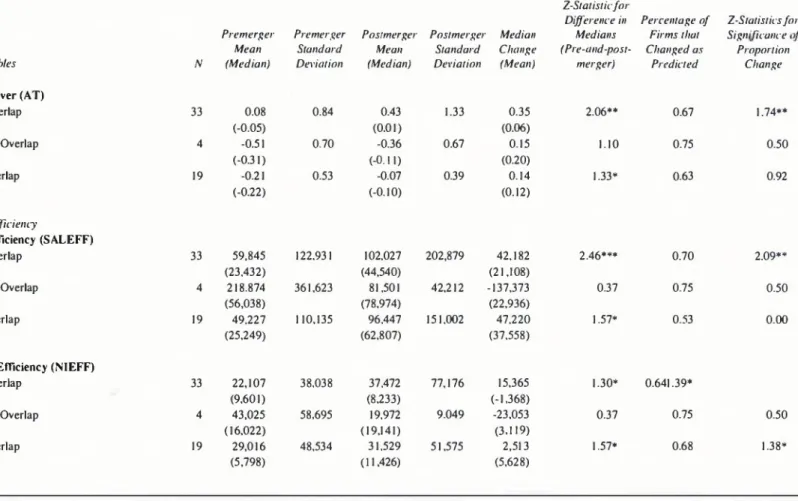
TABLE 6: POSTM ERGER PERFORM ANCE ANALYSIS: SUMM ARY OF RESULTS FROM TESTS OF PREDICTIONS FOR THE BUSINESS OVERLAP SUBSETS
This Table presents comparisons of empirical results for mergers divided to three subsamples according to overlap degree of mergers. The sample is divided into three subsets as high, medi um, and low business overlap between the target and acquiring firms. High overlap mergers are mergercases between thosebidder and target firms whose at least three first SIC Code num bers are the same, whereas in medium overlapping mergers the first two SIC Code numbers similar and in low overlapping mergers at maximum first SIC code number is similar. For each empirical proxy we give the number of usable observation, the mean and median values, standard deviation of the proxy for the three-year periods prior and subsequent to merger, the mean and median change in the proxy’s value for postmerger versus premerger period, and a test of significance of the change in median values. The final two columns detail the percentage of firms whose proxy values change as predicted, as well as a test of significance of this change. Significance levels for subsets with total number of cases less than 10 are not reported.
Z-Statistic fo r
Difference in Percentage o f Z-Statistics fo r Premerger Premerger Postmerger Postmerger Median Medians Firms that Significance o f
Mean Standard Mean Standard Change (Pre-and-post- Changed as Proportion
Variables N (Median) Deviation (Median) Deviation (Mean) merger) Predicted Change
Cash Flows
R etu rn on Assets (ROA)
High Overlap 33 0.05 0.16 0.07 0.15 0.02 1.54* 0.64 1.39* (0.03) (0.04) (0.01) Medium Overlap 4 0.01 6.67 0.01 0.02 0.00 0.37 0.75 0.50 (0 .00) (0.01) (0.01) Low Overlap 19 0.02 0.08 0.03 0.04 0.01 0.60 0.53 0.00 (-0,02) (0.03) (0.05)
R eturn on Equity (ROE)
H igh Overlap 31 0.04 0.08 0.08 0.15 0.04 1.33* 0,61 1.08 (0.02) (0.04) (0.02) Medium Overlap 4 -0.05 0.08 0.08 0.12 0.13 1.47 0.75 0.50 (-0.04) (0.06) (0. 10) Low Overlap 19 0.02 0.08 0.01 0.09 -0.01 0.36 0.53 0.00 (0 .01) (0.01) (0 .00)
Cash Flow Components
R eturn on Sales (ROS)
High Overlap 33 -0.02 0.39 0.08 0.14 0.10 1.28 0.58 0.70 (0.05) (0.03) (-0.02) Medium Overlap 4 0.06 0.05 0.06 0.07 0.00 0.37 0.25 1.50 (0.06) (0.06) (0.00) Low Overlap 19 0.11 0.19 0.09 0.17 -0.02 0.32 0.58 0.46 (0.03) (0.05) (0.02)
*,**, *** indicate significance a t 1 0 3 , a n d 1% significance levels respectively u sin g one-tailed test.
A . M U S L U M O V . TH E F IN A N C IA L A N A L Y S IS OF P O S T M E R G E R PE RFOR MANCE OF S U R V IV IN G F I
TABLE 6: POSTMERGER PERFORMANCE ANALYSIS: SUMMARY OF RESULTS FROM TESTS OF PREDICTIONS FOR THE BUSINESS OVERLAP SUBSETS (CONTINUED)
Z-Statisticfor
Difference in Percentage o f Z-Statistics fo r Premerger Premerger Postmerger Postmerger Median Medians Firms that Significance t
Mean Standard Mean Standard Change (Pre-and-post- Changed as Proportion
Variables N (Median) Deviation (Median) Deviation (Mean) merger) Predicted Change
set T urnover (AT)
High Overlap 33 0.08 0.84 0.43 1.33 0.35 2.06** 0.67 1.74** (-0.05) (0.01) (0.06) Medium Overlap 4 -0.51 0.70 -0.36 0.67 0.15 1.10 0.75 0.50 (-0.31) (-0 . 11) (0.20) Low Overlap 19 -0.21 0.53 -0.07 0.39 0.14 1.33* 0.63 0.92 (-0.22) (-0. 10) (0 . 12) Operating Efficiency
Sales Efficiency (SALEFF)
High Overlap 33 59,845 122.931 102.027 202,879 42.182 2.46*** 0.70 2.09** (23,432) (44,540) (21,108) Medium Overlap 4 218.874 361,623 81,501 42,212 -137,373 0.37 0.75 0.50 (56,038) (78,974) (22,936) Low Overlap 19 49,227 110,135 96,447 151,002 47,220 1.57* 0.53 0.00 (25,249) (62,807) (37,558)
EBITD Efficiency (NIEFF)
High Overlap 33 22,107 38,038 37,472 77,176 15,365 1.30* 0.641.39* (9,601) (8,233) (-1,368) Medium Overlap 4 43,025 58,695 19,972 9.049 -23,053 0.37 0.75 0.50 (16,022) (19,141) (3,119) Low Overlap 19 29,016 48,534 31,529 51,575 2,513 1.57* 0.68 1.38* (5,798) (11.426) (5,628)
*.**, *** indicate significance a t lOJ' a n d /% significance levels respectively using nne-taiied test.
Y A P I K R E D İ E C O N O M IC RE VIE W', V O L U M E 13 . N U M B E R 1, JU N E 2 0 0 2
T A B L E 6: P O S T M E R G E R P E R F O R M A N C E AN A LY SIS: SUM M ARY O F R E SU L T S FR O M TESTS OF P R E D IC T IO N S FOR T H E BU SIN ESS O V E R L A P SUBSETS (C O N TIN U ED )
Z-Statisticfor
Chi-Square-Difference in Percentage o f Statistics fo r Premerger Premerger Postmerger Postmerger Median Medians Firms that Significance o f
Variables Mean Standard Mean Standard Change (Pre-and-post- Changed as Proportion
N (Median) Deviation (Median) Deviation (Mean) merger) Predicted Change
Capital Investment
C apital E xpenditure to Sales (CESA)
High Overlap 32 0.001 0.058 -0.005 0.080 -0.006 0.08 0.47 0.53 (0.011) (0,004) (-0.007) Medium Overlap 4 -0.004 0.024 -0.003 0.020 0.001 0.00 0.50 0.50 (0.003) (-0.002) (-0.005) Low Overlap 19 -0.001 0.048 -0.005 0.061 -0.004 0.36 0.47 0.46 (0.010) (-0.003) (-0.013)
C apital E xpenditure to T otal Assets (CETA)
High Overlap 32 0.005 0.122 0.017 0.062 0.012 1.70** 0.72 2.30** (0.011) (0.007) (-0.004) Medium Overlap 4 -0.020 0.015 -0.013 0.026 0.007 1.83 1.00 1.50 (-0.015) (-0.003) (0.012) Low Overlap 19 -0.014 0.037 -0.008 0.045 0.006 0.77 0.63 0.92 (-0.008) (-0.004) (0.004) Employment Cost
Pension Expense per Employee (PEE)
High Overlap 25 0.51 1.06 0.36 1.23 -0.15 0.26 0.44 0.40 (0.21) (0.24) (0.03) Medium Overlap 4 -0.04 2.02 -0.07 1.33 -0.03 0.00 0.50 0.50 (-0.17) (0.17) (0.34) Low Overlap 16 0.27 0.82 0.40 1.38 0.13 0.77 0.69 1.75** (0.15) (0.22) (0.07)
* * * , *** indicate significance a i lO J i.a n d I% sig n ifica n c e levels respectively using o n e-ta iled lest.
A . M U SL U M O V : TH E F IN A N C IA L A N A L Y S IS OF PO S T M ER G ER PERF OR MAN CE OF S U R V IV IN G F IR M S
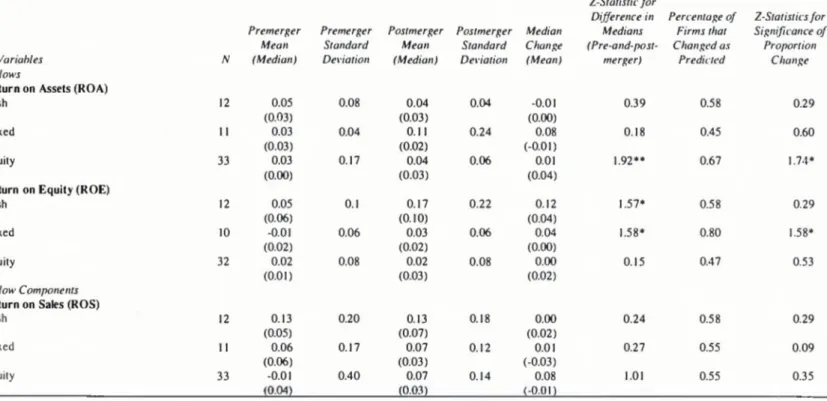
TABLE 7: POSTMERGER PERFORMANCE ANALYSIS: SUMMARY OF RESULTS FROM TESTS OF PREDICTIONS FOR THE METHOD OF PAYMENT SUBSETS
This Table presents comparisons of empirical results for mergers divided to three subsamples according to method of payment. We divide our sample into three subsets based on the method o f payment. The first subset is called equity-financed and includes merger cases where only the acquirer’s common stock was used to pay f or an acquisition. The second sub set is called cash-financed and includes merger cases where only cash was used. The third subset is called mixed-financed and includes all other m erger cases in which the payment terms were neither pure stock nor pure cash For each empirical proxy we give the number of usable observation, the mean and median values, standard deviation of the proxy for the three-year periods prior and subsequent to merger, the mean and median change in the proxy’s value for postmerger versus premerger period, and a test of significance of the change in median values. The final two columns detail the percentage of firms whose proxy values change as predicted, as well as a test of significance of this change. Significance levels for subsets with total number of cases less than 10 are not reported.
2-Statistic fo r
Difference in Percentage o f 2-Statistics fo r Premerger Premerger Postmerger Postmerger Median Medians Firms that Significance o f Mean Standard Mean Standard Change (Pre-and-post- Changed as Proportion
Variables N (Median) Deviation (Median) Deviation (Mean) merger) Predicted Change
Cash Flows
R eturn on Assets (ROA)
Cash 12 0.05 0.08 0.04 0.04 -0.01 0.39 0.58 0.29 (0.03) (0.03) (0.00) Mixed II 0.03 0.04 0.11 0.24 0.08 0.18 0.45 0.60 (0.03) (0.02) (-0.01) Equity 33 0.03 0.17 0.04 0.06 0.01 1.92** 0.67 1.74* (0.00) (0.03) (0.04)
Return on Equity (ROE)
Cash 12 0.05 0.1 0.17 0.22 0.12 1.57* 0.58 0.29 (0.06) (0. 10) (0.04) Mixed 10 -0.01 0.06 0.03 0.06 0.04 1.58* 0.80 1.58* (0.02) (0.02) (0.00) Equity 32 0.02 0.08 0.02 0.08 0.00 0.15 0.47 0.53 (0.01) (0.03) (0.02)
Cash Flow Components
R eturn on Sales (ROS)
Cash 12 0.13 0.20 0.13 0.18 0.00 0.24 0.58 0.29 (0.05) (0.07) (0.02) Mixed 11 0.06 0.17 0.07 0.12 0.01 0.27 0.55 0.09 (0.06) (0.03) (-0.03) Equity 33 -0.01 0.40 0.07 0.14 0.08 1.01 0.55 0.35 (0.04) (0.03) (-0 .01)
*,**. *** indicate significance a t 10.5. and /% significance le vels resp ectively using o n e-ta iled test.
Y A P I K RE Di E C O N O M IC R E V IE W . V O L U M E 13 . N U M B E R I . J U N E 2 0 0 2
T A B L E 7: P O S T M E R G E R P E R F O R M A N C E AN A LY SIS: SUM M ARY O F R ESU L T S F R O M TE ST S OF P R E D IC T IO N S FO R T H E M E T H O D O F PA Y M E N T SU BSETS (C O N TIN U ED ) Variables N Premerger Mean (Median) Premerger Standard Deviation Postmerger Mean (Median) Postmerger Standard Deviation Median Change (Mean) Z-Statistic fo r Difference in Medians (Pre-and-post- merger) Percentage o f Firms that Changed as Predicted Chi-Square- Statistics fo r Significance o f Proportion Change
Asset T urnover (AT)
Cash 12 0.11 (0.02) 0.78 0.32 (-0.05) 1.82 0.21 (-0.07) 0.55 0.58 0.29 Mixed II -0.07 (-0,05) 0,69 0.40 (-0.04) 1.34 0.47 (0.01) 1.60* 0.73 1.21 Equity 33 -0.12 (-0.27) 0.77 0.10 (-0.03) 0.55 0.22 (0.24) 2.31** 0.76 2.79*** Operating Efficiency
Sales Efficiency (SALEFF)
Cash 12 68,058 (24.770) 161,422. 118,393 (43,652) 266,454 50,335 (18,882) 0.39 0.58 0.29 Mixed 11 120,315 (64,135) 220,191 80,436 (84,109) 108,681 -39,879 (19,974) 0.27 0.45 0.60 Equity 33 49,864 (23,432) 109,223 97,572 (46,108) 160,768 47,708 (22,676) 3.08*** 0.79 3.13***
E B ITD Efficiency (NIEFF)
Cash 12 18,639 (11,893) 22,474 31,646 (11,669) 44,395 13,007 (-224) .094 0.58 0.29 Mixed 11 41,640 (27,520) 48,941 33,864 (4.362) 53,220 ( -7,776 -23,158) 0.09 0.64 0.60 Equity 33 23,371 (6,515) 46,027 35,250 (11,126) 77,034 11,879 (4,611) 1.89** 0.70 2.09**
* '* * ' *** indicate significance at 1 0 a n d /% significance le\’els respectively using o ne-tailed test.
A M U SLU M O V : TH E F IN A N C IA L A N A L Y S IS OF PO S T M ER G ER PE RFOR MANCE OF S U R V IV IN G F IR M S
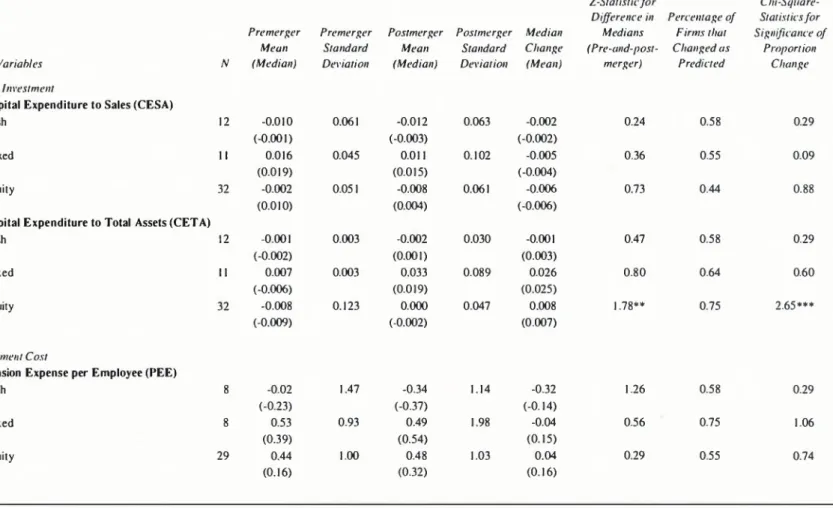
TABLE 7: POSTMERGER PERFORMANCE ANALYSIS: SUMMARY OF RESULTS FROM TESTS OF PREDICTIONS FOR THE METHOD OF PAYMENT SUBSETS (CONTINUED)
Z-Statistic fo r Chi-Square-Difference in Percentage o f Statistics fo r Premerger Premerger Postmerger Postmerger Median Medians Firms that Significance o f
Mean Standard Mean Standard Change (Pre-and-post- Changed as Proportion
Variables N (Median) Deviation (Median) Deviation (Mean) merger) Predicted Change
Capital Investment
C apital Expenditure to Sales (CESA)
Cash 12 -0.010 0.061 -0.012 0.063 -0.002 0.24 0.58 0.29 (-0 .001) (-0.003) (-0.002) Mixed 11 0.016 0.045 0.011 0.102 -0.005 0.36 0.55 0.09 (0.019) (0.015) (-0.004) Equity 32 -0.002 0.051 -0.008 0.061 -0.006 0.73 0.44 0.88 (0.010) (0.004) (-0.006)
C apital E xpenditure to Total Assets (CETA)
Cash 12 -0.001 0.003 -0.002 0.030 -0.001 0.47 0.58 0.29 (-0.002) (0 .001) (0.003) Mixed 11 0.007 0.003 0.033 0.089 0.026 0.80 0.64 0.60 (-0.006) (0.019) (0.025) Equity 32 -0.008 0.123 0.000 0.047 0.008 1.78** 0.75 2.65*** (-0.009) (-0.002) (0.007) Employment Cost
Pension Expense per Employee (PEE)
Cash 8 -0.02 1.47 -0.34 1.14 -0.32 1.26 0.58 0.29 (-0.23) (-0.37) (-0.14) Mixed 8 0.53 0.93 0.49 1.98 -0.04 0.56 0.75 1.06 (0.39) (0.54) (0.15) Equity 29 0.44 1.00 0.48 1.03 0.04 0.29 0.55 0.74 (0.16) (0.32) (0.16)
*** indicate sig n ifica n ce a t ¡ 0 ,5 , a n d 1% sig n ifica n ce levels respectively using o ne-tailed test.
Y A P I K R E D İ E C O N O M IC R E V IE W , V O L U M E 13 , N U M B E R /, JU N E 2 0 0 2
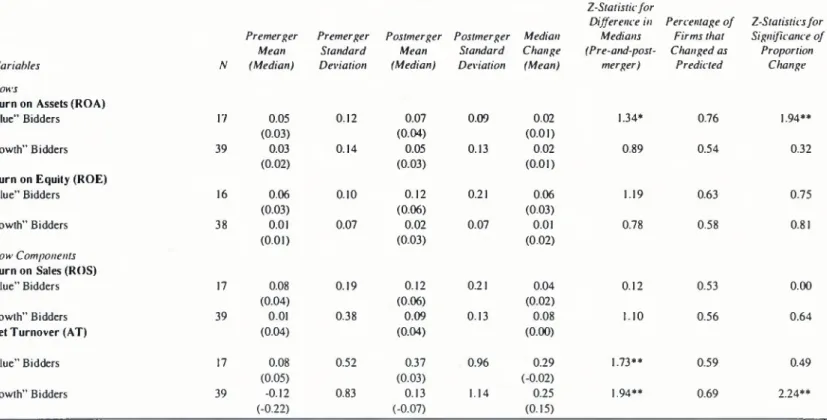
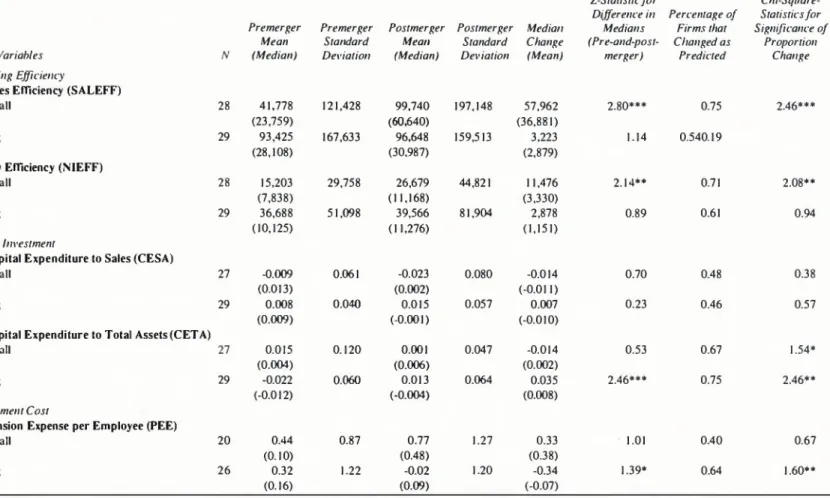
TABLE 8: POSTM ERGER PERFORM ANCE ANALYSIS: SUM M ARY OF RESULTS FROM TESTS OF PREDICTIONS FOR THE VALUE-GROW TH SUBSETS
This Table presents comparisons of empirical results for mergers divided to two subsets according to value-growth category of bidders. Mergers in growth category include bidders whose price-to-book ratio are greater than or equal to the industry median. Mergers in value category include bidders whose price-to-book ratio is less than the industry median. For each empirical proxy we give the number o f usable observation, the mean and median values, standard deviation o f the proxy for the three-year periods prior and subsequent to mer ger, the mean and median change in the proxy’s value for postmerger versus premerger period, and a test of significance o f the change in median values. The final two columns deta il the percentage o f firms whose proxy values change as predicted, as well as a test o f significance o f this change. Significance levels for subsets with total number o f cases less than 10 are not reported.
Z-Statisticfor
Difference in Percentage o f Z-Statistics fo r Premerger Premerger Postmerger Postmerger Median Medians Firms that Significance o f
Mean Standard Mean Standard Change (Pre-and-post- Changed as Proportion
Variables N (Median) Deviation (Median) Deviation (Mean) merger) Predicted Change
Cash Flows
R eturn on Assets (ROA)
“Value” Bidders 17 0.05 0.12 0.07 0.09 0.02 1.34* 0.76 1.94**
(0.03) (0.04) (0.01)
“Growth" Bidders 39 0.03 0.14 0.05 0.13 0.02 0.89 0.54 0.32
(0.02) (0.03) (0.01)
R eturn on Equity (ROE)
“Value” Bidders 16 0.06 0.10 0.12 0.21 0.06 1.19 0.63 0.75
(0.03) (0.06) (0.03)
“Growth" Bidders 38 0.01 0.07 0.02 0.07 0.01 0.78 0.58 0.81
(0 .01) (0.03) (0 .02)
Cash Flow Components
R eturn on Sales (ROS)
“Value" Bidders 17 0.08 0.19 0.12 0.21 0.04 0.12 0.53 0.00
(0.04) (0.06) (0 .02)
“Growth" Bidders 39 0.01 0.38 0.09 0.13 0.08 1.10 0.56 0.64
Asset T u rnover (AT) (0.04) (0.04) (0.00)
“Value" Bidders 17 0.08 0.52 0.37 0.96 0.29 1.73** 0.59 0.49
(0.05) (0.03) (-0.02)
“Growth" Bidders 39 -0.12 0.83 0.13 1.14 0.25 1.94** 0.69 2.24**
(-0.22) (-0.07) (0.15)
*,**, *** indicate significance a t 1 0 5 . a n d I% sig n ifica n ce levels respectively using o n e-ta ile d test.
A . M U S LU M O V : TH E F IN A N C IA L AN A L Y S IS OF PO S T M ER G ER PERFORMANCE OF S U R V IV IN G F IR M S
TABLE 8: POSTMERGER PERFORMANCE ANALYSIS: SUMMARY OF RESULTS FROM TESTS OF PREDICTIONS FOR THE VALUE-GROWTH SUBSETS (CONTINUED)
Premerger Mean Premerger Standard Postmerger Mean Postmerger Standard Median Change Z-Statisticfor Difference in Medians (Pre-and-post-Percentage o f Firms that Changed as Chi-Square- Statistics fo r Significance o f Proportion Variables Operating Efficieny
Sales Efficiency (SALEFF)
N (Median) Deviation (Median) Deviation (Mean) merger) Predicted Change
“Value” Bidders 17 28,092 (29,755) 60,212 34,161 (44,540) 76,508 6,069 (14,785) 0.73 0.59 0.49 “Growth” Bidders EBITD Efficiency (NIEFF)
39 84,823 (23,432) 169,989 126,786 (58,474) 201,267 41,963 (35,042) 2.81*** 0.67 1.92** “Value” Bidders 17 19,131 (5,572) 34,173 20,301 (4,057) 39,931 1,170 (-1,515) 0.40 0.65 0.97 “Growth” Bidders Capital Investment
C apital E xpenditure to Sales (CESA)
39 28,915 (10,649) 46,183 40,267 (14,103) 74,301 11,352 (3,454) 2.15** 0.67 1.92** “Value” Bidders 17 -0.024 (-0.001) 0.068 -0.020 (-0.003) 0.09 0.004 (-0.002) 0.45 0.53
0.00
“Growth” BiddersCapital E xpenditure to T otal Assets (CETA)
38
0.011
(0.012) 0.040 0.002 (0.003) 0.062 -0.009 (-0.009) 0.72 0.45 0.81 “Value” Bidders 17 -0.018 (-0.008) 0.069 0.009 (0.012) 0.060 0.027 (0.020) 2.20** 0.82 2.43*** “Growth” Bidders Employment CostPension Expense per Employee (PEE)
38 0.003 (-0.006) 1.676 0.005 (-0.002) 0.054 0.002 (0.004) 1.17 0.66 1.78** “Value” Bidders 13 0.51 (0.38) 0.98 0.62 (0.69) 1.05
0.11
(0.31) 0.38 0.54 0.55 “Growth” Bidders 32 0.32 (0. 12) 1.12 0.23 (0. 11) 1.35 -0.09 (-0.01) 0.60 0.53 0.53*,**, *** indicate significance a t 10 J , a n d I % significance levels respectively using one-tailed test.
Y A P I K R E D İ E C O N O M IC R E V IE W , V O L U M E 13 . N U M B E R I , J U N E 2 0 0 2