1877-0428 © 2010 Published by Elsevier Ltd. doi:10.1016/j.sbspro.2010.03.205
Procedia Social and Behavioral Sciences 2 (2010) 1390–1394
WCES-2010
The effects of learning styles and gender on the academic
performance of interior architecture students
Halime Demirkan
a*, Ö. Osman Demirbaú
aaBilkent University, Faculty of Art, Design and Architecture,TR- 06800, Ankara, Turkey
Received October 13, 2009; revised December 22, 2009; accepted January 7, 2010
Abstract
The study focuses on design education using ‘Index of Learning Style’ (ILS) and explores the effects of learning styles and gender on the performance scores of design students. The ILS is designed to assess preferences on four scales of a learning style model formulated by Felder and Silverman (1988). The findings indicated that the usual methods of interior architecture education address a well-balanced class position in active/reflective and sensing/intuitive scales, a moderate to strong preference in visual scale and a weak preference in global scale. Furthermore, in the two-way analysis significant effects were obtained between the individual interactions of active/reflective scale with the other three scales when the academic performance score was the dependent variable.
Keywords: Academic performance; design education; gender; learning style.
1. Introduction
Design educators recently started to explore the characteristics of learning styles of students that can be used for the improvement of leaning in design (Demirbas & Demirkan, 2003; 2007; Demirkan & Demirbas, 2008; Kvan & Yunyan, 2005). Learning in a design studio involves the reception and processing of information. In the reception phase, external and internal information are available to students by the way they prefer to process. In the processing phase, Schon (1983) observed that learning in the design studio developed through a process he called ‘reflection-in-action’ and defined the role of the learner as an active practitioner. During a design process, the student transforms a given design problem into an alternative solution. This process is characterized by continual dialogue between the student and the instructor. Therefore, the most important learning experience is based on self-reflection. This is the way all design knowledge and skills are acquired in design education (Demirbas & Demirkan, 2007).
* Halime Demirkan. Tel.:+90- 312- 2901465
E-mail address: [email protected]
Procedia Social and Behavioral Sciences 2 (2010) 1390–1394
© 2010 Elsevier Ltd. Open access under CC BY-NC-ND license.
The literature suggests that design students should learn by experiencing, reflecting, thinking and doing in the process of finding solutions to assigned problems. Therefore, the previous studies are in line with the Experiential Learning Theory (ELT) of Kolb (1984). Findings related to ELT showed that the distribution of design students through learning styles was more concentrated in assimilating group with coordinates close to the centre of the two intersecting bipolar axes named as perceive and process axis that were two intersecting bipolar dimensions of the Learning Style Type Grid (Demirkan & Demirbas. 2008). Therefore, it was concluded that the design students have a balanced learning style preference.
The previous version of ‘Index of Learning Style’ (ILS) was developed by Felder and Silverman (1988) and later two significant changes were declared. The first modification in the model was eliminating the inductive/deductive dimension and the second one was changing the visual/auditory scale to visual verbal. Consequently, Felder and Soloman (2004) revised the ILS, based on their experience with engineering education that focus on four learning scales according to how a student:
1. Prefer to process information. Active learners versus reflective learners. 2. Prefer to perceive information type. Sensing learners versus intuitive learners.
3. Prefer the most effective information input channel. Visual learners versus verbal learners. 4. Progress to understand the relevant information. Sequential versus global learners.
Many studies based on different disciplines were conducted on ILS to assess reliability, factor structure and construct validity (Felder & Spurlin, 2005; Litzinger et al. 2007). These studies reported that the ILS generates data with acceptable levels of internal consistency reliability and that evidence for its construct validity. Since there is no research reported on design students related to ILS, this study aims to focus on interior architectural design education through learning style dimensions that are ‘active and reflective‘, ‘sensing and intuitive’, visual and verbal’ and ‘sequential and global’ learners. Furthermore, it explores the effects of learning styles and gender on the performance scores of design students.
2. Research questions
Several studies utilized ILS and several analyses of responses of engineering, business and science students to the ILS were published (Felder & Spurlin, 2005). This study was conducted with a sample of senior interior architecture students. An experiment was designed to answer the following questions:
1. What is the learning style distribution of senior interior architecture students in four learning scales?
2
. Are there any significant differences in the performance scores of senior interior architecture students across learning styles and gender?
3. Method
3.1. Participants
This study was conducted with a sample of 100 senior students in the Department of Interior Architecture and Environmental Design at Bilkent University. The age range was 19-27. Among the participants there were 25 males and 75 females.
3.2. Instrument
The learning styles of the senior students were determined using ‘Index of Learning Style’ (ILS) of Felder and Soloman (2004) that contains 44 items. The ILS consists of four scales, each with 11 items: active-reflective, sensing-intuitive, visual verbal, and sequential-global.
The ILS with 44 items where each item contains a sentence that can be answered form choosing one of two options representing opposite end of one of the learning style. This dichotomous structure was chosen to force a decision between the two alternatives. In this way, the ILS can detect the preference in learning style. According to ILS (Litzinger et al, 2005), the polarity of a scale depends on the score from 1 to 11 located on each scale. If the
score on a scale is 1-3, it is fairly well balanced on the two dimensions of that scale. If the score on a scale is 5-7, there is a moderate preference for one dimension of the scale. If the score on a scale is 9-11, there is a very strong preference for one dimension of the scale.
4. Results
4.1. Learning style distribution of students
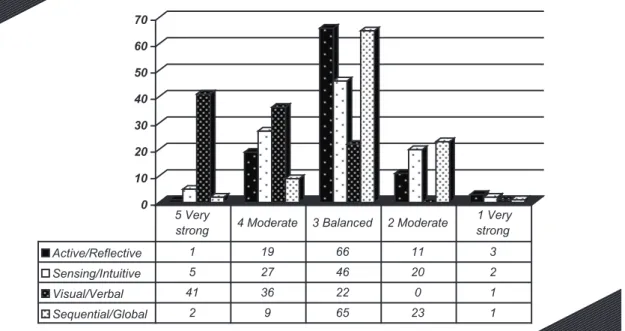
Using the ILS, the distribution of senior students according to the four scales with the relevant scores was determined (Figure 1). Since each scale is considered to be bipolar dimensions, weight is assigned to each category in order to determine the position of the senior class on each scale. The mean score for active/reflective learners is 3.04 for sensing/intuitive learner is 3.13, for visual/verbal learners is 4.16 and for sequential/ global learners is 2.88. The class position in for active/reflective, sensing/intuitive and visual/verbal learners to be above 3 shows the students are in favour of the active, sensing and visual preferences. As sequential/ global learners with a mean score 2.88, they are in favour of global preference.
Figure 1. Senior class classification according to ILS
A one-way correlated analysis of variance showed a significant learning style effect for the four learning scales (F3,97= 57.77, p<0.001). Since the p value is less than 0.001, it can be concluded there is a statistical significant
difference in the mean scores of the four learning scales. 4.2. Learning style characteristics according to gender
Using the ILS, the distribution of gender of senior students through the four learning scales with the relevant scores was determined (Table 1). Also, the senior class mean for each scale with respect to gender was depicted.
0 10 20 30 40 50 60 70 Active/Reflective 1 19 66 11 3 Sensing/Intuitive 5 27 46 20 2 Visual/Verbal 41 36 22 0 1 Sequential/Global 2 9 65 23 1 5 Very
strong 4 Moderate 3 Balanced 2 Moderate
1 Very strong
Table 1. The distribution of gender through learning scales Weight 5 Very strong 4 Moderate 3 Balanced 2 Moderate 1 Very strong Mean F M F M F M F M F M F M Active 0 1 13 6 49 17 11 0 2 1 Reflective 2.97 3.24 Sensing 3 2 20 7 33 13 18 2 1 1 Intuitive 3.08 3.28 Visual 31 10 28 8 15 7 0 0 1 0 Verbal 4.17 4.12 Sequential 1 1 6 3 48 17 19 4 1 0 Global 2.83 3.04
In this study, there was no significant relationship between gender and the learning scales (two-tailed Fischer exact p=0.24 for active/reflective; p=0.64 for sensing/intuitive; p=0.37 for visual/verbal and p=0.16 for sequential/ global learners).
4.3. Relationship of academic performance scores to learning scale
A student’s academic performance is represented by the cumulative grade point average (CGPA) of that student. The highest point for CGPA is 4.00. The analysis was done according to the classification of successful (with CCPA greater than 2.00) or unsuccessful students (with CGPA less than 2.00). In this study, it was found that there was no significant relationship between academic performance score (CGPA) and the learning scales (two-tailed Fischer exact p = 0.56 for active/reflective; p = 0.14 for sensing/intuitive; p = 0.69 for visual/verbal and p = 0.26 for sequential/ global learners).
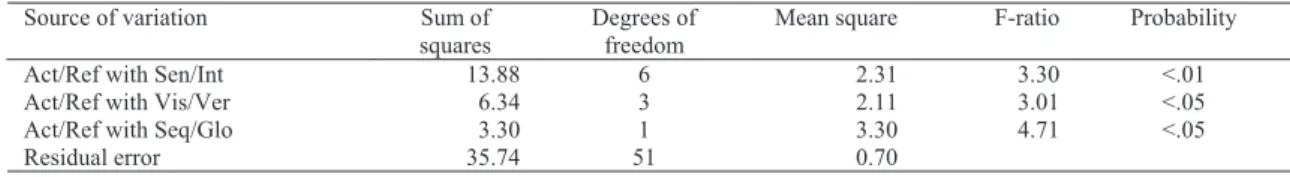
When the academic performance scores of students were the dependent variable and the four learning scales and gender were the independent variables, a two-way analysis of variance showed that significant effects were obtained between active/reflective and sensing /intuitive (F= 3.30, p = 0.01), active/reflective and visual/verbal (F= 3.02, p = 0.04) and active/reflective and global/sequential (F= 4.71, p = 0.04) interactions, but not on academic performance scores (CGPA) or gender as well as the interactions among the other learning scales. This shows that the active/reflective scale is the most dominant one in design education (Table 2).
Table 2. Analysis of variance (tests of between-subjects effects) summary table Source of variation Sum of
squares
Degrees of freedom
Mean square F-ratio Probability Act/Ref with Sen/Int 13.88 6 2.31 3.30 <.01 Act/Ref with Vis/Ver 6.34 3 2.11 3.01 <.05 Act/Ref with Seq/Glo 3.30 1 3.30 4.71 <.05 Residual error 35.74 51 0.70
5. Discussion and Conclusion
According to ILS, the usual methods of interior architecture education address a well- balanced class position in active/reflective (mean = 3.04) and sensing/intuitive (mean= 3.13) scales. A moderate to strong preference in visual scale (mean= 4.16) and a weak preference in global scale (mean = 2.88) are observed. The sensing/ intuitive scale is similar to perceive dimension and the active/reflective scale is similar to process dimension of Kolb (1984). The findings of this study also support the previous works of the authors based on ELT of Kolb (Demirbas & Demirkan, 2003, 2007; Demirkan & Demirbas, 2008) who found design students have a balanced learning style preference by being at a coordinate closer to the intersection of process and perceive axes of the Learning Style Type Grid.
The most important tool of a designer is sketching which is an outcome of a mental imagery process (Demirkan & Hasirci, 2009). Sketches quicken the design process, improve the solutions greatly and aid the restructuring of the design problem that has been given in design studio process. Therefore, design students are used to visual sensory information and effectively perceive pictures, diagrams, films and demonstrations. Also, Demirkan and Demirbas
(2008) reported in their study based on ELT of Kolb, the students are at the abstract conceptualization end of the perceive axis and do not rely on their feelings.
The sequential/global scale that shows how a student progress to understand the relevant information showed that although the students have a balanced approach their preference is in the global scale part. Also, this may be a reflection of design education that teaches students to build a mental imagery of the final design solution before sketching.
In this study, it is found that learning styles and gender were independent for design students on all scales. This study provides further empirical support for the previous study of Demirbas and Demirkan (2007). The two-way analysis of variance showed that significant effects were obtained between active/reflective and sensing/intuitive, active/reflective and visual/verbal and active/reflective and global/sequential interactions when the academic performance scores were the dependent variable. These findings emphasize that active/reflective scale is the most dominant scale in design education. This is the scale that Schon (1984) called as the ‘reflection-in-action” process in design studio and Kolb (1984) named as the ‘process dimension’ of learning. This points out the importance of the learning process in design education.
Therefore, the design education should provide the opportunity to employ different learning scales. The important point is to provide various learning experiences that emphasize different learning scales during design process. The goal of this research is to ensure that design instructors can relate learning scales to the specific conditions during the design process. Furthermore, increasing design instructors awareness in learning scales might lead to increase flexibility of teaching styles and enhance communication between instructors and design students.
References
Demirbas, O.O. & Demirkan, H. (2003). Focus on architectural design process through learning styles. Design Studies, 24, 437-456.
Demirbas, O.O. & Demirkan, H. (2007). Learning styles of design students and the relationship of academic performance and gender in design education. Learning and Instruction, 17, 345-359.
Demirkan, H. & Demirbas, O.O. (2008). Focus on the learning styles of freshman design students. Design Studies, 29, 254-266.
Demirkan, H. & Hasirci, D. (2009). Hidden dimensions of creativity elements in design process.Creativity Research Journal, 21, 294-301. Felder, R. M. & Silverman, L.K. (1988). Learning and teaching styles in engineering education. Engineering Education, 78, 674-681. Felder, R. M. & Soloman, B.A. (2004). Index of learning styles, http:// www.ncsu.edu/felder~public/ILSpage.html, accessed June 12, 2009. Felder, R. M. & Spurlin, J. (2005). Reliability and validity for the index of learning styles: A meta-analysis. International Journal of Engineering
Education, 21, 103-112.
Litzenger, T.A., Lee, S.H., Wise, J.C. & Felder, R. M. (2007). A psychometric study of the index of leaning styles, Journal of Engineering
Education, 96, 309-319.
Kolb, D. A. (1984). Experiential learning: experience as the source of learning and development. Englewood Cliffs: NJ Prentice Hall.
Kvan, T. and Yunyan, J. (2005). Students' learning styles and their correlation with performance in architectural design studio. Design Studies, 26, 19-34.
Schon, D. A. (1983). The reflective practitioner how professionals think in action. Basic Books / Harper Collins.