Tar. Bil. Der. Dergi web sayfası:
www.agri.ankara.edu.tr/dergi www.agri.ankara.edu.tr/journalJournal homepage:
TARIM BİLİMLERİ DERGİSİ
—
JOURNAL OF AGRICUL
TURAL SCIENCES
19 (2013) 297-309
Irrigation and Yield Parameters of Soybean as Effected by Irrigation
Management, Soil Compaction and Nitrogen Fertilization
Halil KIRNAKa, Ergün DOĞANb, Osman ÇOPURc, Zeki GÖKALPa
a Erciyes University, Faculty of Agriculture, Department of Biosystems Engineering, Kayseri, TURKEY bİnonü University, Faculty of Agriculture, Department of Biosystems Engineering, Malatya, TURKEY
c Harran University, Faculty of Agriculture, Department of Field Crops ,Şanlıurfa, TURKEY
ARTICLE INFO
Research Article — Agricultural Technologies
Corresponding Author: Zeki GÖKALP, E-mail: [email protected], Tel: +90 (352) 621 79 89 Received: 28 May 2013, Received in Revised Form: 19 September 2013, Accepted: 25 September 2013
ABSTRACT
Irrigation parameters (reference crop evapotranspiration, actual plant water use, amount of irrigation water, water use efficiency, irrigation water use efficiency, plant water consumption coefficient, variations in soil moisture based on plant water consumption-amount of irrigation water) and yield parameters (seed yield, 1000-kernel weight, harvest index) were investigated for soybean grown in Harran Plain under conventional every-furrow and alternate-furrow irrigation management systems, three different compaction levels (control without compaction, low compaction, high compaction) and three different nitrogen levels (6, 9, 12 kg da-1). Experiments were carried out during 2006 and 2007
cropping seasons in Şanlıurfa, Turkey in split-split plots experimental design with 3 replications. Irrigation program was created by KanSched simulation model. The amount of applied irrigation water in conventional and alternate furrow systems in 2006 and 2007 were measured as 435.61 and 291.59 mm, and 429.51 and 271.72 mm, respectively. ET values decreased with increasing compaction levels. The highest ET value (568 mm) was observed in non-compacted control treatment and the lowest value (240 mm) in high-compaction treatment. Irrigation water use efficiency increased with decreased irrigation water and the values were higher than water use efficiencies. While the highest yield (94.78 kg da-1)
was observed in control treatment of the year 2006, conventional furrow system had the highest yield (209.93 kg da-1)
in the year 2007. While effects of compaction and irrigation on harvest index were insignificant, nitrogen doses were found to be significant. Results revealed that KanSched irrigation model could be used for irrigation scheduling but plant coefficients to be used in the model should be determined properly based on climate conditions. Negative impacts of soil compaction in agricultural fields due to traffic and various other reasons can be eliminated with proper irrigation and fertilization implementations. However, yield losses at high-compaction levels may reach up to 45%.
Keywords: Irrigation management; Alternate furrow irrigation; Soil compaction; Soybean; Nitrogen level
Sulama Yönetimi, Toprak Sıkışması ve Azot Uygulamalarının Soya
Fasulyesi Sulama ve Verim Parametreleri Üzerine Etkileri
ESER BİLGİSİ
Araştırma Makalesi — Tarım Teknolojileri
Sorumlu Yazar: Zeki GÖKALP, E-mail: [email protected], Tel: +90 (352) 621 79 89 Geliş Tarihi: 28 Mayıs 2013, Düzeltmelerin Gelişi: 19 Eylül 2013, Kabul: 25 Eylül 2013
1. Introduction
Soil and water resources preservation, development and service for the benefit of public and sustainable agricultural policies are the critical issues in today’s world. Limited water resources, recent global warming and climate change bring optimum water use into the forefront especially in arid and semi-arid regions (Çakmak et al 2007). Increasing domestic and industrial water demands enforce fresh-water users to use water efficiently. Fresh-water resources are mostly allocated to agricultural sector (around 70%) especially for irrigations (Aküzüm et al 2010). Therefore, efficient water use should initially be pointed out in agricultural sector. Surface irrigation is the oldest and most widely used method for irrigating agricultural lands across the world (FAO 2012). Water use efficiencies of surface irrigation methods are significantly low in case of improper or insufficient field preparations.
Furrow irrigation is suitable for many row crops such as maize, sunflower, sugarcane, and soybean. Depending on available flow in the farm channel,
several furrows can be irrigated at the same time. When there is a water shortage, it is possible to limit the amount of applied irrigation water by using “alternate furrow irrigation”. This involves irrigating every other furrow rather than every furrow (Graterol et al 1993).
According to Redford et al (2007) compaction-induced soil degradation affects about 68 million ha land area globally, principally as a result of
vehicular traffic. Soil compaction usually occurs
due to surface activities (improper tillage machinery or tillage at improper moisture conditions). Compaction decreases porosity by moving soil particles close together and consequently limits air-water movement through soil column and decreases water holding capacity of soils (Motavalli et al 2003). Infiltration, drainage and root development also negatively affect plant growth in compacted soils (Van Ouwerkerk & Soane 1994; Soane & Van Ouwerkerk 1995). Plant growth slows down and yield loses are observed in such cases (Williamson & Neilsen 2003; Czyz & Tomaszewka 2004). Transition from dry farming to irrigated ÖZET
Bu çalışmada, Harran Ovası koşullarında yetiştirilen ikinci ürün soyada sürekli ve alternatif karık işletim biçimine göre sulanan, üç farklı sıkışma düzeyinde (kontrol, düşük sıkışma ve yüksek sıkışma) ve üç farklı azot seviyesinde (6, 9, 12 kg da-1) sulama parametreleri (referans bitki su tüketimi, gerçek bitki su tüketimi, sulama suyu miktarı, su kullanım
etkinliği, sulama suyu kullanım etkinliği, bitki su tüketim katsayısı, toprak neminde bitki su tüketimi-sulama suyu miktarına ve toprak sıkışmasına bağlı değişim) ve verim parametreleri (tohum verimi, 1000-dane ağırlığı, hasat indeksi) araştırılmıştır. Denemeler Şanlıurfa’da bölünen bölünmüş parseller deneme desenine göre 3 tekerrürlü olarak 2006 ve 2007 üretim yıllarında yürütülmüştür. Sulama programı KanSched simülasyon modeline göre yapılmıştır. Sürekli ve alternatif karık sulama işletim biçimine göre sulanan bitkilerde uygulanan sulama suyu miktarı sırayla 2006 yılı için 435.61 ve 292.59 mm, 2007 yılı için ise sırayla 429.51 ve 271.72 mm olarak ölçülmüştür. ET değerleri artan toprak sıkışıklığıyla birlikte azalmış, en yüksek ET değeri 568 mm ile kontrol konusundan elde edilirken en düşük ET değeri 240 mm ile yüksek sıkışma konusundan elde edilmiştir. Sulama suyu kullanım etkinliği uygulanan su azaldıkça artmıştır ve elde edilen değerler su kullanım etkinliği değerlerinden daha yüksek bulunmuştur. 2006 yılında en yüksek tohum verimi 94.78 kg da-1 ile kontrol konusunda, 2007 yılında ise 209.93 kg da-1 ile sürekli karık konusunda elde edilmiştir.
Deneme sonuçları KanSched sulama modelinin sulama zamanı ve miktarının belirlenmesinde kullanılabileceğini fakat modelde kullanılacak bitki katsayılarının iklim koşullarına uygun olarak belirlenmesi gerektiğini göstermiştir. Çalışma sonuçları aynı zamanda tarım topraklarında trafikten veya başka sebeplerle meydana gelen toprak sıkışmasının etkilerinin iyi bir sulama programı ve gübreleme ile azaltılabileceğini ortaya koymuştur. Ancak, yüksek sıkışma oranlarında verim kayıpları % 45 seviyelerine kadar çıkabilir.
Anahtar Kelimeler: Sulama yönetimi; Alternatif karık sulama; Toprak sıkışması; Soya; Azot düzeyi
farming in Southeastern Anatolia Project ( GAP) region remarkably increased the machinery-use in agricultural activities of the region. Such intensive traffic resulted in soil compaction.
Soybean, with its high protein content, is a significant crop in human nutrition, animal feeding and several other industrial sectors. It contains in average 36% protein, 18% oil, 20% carbohydrate, 5% mineral and 1% lecithin. Soybean is a leguminous crop able to fixate the free atmospheric nitrogen into soil and enriches soil texture with plant nutrients (Arıoğlu 1990). Soybean, usually preferred as second crop after wheat in GAP region, is most of the time irrigated with furrow irrigation.
In present study, effects of irrigation management systems, soil compaction and nitrogen fertilization treatments on irrigation and yield parameters of soybean grown as the second crop in GAP Region were investigated.
2. Material and Methods
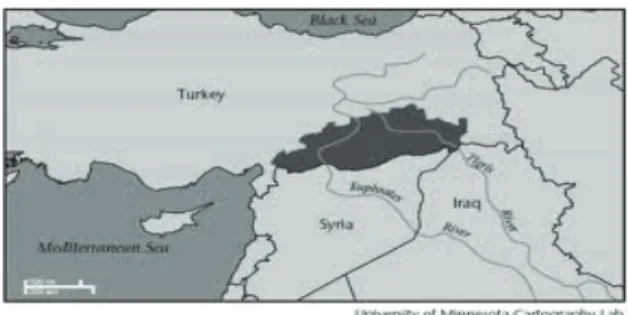
Field experiments were carried out at Agricultural Experimental Station of Şanlıurfa Directorate of Rural Affairs during the years 2006 and 2007. The research site is located at 36º42’ north latitudes and 38º56’ east longitudes and has an average altitude of 400 m (Figure 1).
Figure 1- Research site Şekil 1- Araştırma sahası
Soybean cultivar “Nova” was used as plant material of the experiments. It has significantly high-yield potential under Harran Plain conditions. Disturbed and undisturbed soil samples were taken from 0-150 cm soil layers at 30 cm intervals. Soil samples were subjected to physical (field capacity, permanent wilting point, bulk density, soil texture) and chemical (organic matter, lime, available phosphorus, potassium and nitrogen contents) analyses in accordance with the principles specified in Tüzüner et al (1990). Experimental soils are included in Harran Soil-Series. The soil texture is clay with a field capacity of between 31.55-32.84%, permanent wilting point of between 21.53-23.11% and available water holding capacity of 163 mm/120 cm. Lime content reaches up to 30-49% through the inner layers (Table 1).
Table 1- Physical and chemical soil characteristics of soil of the experimental site Çizelge 1- Deneme sahası topraklarının fiziksel ve kimyasal özellikleri
Soil layer (cm) Density(g cm-3) Texture Organic Matter (%) CaCO3 (%) pH (kg haN -1) (kg haP2O5-1) (kg haK2O-1) (% Pw)FC (% Pw)PWP 0-30 30-60 60-90 90-120 1.37 1.40 1.43 1.42 Clay Clay Clay Clay 1.63 1.40 1.25 1.15 15.8 26.2 33.0 38.2 7.3 7.2 7.2 7.2 25 12 6 -27 20 17 -1280 900 810 -31.55 31.80 32.80 32.84 22.15 22.60 21.53 23.11
FC, field capacity; PWP, permanent wilting point
With regard to climate conditions, long-term averages indicate a semi-arid dry climate for the research site with an annual average temperature of 18.1 ºC, precipitation of 385.5 mm, annual
total evaporation of 2000 mm and average relative humidity of 40%. Long-term averages and the averages during plant growth periods are given in Table 2.
Irrigation water was supplied from an irrigation canal nearby. Irrigation water analyses (electrical conductivity, pH, anion and cation contents) were also performed in accordance with Tüzüner et al (1990). Quality parameters of irrigation water are presented in Table 3.
Soybean was sown as a second crop after wheat in both years. Soil was tilled with a cultivator at a medium depth just after wheat harvest and harrowed to obtain a flat seed-bed. Seeding was performed
on 17th of July in 2006 and on 20th of June in 2007
with a pneumatic planter as to put 90 kg seeds per hectare. Experiments were performed over a total of 54 plots (3 compaction levels x 2 irrigation managements x 3 nitrogen doses x 3 replications = 54) in split-split plot experimental design with 3 replications. Compaction levels were placed in main plots, irrigation management systems placed in subplots and nitrogen doses were placed in sub-subplots. Furrow length was 75 m, row spacing was 70 cm and on-row plant spacing was 3-5 cm. Effects of years on both irrigation and yield parameters Table 2- Climate characteristics
Çizelge 2- İklim özellikleri
Parameter June July August September October
Long-Term Minimum temperature (ºC) Maximum temperature (ºC) Average temperature (ºC) Precipitation (mm) Relative humidity (%) Wind speed (m s-1) Evaporation, CAP (mm) 9.4 45.4 28.0 2.5 35 2.5 322.7 11.0 46.8 31.4 0.1 33 2.6 385.0 10.2 46.7 30.4 -36 2.1 368.4 8.4 44.0 26.6 0.1 34 1.5 275.7 0.7 37.4 18.3 23.7 43 1.0 160.1 Growth Season (2006) Minimum temperature (ºC) Maximum temperature (ºC) Average temperature (ºC) Precipitation (mm) Relative humidity (%) Wind speed (m s-1) Evaporation, CAP (mm) 12.9 39.3 27.9 0 39.9 2.0 293 15 42.5 30 0 43 2.2 273 15 41.8 28.2 0 45.2 1.4 225 10.7 37.8 24.3 0 40.7 1.2 171 0.2 34.1 19.4 18.1 51.2 1.1 110 Growth Season (2007) Minimum temperature (ºC) Maximum temperature (ºC) Average temperature (ºC) Precipitation (mm) Relative humidity (%) Wind speed (m s-1) Evaporation, CAP (mm) 13.4 44.3 23.8 0 40.8 1.9 295 18.0 43.0 30.8 0 45.5 2.0 281 18.5 44.5 32.5 0 44.6 1.5 215 11.0 38.8 24.8 0 40.5 1.1 180 0.3 34.1 18.1 12.5 54 1.0 100
Table 3- Irrigation water characteristics Çizelge 3- Sulama suyu özellikleri
Source (dS mEC-1) Na+ K+CationsCa+++Mg++ CO Anions pH SAR Class
3= HCO3- Cl- SO4=
were not statistically analyzed since the sowing was performed almost one month earlier in the year 2006. Therefore, treatments were not subjected to similar conditions in similar times. A 3 m spacing was provided between experimental plots to prevent the water ins and outs to plots. Plant emergences completed at the end of second week from the sowing. Following a proper emergence, plots were created. Sprinkler irrigation was performed 4 times in the year 2006 (85 mm) and 6 times in the year 2007 (75 mm) from sowing to initiation of planned irrigation program to prevent water stress on plants. When the plants reached to a height of 8-10 cm, manual thinning was performed as to have 3-5 cm on-row spacing. A manual hoeing and 2 times machinery hoeing was performed for weed control before the initiation of experimental treatments.
As a base fertilizer, 60 kg pure P2O5 (42-44%
TSP) per hectare was applied to experimental plots just before sowing. Since the experimental soils had high potassium contents, potassium was not applied as base fertilizer. Also, 60 kg pure N (33% ammonium nitrate) per hectare was applied with sowing. Specified nitrogen doses were applied to plots and furrows were formed at first blooms. Three different nitrogen doses (N1 = 6, N2 = 9, N3
= 12 kg da-1) were used in this research. Since the
total amount to be applied to N1 plots was given with sowing, fertilization was not implemented in these plots. At first blooms, soil compactions were performed and soil moisture meter probes (PR2-profile probe, Delta-T, UK) were placed into soil for moisture observations throughout the cropping season. The soil probe measures soil moisture at 6 depths down to 120 cm. Three compaction levels were applied to furrows as of 1) non-compacted (control, C), 2) low-compaction (LC) and 3) high-compaction (HC). Soil high-compaction was created by a tractor with 4 passes for LC and 12 passes for HC. The tractor used was a 50 kW two wheel drive (2WD) with a weight of 3 Mg (1 and 2 Mg on the front and rear axles, respectively) and 6.5×20 front and 13.6×36 rear tires. Tire inflation pressure was 220 kPa in front and 140 kPa in rear tires. The speed
of the tractor was 5.0 km h-1. Tire/soil contact area
of the rear tire was 0.145 m2 and ground pressure
was 65 kPa. The tire/soil contact area was measured by a procedure mentioned in Botta et al (2004) and Botta et al (2006).
Two different irrigation management practices were applied for surface irrigation methods as of alternate furrow (AF) and conventional furrow (CF). In alternate furrow irrigation, a furrow was irrigated and adjacent furrow was left non-irrigated. In conventional furrow irrigation, every furrow was irrigated. Furrow ends were closed and runoffs were prevented in both furrow management systems. Irrigation programs were implemented at
the end of flowering period. Equal flow (0.8 L s-1)
was provided to each furrow. Irrigation program was created by using a software called “KanSched simulation model” (Clark et al 2002). This model was developed at Kansas State University and it is mostly used for irrigation scheduling and to determine the amount of irrigation water to be applied. Daily ET values were calculated by using meteorological data (temperature, relative humidity, solar radiation, wind speed) and these values were used to create irrigation program by KanSched model. The model calculates reference plant water consumptions by using FAO Penman-Monteith equation. A mobile climate station was placed within research site for proper operation of irrigation program and climate data were gathered throughout the experiments. Irrigations were provided as to bring the soil moisture levels to field capacity each time. The moisture deficit was measured by moisture profile-meter placed into soil.
Soil moisture measurements were taken by soil moisture meter (profile-meter) placed into 120 cm soil depth at sowing, before each irrigation and at harvest. Actual water consumption of soybean was calculated by using water-budget equation given below:
ET = I + P – D ± R ± Δs (1)
Where; ET, evapotranspiration (mm); I, irrigation water (mm); P, precipitation (mm); D, deep percolation (mm); R, runoff (mm); Δs, soil moisture variation between two sampling (mm).
Since the amount of water applied was set as the amount needed to bring soil moisture level to field capacity, deep percolation was taken as zero and runoff was also taken as zero since closed furrows were used. Capillary rise was not also taken into consideration since there were not any groundwater problems in the field. Water use efficiencies were determined by using the equations below given in Howell & Tolk (1998);
WUE = (Ey/ ET) x 100 (2)
IWUE = (Ey / I ) x 100 (3)
Where; WUE, water use efficiency; IWUE, irrigation water use efficiency; Ey, economic yield
(kg da-1); ET, plant water consumption (mm); I,
irrigation water (mm).
Hand-harvesting was performed during the last week of October in both years. Harvest time was
determined by visual inspections like abscission of most of the leaves and browning of pods. There were 5 rows in each plot and yield from middle three rows were considered. Also 3 m strips were omitted to eliminate side effects. 1000-seed weight was also determined. Harvest index was calculated by dividing unit area seed yield with unit area dry matter yield.
3. Results and Discussion
3.1. Irrigation parametersReference crop (green grass) evapotranspiration calculated based on Penman-Monteith method (ET0 P-M) and soybean water consumption values
simulated by KanSched model (ETa-KanSched)
of both years are presented in Figure 2. Water
(a) (a)
(b) (b)
(2006) (2007)
Figure 2-Reference crop water consumption (ET0 P-M) and model simulated water consumption (ETa -KanSched): a) conventional furrow b) alternate furrow
Şekil 2-Referans bitki su tüketimi (ET0 P-M) ve modelle simüle edilen bitki su tüketimi (ETa-KanSched) a) Sürekli karık b) Alternatif karık
consumptions increased with vegetative growth of plants and decreased with generative development and toward the harvest. Simulation model yielded plant water consumptions of 1.0-7.0 and 1.06-6.71 mm day-1 respectively for conventional and alternate
furrow irrigation systems of the year 2006 and 0.31-6.40 and 1.0-5.5 mm day-1 for the year 2007.
While water consumptions calculated with
KanSched model (ETa-KanSched) were found to
be higher than reference plant water consumptions
(ET0 P-M) in conventional furrows, ETa-KanSched
values of alternate furrows were lower than ET0
P-M values especially during pod-set and grain formation periods. Insufficient water supply in alternate furrows may have caused such low values.
ET0 P-M values of initial stage were significantly
higher than ETa-KanSched values.
Total ET0 P-M value for the entire growth season
of soybean from seeding to harvest was calculated as 461.77 and 550.03 mm respectively for the years
2006 and 2007. While the ETa-KanSched values
of conventional furrows were calculated as 367.52 and 440.27 mm respectively for the years 2006 and 2007, the values in alternate furrows were 294.96 and 309.76 mm, respectively for the years 2006 and 2007.
Amount of applied irrigation water was measured as 435.61 and 291.59 mm respectively in conventional and alternate furrows of the year 2006 and as 429.51 and 271.72 mm in the year 2007. Cumulative irrigation water and cumulative
ET0 P-M values of the years 2006 and 2007 are
presented in Figures 3. (a) (a) (b) (b) (2006) (2007)
Figure 3-Cumulative irrigation and plant water consumption: a) conventional furrow b) alternate furrow Şekil 3- Yığışımlı sulama suyu ve bitki su tüketimi a) Sürekli karık b) Alternatif karık
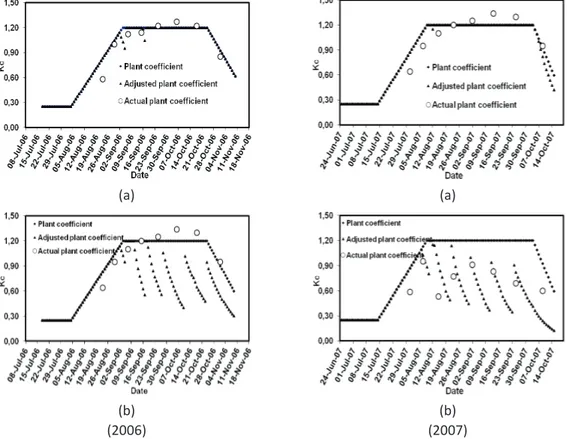
Daily water consumption coefficients used by KanSched model are presented in Figure 4. The values varied between 0.25 and 1.20. Plant water consumption coefficients decreased toward the harvest and ended at 0.75 in the year 2006 and at 0.60 in the year 2007. The Kc coefficients in alternate furrows significantly decreased at mid-season due to water stress and decreased up to 0.45 and 0.12 respectively in the years 2006 and 2007. An adjustment was made in KanSched Kc coefficient when the soil moisture went down below MAD (Maximum Allowed Depletion) value.
Actual plant Kc coefficients were calculated by using actual ET values calculated with water budget equation. While average actual Kc coefficient in conventional furrows of the year 2006 was 0.91, adjusted Kc value calculated by simulation model
was found to be 0.87. The actual value in alternate furrow system of the year 2006 was 0.94 and adjusted value was 0.65. In the year 2007, actual Kc coefficient in conventional furrow system was found to be 1.10 and adjusted value calculated by the model was 0.90. The actual value in alternate furrow system of the year 2007 was 0.70 and adjusted value was 0.57. Previous studies reported water consumption of soybean as between 450-700 mm based on water stress levels (Khan et al 2003; Öz 2008; Şimşek et al 2001). Although control treatments of present study had parallel results with those studies, there were some differences due to location, climate, cultivar and the most importantly irrigation program.
Variations in soil moisture content based on seasonal plant water consumption and applied
(a) (a)
(b) (b)
(2006) (2007)
Figure 4-Variation of plant water consumption coefficients a) conventional furrow b) alternate furrow Şekil 4-Bitki su tüketim katsayılarının değişimi a) Sürekli karık b) Alternatif karık
irrigation water are presented in Figure 5. A water stress was not observed in conventional furrow system since moisture levels were between FC and MAD. However, soil moisture levels in alternate furrow system went below the MAD value.
The furrows irrigated by conventional system were taken into consideration while creating irrigation programs and the same amount of irrigation water calculated by the model for conventional furrows was also supplied to alternate furrows. While deficit moisture was brought to field capacity in each irrigation of conventional furrows, moisture levels of alternate furrows varied between
MAD and PWP since the wetted area in alternate system was 50% less than conventional system.
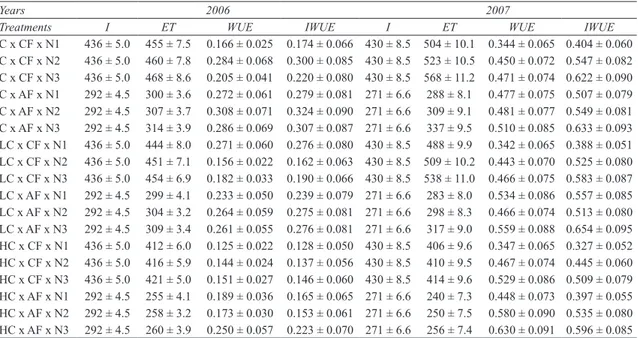
The ET and water-use efficiency values calculated by using water budget equation are provided in Table 4. While the highest ET value (568 mm) was observed in non-compacted treatment of the year 2007, the lowest value (240 mm) was seen in high-compaction treatment again of the year 2007. ET values increased with increasing nitrogen doses. A decrease was observed in ET with the level of compaction.
IWUE values were higher than WUE values in all treatments except for high-compaction
(a) (a)
(b) (b)
(2006) (2007)
Figure 5-Variation of soil moisture levels: a) conventional furrow b) alternate furrow) Şekil 5-Toprak nemi değişimi a) Sürekli karık b) Alternatif karık
cases. While the highest WUE (0.630 kg da-1
mm-1) value was observed in a high-compaction
case (HC-AF-N3) in 2007, the highest value in 2006
(0.308 kg da-1 mm-1) was seen in a non-compacted
treatment (C-AF-N2). WUE and IWUE values in C-CF-N2 treatment of the year 2007 were measured
as 0.45 and 0.547 kg da-1 mm-1, the values in
HC-CF-N2 treatment realized as 0.467 and 0.445 kg
da-1 mm-1 respectively. WUE and IWUE values of
the year 2006 were respectively measured as 0.284
and 0.300 kg da-1 mm-1 in C-CF-N2 and as 0.467
and 0.445 kg da-1 mm-1 in HC-CF-N2 treatment.
Such results revealed that a proper fertilization and irrigation program may increase water use efficiency of soybean. IWUE values increased with decreasing irrigation water application rates. The difference between IWUE and WUE values may come from the use of stored water in soil since there was not any precipitation during the experiments. Under high compaction and water-stress conditions, evapotranspiration losses due to high solar radiation
and temperature should be reduced to increase water use efficiency.
Redford et al. (2001) explained the reduced corn grain yield due to reduced soil water storage and WUE. Present findings comply with such results. However, current results also showed that increasing nitrogen doses could eliminate or mitigate the effects of traffic wheel compaction.
3.2. Yield parameters
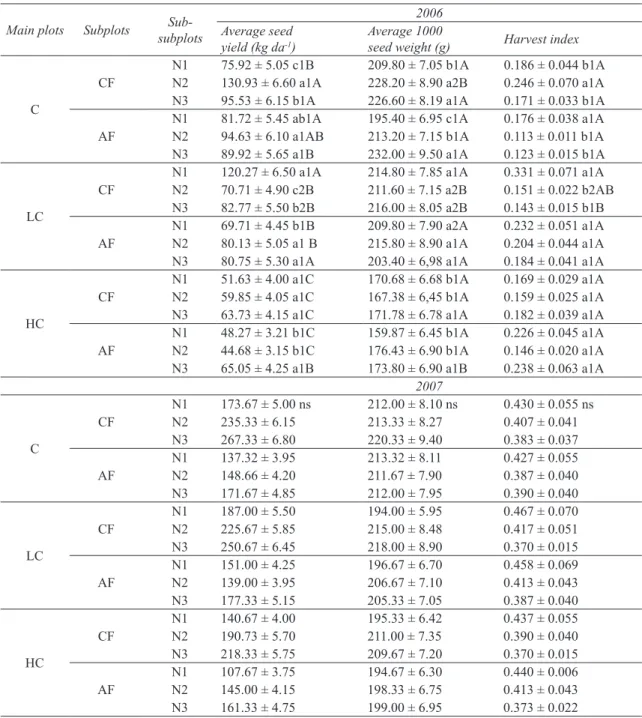
Yield parameters (seed yield, 1000-seed weight and harvest index) of compaction, irrigation and fertilization treatments were provided in Table 5. During the year 2006, effects of compaction, irrigation and nitrogen doses on seed yield were found to be significant (p<0.05) in interactions. While the highest seed yield (130.93 kg da-1) of
the year 2006 was observed in non-compacted-conventional furrow-normal nitrogen (C-CF-N2) treatment, the lowest value (44.68 kg da-1) was
seen in high-compaction-alternate furrow-normal Table 4- Water use and irrigation water use efficiencies
Çizelge 4- Su kullanım ve sulama suyu kullanım etkinlikleri
Years 2006 2007
Treatments I ET WUE IWUE I ET WUE IWUE
C x CF x N1 436 ± 5.0 455 ± 7.5 0.166 ± 0.025 0.174 ± 0.066 430 ± 8.5 504 ± 10.1 0.344 ± 0.065 0.404 ± 0.060 C x CF x N2 436 ± 5.0 460 ± 7.8 0.284 ± 0.068 0.300 ± 0.085 430 ± 8.5 523 ± 10.5 0.450 ± 0.072 0.547 ± 0.082 C x CF x N3 436 ± 5.0 468 ± 8.6 0.205 ± 0.041 0.220 ± 0.080 430 ± 8.5 568 ± 11.2 0.471 ± 0.074 0.622 ± 0.090 C x AF x N1 292 ± 4.5 300 ± 3.6 0.272 ± 0.061 0.279 ± 0.081 271 ± 6.6 288 ± 8.1 0.477 ± 0.075 0.507 ± 0.079 C x AF x N2 292 ± 4.5 307 ± 3.7 0.308 ± 0.071 0.324 ± 0.090 271 ± 6.6 309 ± 9.1 0.481 ± 0.077 0.549 ± 0.081 C x AF x N3 292 ± 4.5 314 ± 3.9 0.286 ± 0.069 0.307 ± 0.087 271 ± 6.6 337 ± 9.5 0.510 ± 0.085 0.633 ± 0.093 LC x CF x N1 436 ± 5.0 444 ± 8.0 0.271 ± 0.060 0.276 ± 0.080 430 ± 8.5 488 ± 9.9 0.342 ± 0.065 0.388 ± 0.051 LC x CF x N2 436 ± 5.0 451 ± 7.1 0.156 ± 0.022 0.162 ± 0.063 430 ± 8.5 509 ± 10.2 0.443 ± 0.070 0.525 ± 0.080 LC x CF x N3 436 ± 5.0 454 ± 6.9 0.182 ± 0.033 0.190 ± 0.066 430 ± 8.5 538 ± 11.0 0.466 ± 0.075 0.583 ± 0.087 LC x AF x N1 292 ± 4.5 299 ± 4.1 0.233 ± 0.050 0.239 ± 0.079 271 ± 6.6 283 ± 8.0 0.534 ± 0.086 0.557 ± 0.085 LC x AF x N2 292 ± 4.5 304 ± 3.2 0.264 ± 0.059 0.275 ± 0.081 271 ± 6.6 298 ± 8.3 0.466 ± 0.074 0.513 ± 0.080 LC x AF x N3 292 ± 4.5 309 ± 3.4 0.261 ± 0.055 0.276 ± 0.081 271 ± 6.6 317 ± 9.0 0.559 ± 0.088 0.654 ± 0.095 HC x CF x N1 436 ± 5.0 412 ± 6.0 0.125 ± 0.022 0.128 ± 0.050 430 ± 8.5 406 ± 9.6 0.347 ± 0.065 0.327 ± 0.052 HC x CF x N2 436 ± 5.0 416 ± 5.9 0.144 ± 0.024 0.137 ± 0.056 430 ± 8.5 410 ± 9.5 0.467 ± 0.074 0.445 ± 0.060 HC x CF x N3 436 ± 5.0 421 ± 5.0 0.151 ± 0.027 0.146 ± 0.060 430 ± 8.5 414 ± 9.6 0.529 ± 0.086 0.509 ± 0.079 HC x AF x N1 292 ± 4.5 255 ± 4.1 0.189 ± 0.036 0.165 ± 0.065 271 ± 6.6 240 ± 7.3 0.448 ± 0.073 0.397 ± 0.055 HC x AF x N2 292 ± 4.5 258 ± 3.2 0.173 ± 0.030 0.153 ± 0.061 271 ± 6.6 250 ± 7.5 0.580 ± 0.090 0.535 ± 0.080 HC x AF x N3 292 ± 4.5 260 ± 3.9 0.250 ± 0.057 0.223 ± 0.070 271 ± 6.6 256 ± 7.4 0.630 ± 0.091 0.596 ± 0.085
HC, high compaction; LC, low compaction; C, non-compacted (control); CF, conventional furrow; AF, alternated furrow; N1, low
nitrogen (HC-AF-N2) treatment. Similarly, while the highest seed yield of the year 2007 (267.33 kg da-1) was observed in a non-compacted treatment,
the lowest value (107.67 kg da-1) was seen in a
high-compaction treatment. However, the differences in average seed yields of the treatments were not significant in 2007. Seed yield generally increased with increasing nitrogen doses. Yield values of the year 2007 indicated an increase in seed yield between 17 – 56% with nitrogen doses. Such increases were higher (54, 34 and 56%) in conventional furrows than alternate furrows (25, 17 and 50%).
Conventional furrows always had higher yields than alternate furrows since plant water needs were sufficiently supplied in conventional furrows. Average seed yields decreased with applied water deficit level. Such decreases ranged between 19– 38% based on compaction levels and nitrogen doses. With regard to compaction levels, the yields decreased in general with increasing traffic intensity (Table 5). However, it is interesting to note herein that average yields increased from non-compacted to compacted case but decreased from low-compaction to high-low-compaction. Such decrease rates were distinctively lower in N3 levels of the treatments. Therefore, it was concluded that proper N-supplementation may, to some extent, reduce the negative impacts of soil compaction on seed yields. Botta et al (2004) also observed a seed yield reduction up to 38% based on compaction level at a furrow irrigated soybean experiment in Argentina and found the effects of traffic intensity (number of passes) on soybean seed yield as significant.
While the effects of compaction, irrigation and nitrogen doses on 1000-seed weight were found to be significant (p<0.05) in the year 2006, effects of treatments were not found to be significant in 2007. The lowest 1000-seed weight was observed in high compaction-alternate furrow-low nitrogen (HC-AF-N1) treatment of both years (respectively as 159.87 and 194.67 g). The highest values were observed in non-compacted treatments of both years (respectively as 232.00 and 220.33 g). Generally increased 1000-seed weights were observed with
increasing nitrogen doses in both years. However, while water deficit decreased 1000-seed weights in 2006, an increase was observed in 1000-seed weights of alternate furrows.
With regard to harvest index (HI), again although the effects of treatments were found to be significant in 2006, such effects were not significant in 2007. While the highest HI values were observed in low compaction treatments of both years (0.331 and 0.467, respectively), the lowest values were seen in non-compacted case of the year 2006 (0.113) and low and high compaction cases of the year 2007 (both with 0.370). In general increasing nitrogen levels and water deficit decreased harvest index values. On the other hand, similar to average seed yields, such values increased from non-compacted to compacted case but decreased from low-compaction to high-low-compaction. Sincik et al (2008) also reported insignificant effects of soil compaction and irrigation methods on harvest index. Increasing nitrogen doses generally yielded decreasing HI values.
4. Conclusions
Since soil compaction is evident due to increased traffic over the agricultural field, deep tillage should sometimes be carried out, excessive tillage should be prevented and deep-rooted plants should be included into plant rotation plans to eliminate the negative impacts of soil compaction on yield and yield parameters. Proper fertilization and irrigation management programs may also reduce the effects of compaction but in any a case a certain yield loss is inevitable. KanSched model can reliably be used for irrigation programming in arid and semi-arid regions but about 15-20% adjustments should be made on Kc values of the model.
Acknowledgment
This research was funded by “The Scientific and Technological Research Council of Turkey – TUBİTAK” with a Project Number of TOVAG-104 O 389.
Table 5- Descriptive statistics for investigated parameters Çizelge 5- İncelenen parametrelere ilişkin tanıtıcı istatistikler
Main plots Subplots subplotsSub- Average seed 2006
yield (kg da-1) Average 1000seed weight (g) Harvest index
C
CF N1N2 75.92 ± 5.05 c1B130.93 ± 6.60 a1A 209.80 ± 7.05 b1A 228.20 ± 8.90 a2B 0.186 ± 0.044 b1A0.246 ± 0.070 a1A
N3 95.53 ± 6.15 b1A 226.60 ± 8.19 a1A 0.171 ± 0.033 b1A
AF N1N2 81.72 ± 5.45 ab1A94.63 ± 6.10 a1AB 195.40 ± 6.95 c1A213.20 ± 7.15 b1A 0.176 ± 0.038 a1A0.113 ± 0.011 b1A
N3 89.92 ± 5.65 a1B 232.00 ± 9.50 a1A 0.123 ± 0.015 b1A
LC
CF N1N2 120.27 ± 6.50 a1A70.71 ± 4.90 c2B 214.80 ± 7.85 a1A211.60 ± 7.15 a2B 0.331 ± 0.071 a1A0.151 ± 0.022 b2AB
N3 82.77 ± 5.50 b2B 216.00 ± 8.05 a2B 0.143 ± 0.015 b1B
AF N1N2 69.71 ± 4.45 b1B80.13 ± 5.05 a1 B 209.80 ± 7.90 a2A215.80 ± 8.90 a1A 0.232 ± 0.051 a1A0.204 ± 0.044 a1A
N3 80.75 ± 5.30 a1A 203.40 ± 6,98 a1A 0.184 ± 0.041 a1A
HC
CF N1N2 51.63 ± 4.00 a1C59.85 ± 4.05 a1C 170.68 ± 6.68 b1A167.38 ± 6,45 b1A 0.169 ± 0.029 a1A0.159 ± 0.025 a1A
N3 63.73 ± 4.15 a1C 171.78 ± 6.78 a1A 0.182 ± 0.039 a1A
AF N1N2 48.27 ± 3.21 b1C44.68 ± 3.15 b1C 159.87 ± 6.45 b1A176.43 ± 6.90 b1A 0.226 ± 0.045 a1A0.146 ± 0.020 a1A
N3 65.05 ± 4.25 a1B 173.80 ± 6.90 a1B 0.238 ± 0.063 a1A
2007 C CF N1N2 173.67 ± 5.00 ns235.33 ± 6.15 212.00 ± 8.10 ns213.33 ± 8.27 0.430 ± 0.055 ns0.407 ± 0.041 N3 267.33 ± 6.80 220.33 ± 9.40 0.383 ± 0.037 AF N1N2 137.32 ± 3.95148.66 ± 4.20 213.32 ± 8.11211.67 ± 7.90 0.427 ± 0.0550.387 ± 0.040 N3 171.67 ± 4.85 212.00 ± 7.95 0.390 ± 0.040 LC CF N1N2 187.00 ± 5.50 225.67 ± 5.85 194.00 ± 5.95215.00 ± 8.48 0.467 ± 0.0700.417 ± 0.051 N3 250.67 ± 6.45 218.00 ± 8.90 0.370 ± 0.015 AF N1N2 151.00 ± 4.25139.00 ± 3.95 196.67 ± 6.70206.67 ± 7.10 0.458 ± 0.0690.413 ± 0.043 N3 177.33 ± 5.15 205.33 ± 7.05 0.387 ± 0.040 HC CF N1N2 140.67 ± 4.00190.73 ± 5.70 195.33 ± 6.42211.00 ± 7.35 0.437 ± 0.0550.390 ± 0.040 N3 218.33 ± 5.75 209.67 ± 7.20 0.370 ± 0.015 AF N1N2 107.67 ± 3.75145.00 ± 4.15 194.67 ± 6.30198.33 ± 6.75 0.440 ± 0.0060.413 ± 0.043 N3 161.33 ± 4.75 199.00 ± 6.95 0.373 ± 0.022
HC, high compaction; LC, low compaction; C, non-compacted (control); CF, conventional furrow; AF, alternated furrow; N1, low
nitrogen (6 kg da-1); N2, normal nitrogen (9 kg da-1); N3, high nitrogen (12 kg da-1); *, sane letters are not different; ns, not significant.
Small letters (a,b,c) are used for nitrogen levels, numbers (1,2) for irrigation methods and capital letters (A,B,C) for compaction levels to indicate different means.
References
Aküzüm T, Çakmak B & Gökalp Z (2010). Evaluation of water resources management in Turkey. Proceedings of the 1st National Water Resources Management Symposium 20-22 October, Karaman, Turkey, pp.1-15 Arıoğlu H (1990). Oil Crops. Çukurova University
Publications, Text Book, Vol.1, Adana
Botta GF, Jorajuria D, Balbuena R & Rosatto H (2004). Mechanical and cropping behavior of direct drillede soil under different traffic intensities: effect on soybean yields. Soil and Tillage Research 78:53-58 Botta GF, Jorajuria D, Balbuena R, Rosatto H & Ferrero
C (2006). Ligth tractor traffic frequency on soil compaction in the rolling pampa region of Argentina. Soil and Tillage Research 86:9-14
Çakmak B, Uçar Y & Aküzüm T (2007). Water resources management, problems and solutions for Turkey. Proceedings of the International Congress on River Basin Management (2), 22-24 March, Antalya, Turkey, pp. 867-880
Clark G A, Rogers D H & Briggeman S (2002). KANSCHED: An ET-based irrigation scheduling tool for Kansas summer annual crops.” K-State University Research and Extension, Available at: http://www. ksre.ksu.edu.
Czyz E & Tomaszewska J (2004). Changes of aeration conditions and the yield of sugar beet on sandy soil of different density. Polish Journal of Soil Science 26
(1):1 – 9
FAO (2012). Guidelines for designing and evaluating surface irrigation systems. FAO Corporate Document Repository, Available: http:// www.fao.org
Graterol Y E, Eisenhauer D E & Elmore R W (1993). Alternate-furrow irrigation for soybean production. Agricultural Water Management 24(2):33-145 Howell T A & Tolk J A (1998). Water use efficiency of
corn in the U.S. Southern High Plains. Agronomy Abstracts, 14-15, Madison, WI, USA
Khan A Z, Shah P, Khalil S K & Taj F H (2003). Influence of planting date and plant density on morphological traits of determinate and indeterminate soybean cultivars under temperate environment. Journal of Agronomy 2:146-152
Motavalli P P, Anderson S H & Pengthamkeerati P (2003). Surface compaction and turkey litter on corn growth, N availability, and physical properties of a clay-pan soil. Field Crop Research 84:303-318
Öz M (2008). Nitrogen rate and plant population effects on yield and yield components in soybean. African Journal of Biotechnology 7 (24): 4464-4470
Radford BJ, Yule DF, McGarry D & Palyford C (2001). Crop response to applied soil compaction and to compaction repair treatments. Soil and Tillage Research 61:157-166
Radford BJ, Yule DF, McGarry D & Palyford C (2007). Amelioration of soil compaction can take 5 years on a vertisol under no till in the semi-arid subtropics. Soil and Tillage Research 97: 249-255
Sincik M, Candogan B N, Demirtas C, Buyukcangaz H, Yazgan S & Goksoy A T (2008). Deficit irrigation of soya bean in sub-humid climate. Crop Science
194:200-205
Soane B D & Van Ouwerkerk C (1995). Implications of soil compaction in crop production for the quality of the environment. Soil Tillage Research 35: 5 – 22 Şimşek M, Boydak E, Gerçek S & Kırnak H (2001).
Harran Ovası Koşullarında Farklı Sulama ve Sıra Aralıklarında Yağmurlama-Damla Sulama Yöntemleriyle Sulanan Soya Fasulyesinin Su Verim İlişkisinin Saptanması. Tarım Bilimleri Dergisi-Journal of Agricultural Sciences 7(3): 88-93
Tüzüner A, Korucu N, Börekçi M, Gedikoğlu İ, Sönmez B, Eyyüboğlu F & Ağar A (1990). Soil and water analyses laboratuary handbook. General Directorate of Rural Affairs, Ankara
Van Ouwerkerk C & Soane B D (1994). Conclusions and recommendations for further research on soil compaction in crop production. In: Soane, B.D., Van Ouwerkerk, C. (Eds.), Soil Compaction in Crop Production. Dev. Agric. Eng. 11: 627–642
Williamson J R & Nielsen W A (2003). The effect of soil compaction, profile disturbance and fertilizer application on the growth of eucalypt seedlings in two glasshouse studies. Soil Tillage Research 71:95–107