E-ISSN: 2587-005X http://dergipark.gov.tr/dpusbe
Dumlupınar Üniversitesi Sosyal Bilimler Dergisi, 63, 39-53; 2020
39
ANALYZING THE FINANCIAL PERFORMANCE OF FOOTBALL CLUBS LISTED IN BIST USING ENTROPY BASED COPRAS METHODOLOGY
Namık Kemal ERDOĞAN
Serpil ALTINIRMAK Cumhur ŞAHİN
Çağlar KARAMAŞA
Abstract
Performance analysis has gained significance in financial literature for firms, investors and decision-makers in recent years. The number of studies related to performance analysis has also increased. The performance analysis for football clubs that are traded in BIST in recent years is equally an important concept for investors and decision-makers. The purpose of this study was to conduct the performance analysis of football clubs listed in BIST within the period of 2014-2017. For this purpose, firstly, the ratios related to the performance analysis of football clubs listed in BIST were determined through an in-depth literature review process. The ratios were then prioritized using entropy as one of the most used objective weighting methods in the literature. Following this, football clubs were ranked using COPRAS, as a multi-criteria decision-making technique. According to the findings, Beşiktaş was found as the most successful football club in terms of financial performance within the period of 2014-2017 and Galatasaray was ranked last.
Keywords: Football clubs, Financial ratios, Performance Analysis, Entropy, COPRAS JEL Codes: C44, G23, L83
BIST’TE İŞLEM GÖREN FUTBOL KULÜPLERİNİN FİNANSAL PERFORMANSLARININ ENTROPİ TABANLI COPRAS YÖNTEMİYLE
İNCELENMESİ Öz
Performans analizi firmalar, karar vericiler ve yatırımcılar açısından finans literatüründe önem arz eden konulardan biri olmakta ve buna yönelik yapılan çalışma sayısında ise son yıllarda artış yaşanmaktadır. Son yıllarda BIST’te işlem görmeye başlayan spor kulüpleri için de performanslarının incelenmesi kaçınılmazdır. Bu çalışmanın amacı BIST’te işlem gören futbol kulüplerinin 2014-2017 yılları aralığındaki verilerinden yararlanarak performans analizini gerçekleştirmektir. Bu amaçla ilk olarak BIST’te işlem gören futbol kulüplerinin performanslarının incelenmesine ilişkin oranlar literatür taraması sonucu belirlenmiştir. Belirlenen oranların ağırlıklandırılmasında ise literatürde çok kullanılan objektif ağırlıklandırma yöntemlerinden olan entropiden yararlanılmıştır. Oranların ağırlıkları elde edildikten sonra ise futbol kulüplerinin sıralanmasında çok kriterli karar verme yöntemlerinden olan COPRAS kullanılmıştır. Yapılan analiz sonucunda 2014-2017 yılları aralığındaki finansal oranlar dikkate alındığında Beşiktaş kulübünün en iyi, Galatasaray kulübünün ise en kötü performans gösterdiği belirlenmiştir.
Anahtar Kelimeler: Futbol kulüpleri, Finansal oranlar, Performans analizi, Entropi, COPRAS JEL Kodları: C44, G23,L83
Prof. Dr. Anadolu Üniversitesi İşletme Fakültesi, ORCID 0000-0002-3630-1660 Sorumlu Yazar (Corresponding Author): [email protected].
Prof. Dr. Anadolu Üniversitesi Eskişehir Meslek Yüksekokulu ORCI D 0000-0003-2879-9902. Dr. Öğr. Üyesi, Bilecik Şeyh Edebali Üniversitesi, Bozüyük Meslek Yüksekokulu,
ORCID 0000-0002-8790-5851.
Araş. Gör. Dr., Anadolu Üniversitesi İşletme Fakültesi, ORCID 0000-0003-2454-1824.
40 Introduction
Football is one of the most dominant sports in the world today. While the UN has 193 member states, FIFA, the International Football Federation, has 208 member countries. This indicates that football is a sport or entertainment world wide attraction. The economic dimensions of the sport are certain to grow rapidly. While managers of football teams have focused more on the success in the field, the transformation of football into an industry has led them to pay more attention to the business value of the company. Football clubs don’t make their money only from the transfer of players. They also earn income from various sources such as ticket sales, television broadcasting rights and the sale of apparel. However, since these resources don’t often generate enough funds, football clubs have two options to finance their activities: they may either secure loans from banks or they may attract investors from the stock market (Soygüden, 2016: 22). The first publicly traded football club was Tottenham Hotspur F.C. in 1983. After Tottenham, many football clubs got into the stock market through public offers. This, therefore, shows the importance of capital markets as a source of financing for football clubs today (Akyüz, 2005: 7).
The steps towards the incorporation of football clubs which started in Turkey in the 1980s gained momentum as a result of the increased payments and investments in facilities, while increasing expenses led the clubs to seek low-cost funding. The difficulties encountered in the process of obtaining cheap funds forced football clubs to go public. Beşiktaş and Galatasaray, which had been established as associations, went public in 2002. This was followed by Fenerbahce and Trabzonspor in 2004. Through incorporation, sports clubs get to enjoy the benefits of higher budgets, as well as increased revenues from advertising, broadcasting, sales of apparels and stadium revenues (Karadeniz et al., 2014: 130). This also allows for the increase in the wages paid to football players. Despite the high number of clubs going down the path of incorporation, only Beşiktaş, Galatasaray, Fenerbahce and Trabzonspor are traded in the Borsa Istanbul (BIST). While the main reason for the going public of European football clubs is to earn money, the leading reason for the incorporation of Turkish football clubs is the desire to get rid of their high debt ratios. However, the methods employed by Turkish football clubs in going public differ from one club to another.
The increased payment transfers and investment in facilities in Turkey since the 1980s also led the rate of incorporation of football clubs to pick up the pace. The subsequent rise in the club expenses led the clubs to seek low-cost funding, which prompted them to evaluate the opportunities of going public. In the field of football, which is the sports branch with the highest following in Turkey, there are 4 sports clubs that are open to the public (Devecioğlu, 2004: 12). The publicly traded clubs have had the opportunity both to access long-term funding and to take important steps towards gaining a competitive advantage in the football market. In this study, the financial ratios of these 4 major football clubs registered in BIST are calculated and their financial performances analyzed and compared using the entropy-based COPRAS methodology.
The remainder of the paper is presented as follows: Section two presents the past studies related to football clubs using various techniques. Section three outlines the steps of entropy and COPRAS methods, used with the purpose of weighting and ranking respectively. Section four shows the application of the methods based on the financial ratios of the four football clubs listed in the BIST sports index. Conclusion and suggestions for future studies are given in section five.
1. Literature Review
There are various studies in the literature on the relationship between football success and the financial performance of football clubs. Most studies in foreign literature have generally considered the relationship between the performance of the public football clubs and the performance of their shares in the stock market.
41
Renneboog and Vanbrabant (2000) examined whether there is a relationship between share prices and on-site performances of football clubs traded in London stock exchange using Bayesian statistics. A positive relationship was found between sportive results and share prices. Ashton et al (2003) analyzed the relationship between the performance of England national football team in the period of 1984-2002 and returns of FTSE-100 securities exchange using a case study. Their results found an increase in securities exchange in the case of a win.
Garcia and Rodriguez (2003) examined the clubs compete in Spanish professional football league from the viewpoint of current financial positions. According to the study, approximately 60% of the clubs may have to change their balance sheet structures since they may not be able to sustain their balances by relying on their intangible fixed assets. Duque and Ferreira (2004) evaluated the relationship between the match results and share prices of football clubs listed in Lisbon stock exchange using the ARCH and GARCH methods. They found a positive relationship. Pinnuck and Potter (2006) investigated the relationship between on-site and financial performances of Australian football clubs in the period of 1993-2002. According to the results, the fans’ support positively affects the team’s success and market value. This led to a positive relationship between teams’ market value and on-site performances. Bosca et al (2008) considered the impact of accounting transparency on financial crises from Spanish football clubs. Issues related to transparency led to financial crises and vulnerability in the economic conditions of football clubs. They also found that imbalance of income and expenses often forced football clubs to sell their fixed assets.
Samagaio et al (2009) investigated the relationship between financial and sportive performances of football clubs and securities exchange in England for the period of 1995-2007. Structural equation modeling was applied, and a positive and significant relationship was obtained between stock returns and sportive success. Klein et al (2009) used the Markov model and regression analysis in order to test the relationship between football match results and stock returns for the period of 1990-2006. They did not find a significant relationship. Scholtens and Peenstra (2009) examined the impact of match results on equities performances. For this purpose, they
considered a total of 1274 match results of 8 European football teams. A significant relationship was found.
Göllü (2011) investigated the possible effects of the financial success on the sporting activities of the four major football clubs in Turkey. The study established that there was no relationship between the financial success of the clubs and their sporting achievements during the period examined. Atmaca (2012) used the TOPSIS method to conduct a financial analysis of football clubs, and ratio analysis to determine the financial data. The study examined the asset structure, capital structure, liquidity, financial structure and profitability ratios of the clubs and it was found that, compared to its competitors, Fenerbahçe Sportif Hizmetler Sanayi ve Ticaret AS had the highest performance in 2003-2010. Güngör (2014) used an artificial neural network to examine the relationship between the national and international sporting success of the professional football clubs and their financial performance. For this aim football clubs listed in BIST are considered. The results revealed a strong relationship between sporting success and total income from professional football activities, and a moderate relationship between the sporting success and advertising and sponsorship income. However, no proof of any strong relationship between sporting success, name rights, license income and commercial income were found.
Karadeniz et al (2014) used ratio analysis to measure the financial performance of the four sports clubs whose shares are traded in Borsa Istanbul between 2011-2013 and calculated their Altman Z values to determine their bankruptcy risks. They found the liquidity ratios of the four sports clubs whose shares are traded in Borsa Istanbul to be below accepted standards. The low rates and the consequent negative net working capital are thought to result from the difficulties faced by the
42
sports clubs in fulfilling their short-term liabilities, a factor which may also be blamed for the increasing risks of meeting their short-term debt payment.
Uluyol (2014) analyzed the financial performance of football clubs whose shares were traded in Borsa Istanbul in the 2002-2011 period and made suggestions on how to improve the financial position of football clubs. The study used the basic financial ratios and basic balance sheet data published in the annual financial statements to analyze the financial performance of football clubs. The results revealed that, despite the large investments, Turkish football clubs continue to face financial difficulties due to the fact that they are indebted to large amounts and that they face large and increasing liquidity and profitability problems.
Sarıkahyaoğlu (2015) analyzed the financial performances of the four sports clubs whose shares are traded in Borsa İstanbul between the years 2012-2014 and identified the main problems. The study examined the performances of Beşiktaş, Galatasaray, Fenerbahce and Trabzonspor football clubs. The study used ratio analysis based on the financial statements disclosed to the public. The results revealed serious problems with profitability. The sports clubs were also found to have high debt amounts, insufficient equity capital and other financial problems.
Ulun and Yetim (2016) analyzed the sporting achievement and financial structure of the two major Turkish football clubs which are open to the public, Galatasaray and Fenerbahce. The results showed that the cash and current ratio values of the clubs were below the desired levels while the financial structure ratios were higher than the required level. This position is considered to present a risky financial structure for the clubs. Charles and Darne (2016), used the case analysis method with the purpose of determining the relationship between 18 football teams compete in the FIFA World cup and their stock exchanges. While they found a positive and significant relationship between match results and stock exchange returns for developed countries, it was not valid for developing ones.
Çatı et al (2017) used the entropy and TOPSIS methods to analyze the activities of the five major football clubs in Europe. The results let to the conclusion that there is no relationship between high transfer expenditures and high success. Sakınç et al. (2017) used the TOPSIS method to examine the financial performance of 22 football clubs registered in European stock markets and found that there was no significant relationship between sporting success and financial performance. Ergül (2017) also used the TOPSIS method to determine the nature of the relationship between the financial performance of sports companies and their success in football activities. The results revealed that the success of the Turkish sports clubs in football had a positive effect on the financial statements of the related sports companies. Berkowitz and Depken (2017) applied the least-squares method in order to find the relation between match results of publicly listed football clubs and their financial performance for the 1992-2008 period in England. A negative and significant relationship was obtained between short term financial performance and match losses for football clubs.
Aslan (2018) analyzed the financial performance of the four football clubs in the Turkish league whose shares were traded on the stock exchange between the years of 2014-2016 using ratio analysis. The results revealed that the sports clubs faced problems in fulfilling their financial obligations and did not use their assets effectively. It was also observed that companies were not successful in generating profits. Galariotis et al (2018) used multi-criteria decision-making methods, partial least squares and structural equation modeling to examine financial, business and sportive performances of football clubs in France. They found a positive relationship between a sportive and business performance for football clubs.
Güngör and Kocamış (2018) analyzed the financial performance of public football clubs in the UK. The financial performances of 4 British Football Clubs (Arsenal, Everton, Manchester United, Tottenham Hotspur) were analyzed using the TOPSIS Method and the financial statements for the
43
period of 2012-2016. The study initially calculated the profitability and financial structure ratios of the companies, and then these ratios were converted into a single score showing the company's financial performance using the TOPSIS Method. The results showed that the financial performance rankings of the football clubs have changed over the years. In addition, low return on equity rates were seen as the basic and common problem of football clubs. Škrinjarić and Barišić (2019) used a case study in order to determine the relationship between Zagreb stock Exchange and match results of Croatia national football clubs for the 2014-2018 period. They did not find any significant impact of match results on Stock Exchange returns.
2.Methodology 2.1.Entropy
Entropy is an objective weighting method developed by Shannon (1948). It is one of the most used objective weighting techniques in recent years. The steps followed in this method are explained below:
1-Values of criteria are normalized (𝑐̃𝑖𝑗)based on Eq. (1): 𝑐̃𝑖𝑗 = 𝑐𝑖𝑗
∑𝑛𝑖=1𝑐𝑖𝑗
(1) 2- the entropy level each criterion (𝐸𝑗)is computed based on Eq. (2):
𝐸𝑗 = − 1
𝑙𝑛𝑚∑ 𝑐̃𝑖𝑗 𝑛
𝑖=1 . 𝑙𝑛 𝑐̃𝑖𝑗 (𝑗 = 1,2, … , 𝑚); 0 ≤ 𝐸𝑗 ≤ 1 (2) 3- the degree of variation of each criterion (𝑑𝑗) is calculated based on Eq.(3):
𝑑𝑗 = 1 − 𝐸𝑗 (3) 4- Weights of criteria (𝑤𝑗) in terms of the entropy method are obtained by normalizing the degree of variation values (𝑑𝑗) as Eq.(4):
𝑤𝑗 = 𝑑𝑗 ∑𝑚𝑗=1𝑑𝑗
(4) Weights of criteria acquired by entropy show the structure of data and their inhomogeneity. The larger weight of criterion with respect to the entropy method reflects the larger weight ratio for the criterion.
2.2.COPRAS
The Complex Proportional Assessment method (COPRAS) was developed by Zavadskas, Kaklauskas and Sarka (1994). The COPRAS method has been used in various fields such as assessment of road design solution (Zavadskas et al. (2007)), risk analysis (Yazdani et al. (2011)), maintenance strategy selection (Fouladgar et al. (2012)), supplier selection (Liou et al. (2016)), investment prioritization (Zolfani & Bahrami (2014)), performance measurement (Das et al. (2012)), social media platform selection (Tavana et al. (2013)) and market segment evaluation (Aghdaie et al. (2013)). COPRAS is used for ranking the alternatives after obtaining criteria weights. The steps followed in this method can be summarized as follows:
1-Determine k alternatives and l criteria that are assessed by decision-makers.
2-Construct decision matrix 𝑌 composed of elements namely 𝑦𝑖𝑗that is identified as the value of the ith (𝑖 = 1,2, … , 𝑘) alternative jth (𝑗 = 1,2, … , 𝑙) criterion.
44 𝑌 = [ 𝑦11 𝑦12 ⋯ 𝑦1𝑙 𝑦21 𝑦22 ⋯ 𝑦2𝑙 ⋮ ⋮ ⋱ ⋮ 𝑦𝑘1 𝑦𝑘2 ⋯ 𝑦𝑘𝑙 ] 𝑘𝑥𝑙 (5)
3- Criteria weights 𝑐𝑤𝑗 are determined and considered for analysis. 4- Decision matrix 𝑌 is normalized according to Eq. (6) shown below: 𝑦̅𝑖𝑗 = 𝑦𝑖𝑗
∑𝑘𝑖=1𝑦𝑖𝑗
𝑖 = 1,2, … , 𝑘; 𝑗 = 1,2, … , 𝑙 (6) 5- Weighted normalized decision matrix 𝑍 is constructed and elements of this matrix (𝑧𝑖𝑗) are obtained as follows:
𝑧𝑖𝑗 = 𝑦̅𝑖𝑗. 𝑐𝑤𝑗 𝑖 = 1,2, … , 𝑘; 𝑗 = 1,2, … , 𝑙 (7) 6- Criterion values are computed as a summation according to the optimization way for each alternative and shown as Eq. (8):
𝑅+𝑖 = ∑𝑀𝑚𝑎𝑥𝑧+𝑖𝑗
𝑗=1 ; 𝑅−𝑖 = ∑ 𝑧−𝑖𝑗 𝑀𝑚𝑖𝑛
𝑗=1 (8) Where maximized criteria are represented by the value of 𝑧+𝑖𝑗 and minimized criteria are shown by the value of 𝑧−𝑖𝑗.
The 7-Minimal constituent of the 𝑅−𝑖 is found according to Eq. (9): 𝑅−𝑚𝑖𝑛 = min
𝑖 𝑅−𝑖; 𝑖 = 1,2, … , 𝑀𝑚𝑖𝑛 (9) 8- The score value of each alternative 𝑆𝑉𝑖 is obtained as follows:
𝑆𝑉𝑖 = 𝑅+𝑖+ (𝑅−𝑚𝑖𝑛∑𝑀𝑚𝑖𝑛𝑖=1 𝑅−𝑖) (𝑅−𝑚𝑖𝑛∑ 𝑅−𝑚𝑖𝑛 𝑅−𝑖 𝑀𝑚𝑖𝑛 𝑖=1 ) (10) 9- Optimality criterion for the alternatives 𝑇 is identified as Eq. (11):
𝑇 = max
𝑖 𝑆𝑉𝑖 ; 𝑖 = 1,2, … , 𝑘 (11) 10- Alternatives are ranked according to the descending value of score value 𝑆𝑉𝑖. Thus, the alternative having greater score value gets a higher rank than others.
3. Analysis
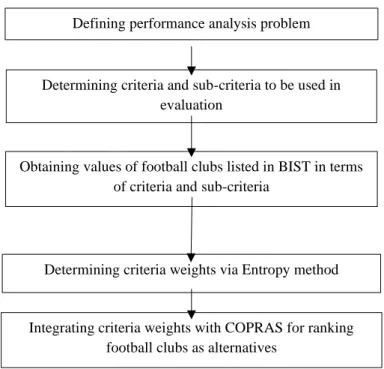
In this study, the entropy-based COPRAS method was used to analyze the performance of football clubs listed in BIST within the period of 2014-2017. Examined period includes four years for presenting the general tendency of football clubs listed in BIST. For this purpose, means of values are considered for applying techniques. The flowchart related to analysis can be seen in Figure 1.
45
Figure 1: Flowchart of Entropy-COPRAS methodology for analysis
As the first step of analysis, the financial ratios of sports clubs were calculated. Ratio analysis is the name given to the mathematical expression that represents the relationship between two items in the financial statements. Ratio analysis, therefore, allows for the acquisition of more detailed information about the company using the financial items in the financial statements. When evaluating the operation results, the relationship between the items in the financial statements and the direction of change in these items is likely to provide better information as opposed to just looking at the items in question.
Various ratios can be used to perform financial analysis. Managers can use ratios to evaluate the performance of the business operations and whether they have achieved their goals or not. Potential investors, on the other hand, may rely on the ratio analysis to make their investment decisions with regard to the future earning the power of the company by looking at the changes in its stock prices, profit distribution policy and increase in company performance. Both individual and institutional creditors use the ratio analysis to assess the solvency of the enterprise and to determine its non-repayment. The ratios used in the financial analysis may be classified differently depending on their intended use and the meaning they carry. Accordingly, there are generally 5 groups in which the ratios are examined according to their aims and functions. These are liquidity ratios, financial ratios, asset utilization ratios, profitability ratios and stock market performance ratios. This study was intended to evaluate the financial performance of 4 sports clubs (Besiktas, Fenerbahce, Galatasaray, Trabzonspor) in the BIST sports index. In the first part of the study, the ratios of clubs were calculated based on the ratio categories obtained from the literature as shown in Table 1. Some of the studies that have considered all of these ratios as classified under the four main categories (liquidity, leverage, efficiency and profitability) include Berk (2010); Orhan & Yazarkan (2011); Karadeniz, Koşan & Kahiloğulları (2014); Jagels & Coltman (2004); Önal, Karadeniz & Koşan (2006) and Ceylan & Korkmaz (2008).
Defining performance analysis problem
Determining criteria and sub-criteria to be used in evaluation
Obtaining values of football clubs listed in BIST in terms of criteria and sub-criteria
Determining criteria weights via Entropy method
Integrating criteria weights with COPRAS for ranking football clubs as alternatives
46 Table 1: Ratio categories according to the literature
Ratio Category Ratios Purpose
Liquidity Ratio Current Ratio
Acid-Test Ratio Cash Ratio
Shows the ability of the firm to cover its short-term debts.
Leverage Ratios Shows the ability to pay long
term debt. Short term debt ratio
Debt to Equity Ratio
Fixed Assets to Long-term liability Ratio
Efficiency Ratios
Shows whether the assets of the enterprise are being used efficiently
Accounts Receivable Turnover Rate Accounts Receivable Turnover Period Net Working Capital Turnover Rate
Equity Turnover Rate Assets Turnover Rate Fixed Assets Turnover Rate
Profitability Ratios
Gross Profit Margin Net Profit Margin Return on Equity Operating Profit Margin Return on Assets
Shows whether the
enterprise is using its equity, debt and assets effectively and whether it is operating profitably.
Using the ratios, firstly, the decision matrix was constructed by taking the arithmetic mean of each criterion as alternatives. The resultant decision matrix is as shown in Table 2.
47 Table 2: Decision matrix
Criteria Beşiktaş Fenerbahce Galatasaray Trabzonspor
Current ratio 2.71975 2.91 2.82 2.87 Acid test ratio 2.7045 2.8725 2.89 2.87 Cash ratio 2.5055 2.5375 2.54 2.504675 Short term debt ratio 3.1375 3.0675 3.08 3.2025 Debt to equity ratio 2.8625 2.9325 2.92 2.7975 Fixed assets to long
term liability ratio 3.08 3.2075 3.815 4.115 Accounts receivable
turnover rate 15.8025 13.46 6.91 7.26 Accounts receivable
turnover period 33.475 49.3725 97.0525 82.7275 Net working capital
turnover rate 1.39 1.145 1.745 1.9825 Equity turnover rate 3.175 1.7125 0.25 1.3925 Assets turnover rate 3.76 3.2125 2.95425 2.9675 Fixed assets
turnover rate 4.8025 3.865 2.935 3.015 Gross profit margin 2.4775 2.3675 2.3675 2.19 Net profit margin 2.3395 1.99 1.925 1.665 Return on equity 2.42475 2.795 1.28 3.3425 Operating profit margin 2.2725 1.86 2.195 1.8575 Return on assets 3.305 2.19 2.3075 2.125 Then, the normalized decision matrix was obtained as shown in Table 3.
48 Table 3: Normalized decision matrix
Criteria Beşiktaş Fenerbahce Galatasaray Trabzonspor
Current ratio 0.240266 0.257073 0.249122 0.253539 Acid test ratio 0.238555 0.253374 0.254918 0.253153 Cash ratio 0.248372 0.251545 0.251792 0.248291 Short term debt ratio 0.251251 0.245646 0.246647 0.256456 Debt to equity ratio 0.248643 0.254723 0.253637 0.242997 Fixed assets to long
term liability ratio 0.216634 0.225602 0.268331 0.289432 Accounts receivable
turnover rate 0.36384 0.309906 0.159097 0.167156 Accounts receivable
turnover period 0.127462 0.187994 0.369544 0.314999 Net working capital
turnover rate 0.221956 0.182834 0.278643 0.316567 Equity turnover rate 0.486217 0.262251 0.038285 0.213247 Assets turnover rate 0.291603 0.249142 0.229114 0.230141 Fixed assets
turnover rate 0.328545 0.264409 0.200787 0.20626 Gross profit margin 0.263494 0.251795 0.251795 0.232917 Net profit margin 0.29541 0.251278 0.243071 0.210241 Return on equity 0.246361 0.28398 0.130052 0.339607 Operating profit margin 0.277642 0.227245 0.268173 0.22694 Return on assets 0.332914 0.220599 0.232435 0.214052 After constructing the normalized decision matrix 𝐸𝑗, (the entropy level of each criterion), 𝑑𝑗 (degree of variation of each criterion) and 𝑤𝑗 (weights of criteria) values were calculated as shown in Table 4.
49 Table 4: 𝐸𝑗, 𝑑𝑗 and 𝑤𝑗 values and ranking of criteria
Criteria 𝐸𝑗 𝑑𝑗 𝑤𝑗 Ranking
Current ratio 0.999771 0.000229 0.000624 14
Acid test ratio 0.999743 0.000257 0.0007 13
Cash ratio 0.999984 0.000001 0.000004 17
Short term debt ratio 0.999894 0.000106 0.000288 16
Debt to equity ratio 0.999875 0.000125 0.000341 15
Fixed assets to long term liability ratio 0.994822 0.005178 0.014099 9
Accounts receivable turnover rate 0.953896 0.046104 0.125533 3
Accounts receivable turnover period 0.943901 0.056099 0.152746 2
Net working capital turnover rate 0.984604 0.015396 0.04192 5
Equity turnover rate 0.833925 0.166075 0.452191 1
Assets turnover rate 0.996398 0.003602 0.009809 10
Fixed assets turnover rate 0.984928 0.015072 0.041037 6
Gross profit margin 0.999302 0.000698 0.001901 12
Net profit margin 0.994706 0.005294 0.014415 8
Return on equity 0.962766 0.037234 0.101382 4
Operating profit margin 0.996908 0.003092 0.008419 11
Return on assets 0.987311 0.012689 0.034551 7
According to the ranking shown in Table 4, equity turnover ratio was found to be the most essential criterion having a value of 0.452191 while cash ratio was the least essential criterion with a value of 0,000004. After the weights of criteria were found alternatives as football clubs are analyzed
50
according to the multi-criteria decision-making method namely COPRAS. 𝑅+𝑖 (criterion value for maximization), 𝑅−𝑖 (criterion value for minimization) and 𝑆𝑉𝑖 (score value of each alternative) values calculated for firms and the ranking is described in Table 5.
Table 5: Calculated 𝑅+𝑖, 𝑅−𝑖 𝑎𝑛𝑑 𝑆𝑉𝑖 values and ranking of alternatives
Alternatives 𝑅+𝑖 𝑅−𝑖 𝑆𝑉𝑖 Ranking
Beşiktaş 0.338142 0.019626 0.40118 1
Fenerbahçe 0.224406 0.028873 0.267256 2
Galatasaray 0.091036 0.056604 0.112893 4
Trabzonspor 0.193041 0.048272 0.218671 3
According to the 𝑆𝑉𝑖 values, based on the COPRAS method, Beşiktaş football club was found as the most successful alternative according to financial ratios within the period of 2014-2017. On the other hand, Galatasaray football club was found to be the most unsuccessful alternative in terms of the financial ratios within the period of 2014-2017.
4. Conclusions
In this study, Turkish football clubs listed in BIST were considered as alternatives in the period of 2014-2017. Additionally, financial ratios were taken as the criteria for the problem. Turkish football clubs were evaluated based on financial criteria for the period of 2014-2017. For this purpose firstly, entropy, which is the most commonly used objective weighting method was used for weighting the criteria. Then, COPRAS, as a multi-criteria decision-making method, was used to rank the alternatives. The results revealed that equity turnover ratio was the most critical ratio for the evaluation of the financial performance of football clubs. The high equity turnover ratio indicates that the operating capital is used very economically and efficiently. However, a ratio too high may indicate insufficient equity (Akdoğan & Tenker, 2010: 668).
Beşiktaş was found to be the most successful football club in this period while Galatasaray was found to be the least successful football club. On the other hand Fenerbahce was obtained as the second most successful football club and Trabzonspor was ranked third. Managers and investors need to consider the ranking results of Turkish football clubs for preparing future plans. Also managers related to Turkish football clubs can make necessary arrangements in order to overcome financial deficiencies. For future studies, other objective or subjective weighting techniques may be used. Additionally, various MCDM ranking methods may be applied based on these weighting techniques. Also, different areas of application, other than football clubs, may be considered. References
Aghdaie, M. H., Zolfani, S. H., & Zavadskas, E. K. (2013). Market segment evaluation and selection based on the application of fuzzy ahp and copras-g methods. Journal of Business
Economics and Management, 14(1), 213-233.
Akdoğan, N., & Tenker, N. (2010). Finansal tablolar ve mali analiz teknikleri. Ankara: Gazi Kitapevi.
Akyüz, M. E. (2005). Futbol kulüplerinin şirketleşmesi ve halka açılması: Avrupa futbol piyasalarında gelişmeler çerçevesinde Beşiktaş, Fenerbahçe, Galatasaray ve Trabzon örneğinin değerlendirilmesi. Sermaye Piyasası Kurulu Yeterlilik Etüdü, 1-40.
51
Ashton, J., Gerrard B., & Hudson, R. (2003). Economic impact of national sporting success: Evidence from the London stock exchange. Applied Economics Letters, 10(12), 783-785. Aslan, T. (2018). Futbol kulüplerinin finansal performansının oran yöntemiyle analizi: BİST’de
işlem gören futbol kulüpleri üzerine bir uygulama. Muhasebe ve Vergi Uygulamaları
Dergisi, 11(3), 349-362.
Atmaca, M. (2012). İMKB’de işlem gören spor şirketlerinin topsis yöntemi ile performans değerlendirmesi. İktisat, İşletme ve Finans, 27 (320), 91-108.
Berk, N. (2010). Finansal yönetim. İstanbul: Türkmen Kitabevi.
Berkowitz, J. P., & Depken, C. A. (2017). A rational asymmetric reaction to news: Evidence from English football clubs. Review of Quantitative Finance and Accounting, 51(2), 347-374. Bosca, J. E., Liern, V., Martinez, A., & Sala, R. (2008).The Spanish football crisis. European Sport
Management Quarterly, 8(2), 165-177.
Brealy R. A., Myers S. C., & Marcus, A. J. (1995). Fundamentals of corporate finance. İstanbul: Literatür Yayıncılık.
Ceylan, A., & Korkmaz, T. (2008). İşletmelerde finansal yönetim. Bursa: Ekin Basım Yayın Dağıtım.
Charles, A., & Darne, O. (2016). Stock market reactions to FIFA World Cup announcements: An event study. Economics Bulletin, 36(4), 2028-2036.
Çatı, K., Eş, A., & Özevin, O. (2017). Futbol takımlarının finansal ve sportif etkinliklerinin entropi ve topsis yöntemiyle analiz edilmesi: Avrupa’nın 5 büyük ligi ve süper lig üzerine bir uygulama. Uluslararası Yönetim İktisat ve İşletme Dergisi, 13(1), 200-222.
Das, M.C., Sarkar, B., & Ray, S. (2012). A framework to measure relative performance of Indian technical institutions using integrated fuzzy ahp and copras methodology. Socio-Economic
Planning Sciences,46(3),230-241.
Devecioğlu, S. (2004). Halka arz edilen spor kulüplerinin sportif başarıları ile piyasa değerleri arasındaki ilişki. SPORMETRE Beden Eğitimi ve Spor Bilimleri Dergisi, 2(1), 11-18. Duque, J. A., & Brantes, F. (2004). Explaining share price performance of football clubs listed on
the euronext Lisbon. Instituto Superior De Economia E Gestao, 1-38.
Ergül, N. (2017). Spor kulüplerinin futboldaki başarıları ile spor şirketlerinin finansal başarıları arasındaki ilişkinin test edilmesi. Hacettepe Üniversitesi İktisadi ve İdari Bilimler
Fakültesi Dergisi, 35(3), 43-71.
Fouladgar, M. M., Chamzini, A. Y., Lashgari, A., Zavadskas, E. K., & Turskis, Z. (2012). Maintenance strategy selection using ahp and copras under fuzzy environment.
International Journal of Strategic Property Management, 16(1), 85-104.
Galariotis, E., Germain, C., & Zopounidis, C. (2018). A combined methodology for the concurrent evaluation of the business, financial and sports performance of football clubs: The case of France. Annals of Operations Research, 266(1), 589-612.
Garcia, J., & Rodriguez, P. (2003). From sports to stock companies: The financial structure of football in Spain. European Sport Management Quarterly, 3(3), 235-269.
Göllü, E. (2011). Impact of the financial performances of incorporations of football clubs in the domestic league on their sportive performances: A study covering four mayor football clubs in Turkey. I. Uluslararası Spor Ekonomisi ve Yönetimi Kongresi Bildiriler Kitabı, 364-377.
52
Güngör, A. (2014). Futbol endüstrisinde sportif başarı ile finansal performans arasındaki ilişkinin analizi ve Türkiye uygulaması. İstanbul Üniversitesi Sosyal Bilimler Dergisi, 1, 16-36. Güngör, A., & Kocamış, U. (2018). Halka açık futbol kulüplerinde finansal performansın topsis
yöntemi ile analizi: İngiltere uygulaması. Hitit Üniversitesi Sosyal Bilimler Enstitüsü
Dergisi, 11(3), 1846-1859.
Jagels, M. G., & Coltman, M. M. (2004). Hospitality management accounting. New York: Wiley. Karadeniz, E., Koşan, L., & Kahiloğulları, S. (2014). Borsa İstanbul’da işlem gören spor şirketlerinin finansal performansının oran yöntemiyle analizi. Ç.Ü. Sosyal Bilimler
Enstitüsü Dergisi, 23(2), 129-144.
Klein, C., Zwergel, B., & Heiden, S. (2009). On the existence of sports sentiment: The relation between football match results and stock index returns in Europe. Review of Managerial
Science, 3(3), 191-208.
Liou, J. J. H., Tamosaitiene, J., Zavadskas, E. K., & Tzeng, G. H. (2016). New hybrid copras-g madm model for improving and selecting suppliers in green supply chain management.
International Journal of Production Research, 54(1), 114-134.
Orhan, S.,M., & Yazarkan, H. (2011). Küresel finansal krizin İMKB 30 şirketlerine etkilerinin belirlenmesi üzerine bir araştırma. Muhasebe ve Denetime Bakış, 33, 17-28.
Önal, Y. B., Karadeniz E., & Koşan L. (2006).Finansal analiz tekniklerinin otel işletmelerinde stratejik yönetim aracı olarak kullanımına ilişkin teorik bir değerlendirme. Seyahat ve Otel
İşletmeciliği Dergisi, 2(2), 16-25.
Pinnuck, M., & Potter, B. (2006). Impact of on-field football success on the off-field financial performance of afl football clubs. Accounting and Finance, 46(3), 499-517.
Renneboog, L., & Vanbrabant. P. (2000). Share price reactions to sport performances of soccer clubs listed on the London stock exchange and the AIM. Centre of Economic Research,
Working Paper.
Sakınç, İ., Açıkalın, S., & Soygüden, A. (2017). Evaluation of the relationship between financial performance and sport success in European football. Journal of Physical Education and
Sport (JPES), 17(1), 16 – 22.
Samagaio, A., Couto, E., & Caiado, J. (2009). Sporting, financial and stock market performance in English football: An empirical analysis of structural relationships. Centre for Applied
Mathematics and Economics (CEMAPRE) Working Papers.
Sarıkahyaoğlu, O. (2015). Borsa İstanbul’da işlem gören spor kulüplerinin finansal
performanslarının analizi. Yayımlanmamış yüksek lisans projesi, Trakya Üniversitesi
Sosyal Bilimler Enstitüsü, Edirne.
Scholtens, B., & Peenstra, W. (2009). Scoring on the stock exchange? The effect of football matches on stock market returns: An event study. Applied Economics, 41(25), 3231-3237. Shannon, C. E. (1948). The mathematical theory of communication. Bell System Technical
Journal, 27, 379-423.
Škrinjarić, T., & Barišić, P. (2019). Effects of football match results of croatian national team on stock returns: Evidence from Zagreb stock exchange. Zagreb International Review of
Economics & Business, 22(1), 13-45.
Soygüden, A. (2016). Profesyonel futbol kulüplerinin gelir kaynaklarının incelenmesi. Ömer
53
Tavana, M., Momeni, E., Rezaeiniya, N., Mirhedayatian, S. M., & Rezaeiniya, H. (2013). A novel hybrid social media platform selection model using fuzzy anp and copras-g. Expert Systems
with Applications, 40(14), 5694-5702.
Ulun, C., & Yetim, A. (2016). Türkiye’deki futbol kulüplerinin sportif başarı düzeyi ve mali yapı açısından rasyo (oran) analizi ile incelenmesi: Galatasaray ve Fenerbahçe örneği. Sportif
Bakış: Spor ve Eğitim Bilimleri Dergisi, 3(1), 70-81.
Uluyol, O. (2014). Süper lig futbol kulüplerinin finansal performans analizi. Journal of Yasar
University, 9(34), 5716-5731.
Yazdani, M., Alidoosti, A., & Zavadskas, E. K. (2011). Risk analysis of critical infrastructures using fuzzy copras. Economic Research, 24(4), 27-40.
Zavadskas, E. K., Kaklauskas, A., Peldschus, F., & Turskis, Z. (2007). Multi-attribute assessment of road design solutions by using the copras method. The Baltic Journal of Road and Bridge
Engineering, 2(4), 195-203.
Zavadskas, E. K., Kaklauskas, A., & Sarka, V. (1994). The new method of multi-criteria complex proportional assessment of projects. Technological and Economic Development of
Economy, 1, 131-139.
Zolfani, S. H., & Bahrami, M. (2014). Investment prioritizing in high tech industries based on swara-copras approach. Technological and Economic Development of Economy,